Mid-week market update: I wrote last weekend that there was a possibility that the stock market may undergo a melt-up, followed by a crash (see Market melt-up and crash?). That scenario may well be occurring, and I sent out an email to subscribers on Monday stating that my trading account had moved from all-cash to being long stocks.
There are a number of reasons for my tactical position. First, I had set a line in the sand on the weekend. The SPX was overbought, as evidenced by the combination of a weekly close above the upper Bollinger Band, and RSI-14 above 70. In the past, a mean reversion of RSI-14 below 70 was a signal for a correction of 2-5%. That sell signal has not occurred yet.
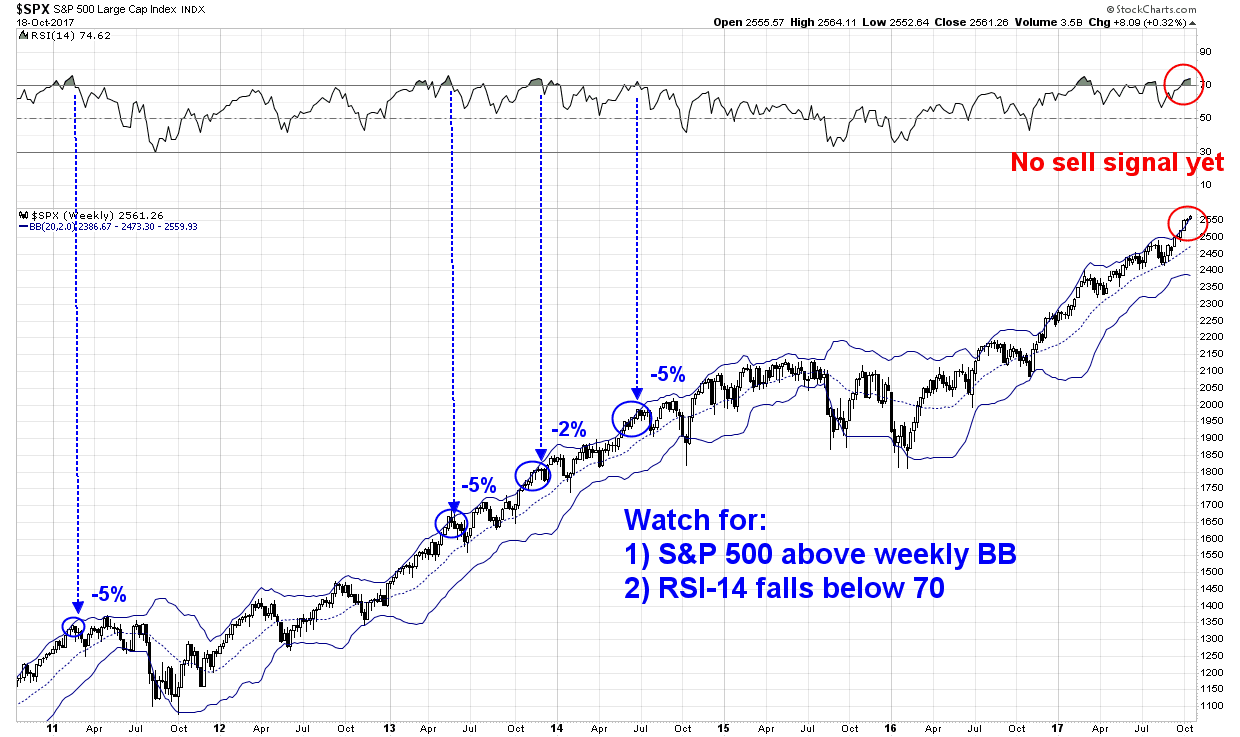
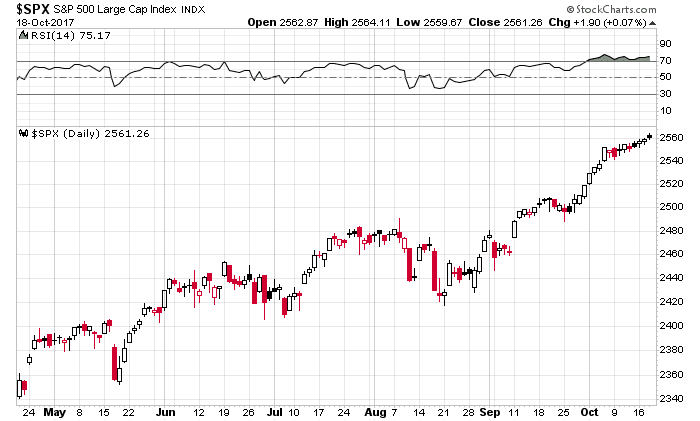
In fact, RSI-14 has not even mean reverted below 70 on the daily SPX chart.
A “good overbought” reading
My former Merrill Lynch Walter Murphy used to call these “good overbought” readings. Andrew Thrasher observed that three consecutive weekly closes above the upper BB are rare events. Such occurrences, which are marked by the dots below in the chart, have not historically been overly bearish.
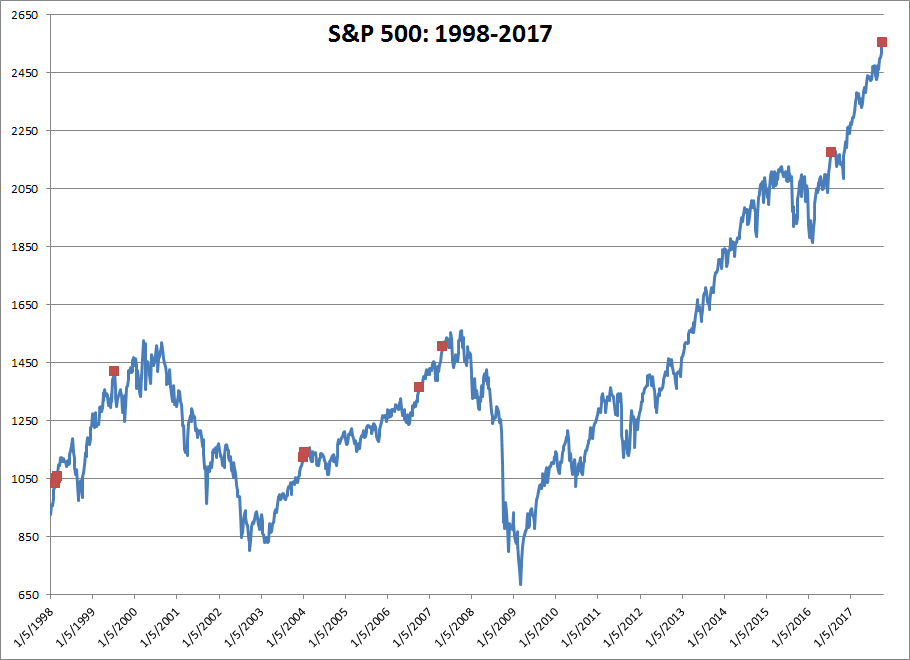
Here is the history of the signals during the 1980-1997 period, which was even more bullish than the 1998-2017 time frame.

It illustrates my point that these are momentum thrusts, and upside momentum have a tendency to carry on for longer than anyone thinks.
Constructive sentiment
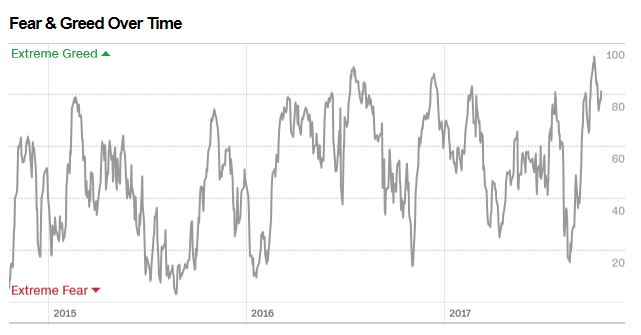
A funny thing happened as stock prices advanced, sentiment became more cautious, which is contrarian bullish. The Fear and Greed Index has retreated from nosebleed levels that was north of 90 and stands at 82 today.
As well, the term structure of the VIX began to flatten, indicating growing fear, even as the market rose. That`s another contrarian bullish sign.

Upside target
How far does the market rise from these levels? It’s impossible to know once the animal spirits start to run wild as they have today. However, I did point out two weeks ago that a combination of techniques pointed to an upside S&P 500 target of about 2600 (see Nearing upside target, now what?).
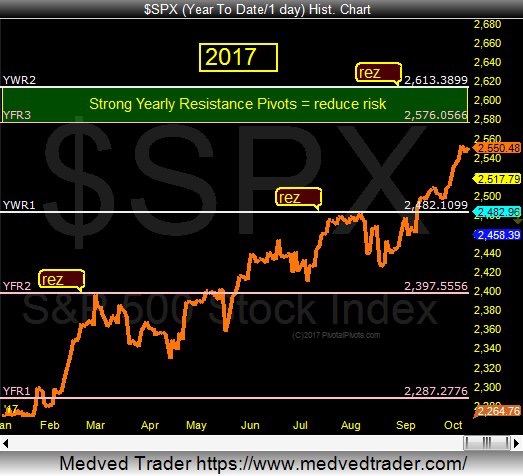
Jeff York also observed that the index is nearing an important pivot, with important resistance at 2573-2615. York found that “price fails at the Yr2 pivots 82% of the time. The average pullback is roughly 100 SPX points or 1,000 DJIA Points.”
The combination of these factors suggests that stock prices can continue to grind upward from current levels, though the potential upside is somewhat limited. My inner trader is tactically staying long, but keeping his stops tight.
Disclosure: Long SPXL
Minsky Theory states that stability leads to a sudden crash which people call a Minsky Moment.
Cam,
Can you get for us the formulas for the 1 and 2 year pivot points?
Sorry, I have no idea what the formula is.