The latest signals of each model are as follows:
- Ultimate market timing model: Buy equities
- Trend Model signal: Bullish
- Trading model: Neutral
Update schedule: I generally update model readings on my site on weekends and tweet mid-week observations at @humblestudent. Subscribers receive real-time alerts of trading model changes, and a hypothetical trading record of those email alerts is shown here.
Subscribers can access the latest signal in real-time here.
The next pain trade
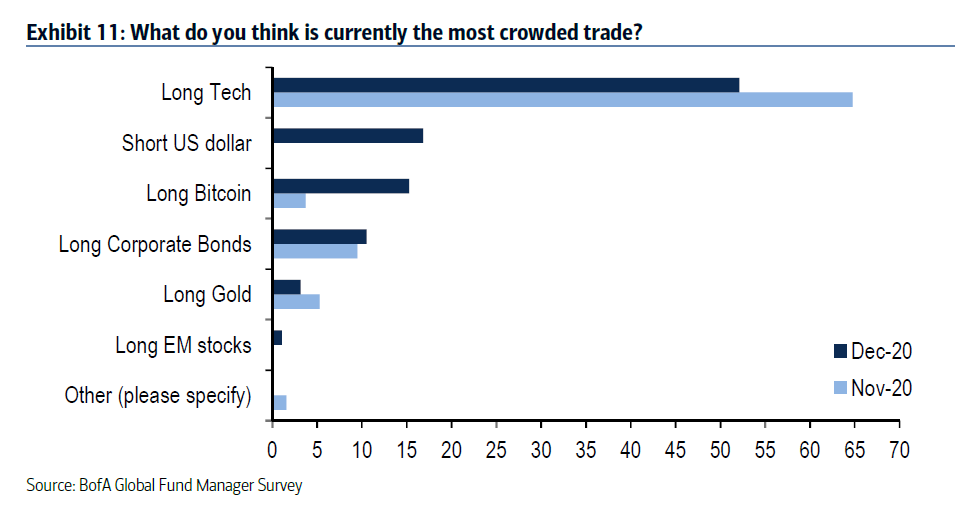
Now that 2020 is over, what’s the next pain trade? I have a few candidates in mind. The latest BoA Global Fund Manager Survey taken in early December described the top two most crowded trade as long technology stocks, and short USD.
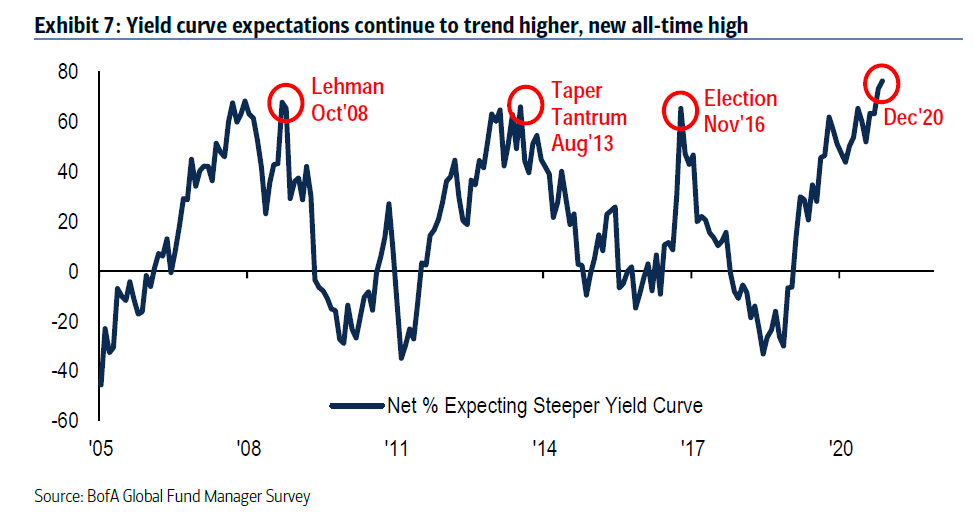
Another source of vulnerability is the expectation of a steepening yield curve. If history is any guide, heightened expectations of a steepening yield curve have resolved with market upsets of differing magnitude.
As a reminder, this survey was taken in December. After the Georgia special Senate elections gave the Democrats the trifecta of the control of the White House, Senate, and House of Representatives, the 10-year Treasury yield surged to over 1%, and the yield curve steepened even further.
All of these vulnerabilities are connected from a cross-asset perspective – the steepening yield curve, long technology stocks, and short USD. It’s all the same pain trade, and it’s equity bearish. Here’s why.
A cross-asset journey
Let’s unpack some of these factor exposures from a cross-asset perspective. Here is the most important chart that investors should consider. In the wake of the Democratic win in Georgia, the 10-year Treasury yield shot up beyond 1%. The 10-year yield broke up through a falling trend line in December, but it has been rising steadily in a channel that began last August.
Here is why that matters. Equity investors will tolerate higher bond yields as long as they are offset by a better growth outlook. But disappointing economic reports, such as the December Jobs Report miss, is a crack in the better growth narrative. In addition, FactSet reported that the Street has been revising EPS downwards, which is a sign of negative fundamental momentum. Quarterly EPS estimates fell about -0.50 across the board in the last three weeks. When will the combination of a rising 10-year Treasury yield and falling EPS estimates put downward pressure on stock prices?
Also consider the long technology stock bet, which is a form of growth stock exposure, from a cross-asset perspective. When growth is scarce, rates fall and investors bid up growth stocks. When growth expectations rise, rates rise and value outperforms growth.
However, Big Tech growth makes up 44.5% of S&P 500 weight, while value sectors are only 30.3%. If growth stocks become a drag on the index, the S&P 500 will face considerable headwinds in trying to advance.
The short USD pain trade
The other crowded short identified by the respondents of the BoA Global Fund Manager Survey is a USD short position. This is another pain trade that is correlated to the others.
First, positioning in the USD is at an extreme, and the market is setting up for a rally that could hurt the short-sellers.
The recent Democratic victory set up the anticipation of better economic growth, which is Dollar positive and pushed up bond yields owing to higher deficits. The spread between the 10-year Treasury yield and the Bund and JGBs are rising, which should attract more funds into the greenback. This is all occurring in a backdrop where the USD Index is testing a key support zone that stretches back to 2018.
All of these conditions are supportive of a reversal in USD weakness. In the last 18 months, stock prices have been inversely correlated with the USD Index. Dollar strength is likely to spark a risk-off episode, starting with EM risk assets that are sensitive to the USD exchange rate.
Waiting for the bearish catalyst
So far, this discussion of the next pain trade is only a trade setup without a bearish catalyst. The stock market may need a final blow-out before correcting.
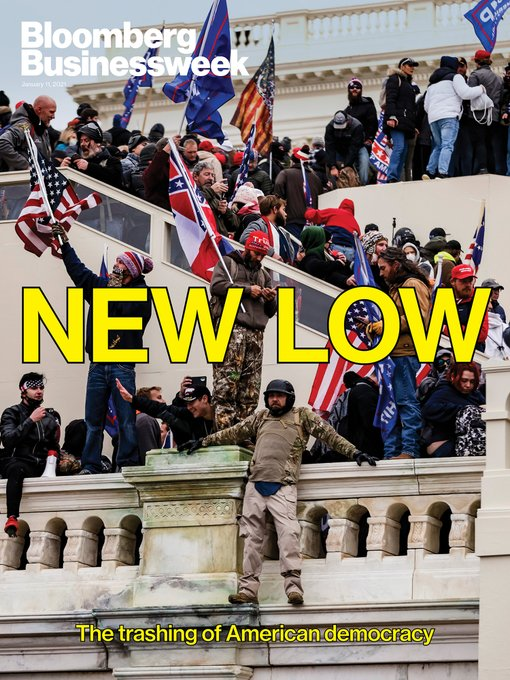
The latest cover of Bloomberg BusinessWeek could be interpreted as a contrarian bullish magazine cover indicator. Indeed, the stock market rallied the day pro-Trump protesters invaded the Capitol.
Price momentum has been extremely strong. The S&P 500 is going on an upper Bollinger Band ride and there were no NYSE new lows Friday. The index spent August on upper BB rides. One resolved in a sideways consolidation, and the other ended with a correction.
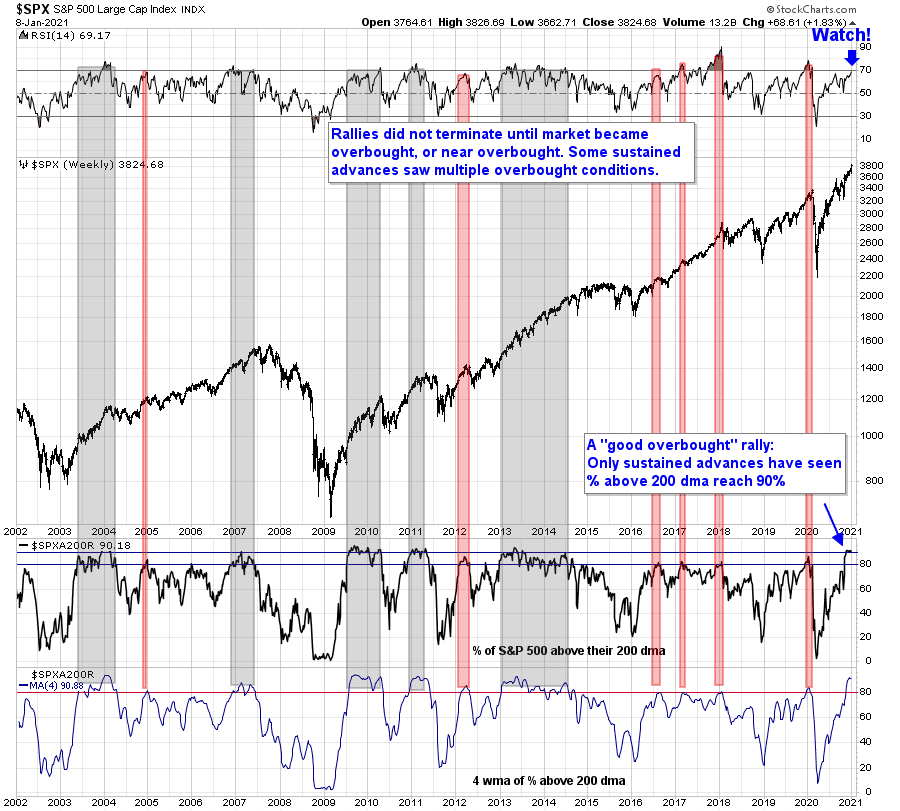
As well, I have been monitoring the percentage of stocks in the S&P 500 that are above their 200-day moving average. In the past, readings of 90% or more have signaled sustained market advances and they don’t end until the 14-week RSI becomes overbought or near overbought. Conditions are very close to an overbought condition, but remember Bob Farrell’s Rule #4: “Exponential rapidly rising or falling markets usually go further than you think, but they do not correct by going sideways.”
While the current market is dominated by strong price momentum, the clash between positive price momentum and negative EPS fundamental momentum will catch eventually up with the bulls. Despite these cautionary signals, I believe any pullback is likely to be no more than 5-10%. How you position for market weakness is therefore a function of your investment objectives, risk tolerance, and investment time horizon.
In summary, the combination of a steepening yield curve, long technology stocks, and short USD are correlated, and constitute the next pain trade. The market is increasingly vulnerable to a 5-10% correction. These conditions are equity bearish, but they lack a bearish trigger. Investment-oriented accounts should be prepared to deploy additional cash should the market pullback. A 5-10% pullback is consistent with normal equity risk and investors who cannot tolerate those levels of drawdowns should rethink their asset allocation. By contrast, traders with shorter-term time horizons should wait to see evidence of a definitive downside break in the face of strong price momentum before turning bearish.


The $SPX:EEM ratio better explains the USD than $SPX to -USD (and is more instructive).
I choose to flip the “Pain Trade” into the opposite the “Gain Trade.”
If Technology is a a Pain Trade then the opposite the Value areas especially the Banks are the under-owned Gain Trade. If Gold is a Pain (and it’s action certainly says it is) then the opposite of the Gold/Copper Ration in the Mining Gain Trade. If Long Corporate Bonds are a Pain Trade then Value stocks whose earnings go up as interest rates rise is the Gain Trade.
I noted on yesterday’s chart on the flow of money in and out of Emerging Market ETFs that every time we had a big outflow like this year, those markets went up for years after. This tells me that is a Gain Trade now and the slight worry on the above chart is the start of a ‘Wall of Worry’ to be climbed.
On the short dollar, we have never had a situation where the Fed Chairman has guaranteed a zero interest policy for a couple of years. It is customary and expected for Central Banks of countries including the US to raise short rates when their currency falls. We are in uncharted ground with their inward looking policy. Remember that companies with overseas earnings will see a big (and possibly huge if the dollar plunges) benefit as the dollar falls. Stocks are the currency Gain Trade.
On the yield curve, once again we have the Fed guaranteeing the zero rates for year. Back in August when the 10 year was at 0.50% , where were these guys? It should have been 100% of them predicting a rise in the yield curve. Portfolio managers focus on their stocks and are bad for their economic outlooks. I’d forget that worry.
Should we worry about the 10 year breaking out above the downtrend line? I see rates were 1.9% pre-Covid. We are far below that and the locked in short rate will cause the 10 year to stay far below the pre-pandemic level. If we have rates below previous levels, with an historic high savings rate where consumers will unleash spending as herd immunity arrives, that is a Gain Trade.
Where the S&P 500 index goes is a mysterious mix of churning from Gainers and Painers as investors swap horses but stay fully invested and away from toxic bonds. Cash is also like a hot potato that needs to go back into stocks pronto. I keep a focus on the fact that this Value/Growth shift only started November 9 on Vaccine Day.
Charts might show an oversold low in a few weeks as Growth takes a dive but Value might be doing okay in the background during that time. They are two different animals right now.
Interesting scenario.
So let’s say we get the -10% decline in the SPX – via an underlying -25% decline in large-cap growth stocks (which comprise about 50% of the index) + a simultaneous +5% overall gain in the other 50% of the index (not necessarily all value, but perhaps a +7% in value versus a -2% decline in everything else that’s neither value nor growth).
That would be a pain trade with a double whammy-> punishing investors holding growth stocks while also punishing wannabe value stock owners waiting for a dip.
Of course, even under that scenario there would be multiple ways to play it including shorting/buying only the SPX – if your only goal is to buy a -10% in the SPX then it doesn’t matter how it gets there – nor will it matter how it recovers. Whether growth leads the way down and then a combination of growth and value leads the way back up, or some other scenario – won’t really matter to you.
But I can certainly see how an overweighting in value/cyclicals might outperform – unless the market decides to punish even value traders before turning back up in earnest.
Let me share what I think will be the biggest winning trade in the next couple of years. When I say big, I mean George Soros bet-against-the-pound big.
The timing is when the Fed has to capitulate in the future as it suddenly, dramatically and surprisingly raises the Fed Funds Rate due to some combination of pressures building to an extreme of inflation and/or US dollar weakness. This is nowhere in sight at the moment and may never happen but I have an indicator that will tell us. Here it is, the Fed Funds futures.
https://refini.tv/3nsexU1
Back in mid December 2018, when the Fed met, announced a 0.25 increase in the Fed Funds and announced their Dot Plot of three more increases in 2019, the Fed Funds 2019 Futures were dropping off a cliff (green circle on the chart). They were going in exactly and powerfully the opposite direction to the Fed announcement. Then weeks later in early January, they announced an about face and were dropping rates. This led to a liftoff in everything, a rocket ship. The sharp drop in the Fed Funds future BEFORE their December to 2.4% from 3% and a continuing drop after to 2%, before they made any public announcement said that insiders knew of the shocking change.
Just imagine if you were privy to the Fed policy shifting from tightening to loosening was about to happen. The S&P was up 10% by the end of January and 20% by the end of February. A far out-of-the-money SPY call option could have been bought for pennies that later went up to many dollars.
Note too, that the stock market was totally unaware of the implications of the new Fed Funds Future plunging dynamic. From the time of the Fed meeting December 16 to the December 24 low, the market fell 10% as all this good news was being hatched at the offices of the Fed. You would think a drop of 1% from 3% to 2% of the December 2019 futures by yearend, would raise some eyebrows, but no.
So, I am going to watch this chart for signs of an unusual (big 50-100 basis point change) upward surge in the futures that is out of line with Fed rhetoric at some point when tensions around inflation and the dollar weakness is high.
I believe insiders can get wind of big changes before a big announcement to the rest of the world. 2018 revealed that. The Fed like all Central Bankers before (as per Bank of England when Soros bet against them) will deny, deny, deny before they flip.
The aftermath of a sudden change in policy will be historic volatility that I hope to be prepared for and take advantage.
Of course, nothing could happen. But after the 2018 experience, I want to be prepared this time.
Very interesting strat.
Would the idea be buying out of the money SPY put options then?
Likely. But Cam might have better ideas like TLT ETF long term bond puts or ?
Fed will not fight the Market. Market always wins, because the whole thing is not just economy. It is also mixed with politics. I think Powell finally understands. Fed is a bureaucracy, while in the Market real money changes hands. There is profit or loss.
So who do you think will be more diligent in the analysis? The Market is the leading indicator for the Fed. I don’t pay too much attention to Fed itself. Just like you, I pay attention to the discrepancy between the Fed and the Market and plan accordingly. Nobody moves the Market like the Fed is capable of. Better believe this.
Powell is going to have a hard time in the not distant future. So just like you, I want to profit too. What I think will happen is that Powell releases trial balloons and test the Market reaction. He is not going to repeat 2018 fiasco.
I don’t know about trial balloons but if Fed Funds futures start leaping higher while the stock market is asleep, I will be preparing for a surprise, shocking big change in policy to be announced.
Is that the 10 year futures note? /TN?
Weaker dollar is what should happen with the trade deficit, but of course it isn’t happening….maybe we need to also listen to the rhetoric about not going negative, because if we join the others with negative rates should weaken the dollar and help the trade deficit.
Everyone is playing “beggar thy neighbor” it really is messed up.
Read Dalio’s Principles if you haven’t already, it does fit
‘The private sector excluding leisure and hospitality gained 403k jobs last month during the winter wave of the pandemic’
https://blogs.uoregon.edu/timduyfedwatch/2021/01/11/monday-morning-notes-1-11-20/
Anything related to the Fed, Tim Duy is worthy of your time. Spot on more often than not.
Unlike last Monday, I’m leaning towards an acceleration of the opening decline into at least Tuesday.
Looks like traders bought the opening dips in XLE/XME/XLF/KRE.
I’ll be watching for failed bounces (or not) as a clue to whether bulls or bears are in charge.
The bounce in value/cyclicals appears to be holding.