Last weekend, I conducted an unscientific and low sample Twitter poll on the market perception of the Georgia special Senate elections. The results were surprising. Respondents were bullish on both a Republican and Democratic sweep.

As the results of the Georgia Senate race became clear, the analyst writing under the pseudonym Jesse Livermore tweeted that these results represent a “fiscal Goldilocks” scenario.

However, the analysis of the investment risk and opportunity is far more nuanced than just a simple bull and bear question.
The stock market isn’t the economy
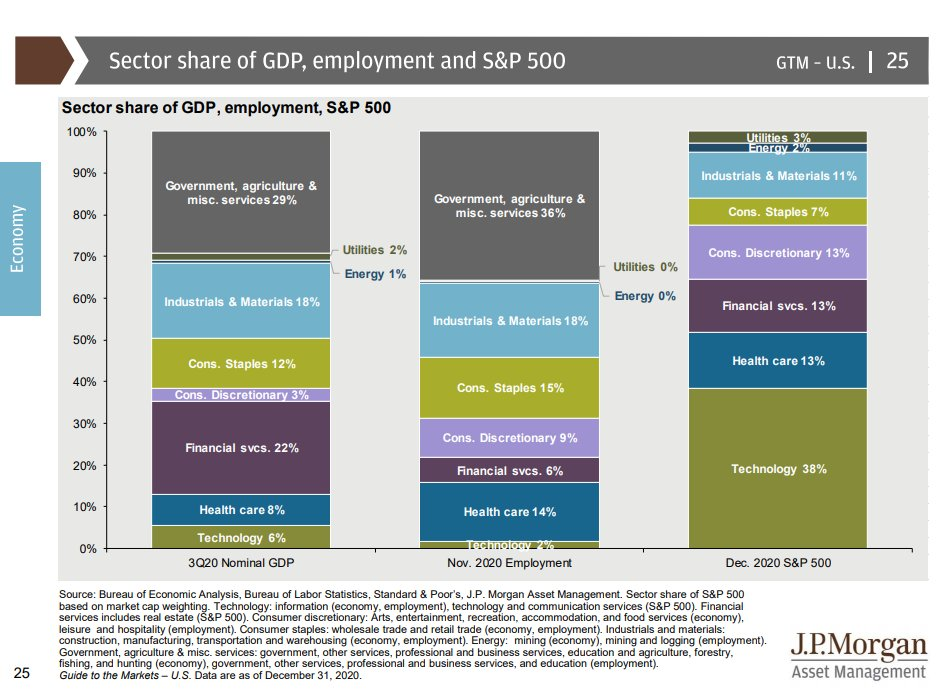
It is trite to say that the stock market isn’t the economy and vice versa. This analysis from JPMorgan Asset Management tells the story. Technology, which includes Communication Services, comprises 6% of GDP, 2% of employment, and 38% of the S&P 500. Add in Amazon and Tesla, and their combined is nearly half of the index weight.
Here is why this disparity matters. When the market opened on Wednesday after the Georgia special elections, NASDAQ stocks fell even as the rest of the market rose on Wednesday. This was attributable to fears of greater antitrust and regulatory scrutiny of Big Tech companies. While there was an element of truth to that interpretation, there is more to the story of growth stock weakness.
As the election results trickled in Tuesday night and a Democratic sweep became apparent, the 10-year Treasury yield spiked to above 1% overnight and the yield curve steepened. These are credit market signals of greater economic growth in anticipation of more fiscal stimulus.
More growth should be bullish, right? Not for large-cap growth stocks. Growth stocks are duration plays, and they act like long bonds in response to changes in interest rates. When the yield curve steepened and bond yields rose, large-cap growth stocks underperformed.

When the yield curve steepened in anticipation of better economic growth, that should be bullish for cyclical stocks. But the cyclical weight in the S&P 500 is only about 20%, while large-cap growth is nearly 44.5%. As growth stocks face headwinds from rising 10-year yields, this index weight disparity makes it difficult to be overly bullish on the S&P 500.

An analysis of the relative returns of the top five sectors of the S&P 500 tells the story of the headwinds facing the index. Large-cap growth (Technology, Communication Services, Consumer Discretionary) relative performance is best described as flat to down. Healthcare relative performance may be trying to bottom, and financial stocks are starting to turn up. The top five sectors make up about 75% of the index weight, and it’s difficult to see how the S&P 500 can advance sustainably without the participation of a majority of its biggest sectors.

Notwithstanding the disparity in index weights, a rising 10-year Treasury yield is historically friendly to value stocks. Yields fall in anticipation of declining economic growth and rise in anticipation of better growth. In an environment where growth is scarce, investors will pile into growth stocks, and in an environment when growth is plentiful, investors favor value stocks. Inasmuch as value sectors represent about 30% of the S&P 500 weight, and growth sectors 45%, the style headwinds for the market are lessened should growth stocks become laggards.

Here comes the cyclical rebound
Regardless, there are plenty of signs that the economy is poised for a cyclical rebound.
Household finances are in good shape. Credit card debt (blue line) has fallen dramatically while checking deposits (red line) have soared. The consumer is ready to spend.

The prospect of even more fiscal stimulus is supportive of even more expansion. As the Democrats tend to be more focused on inequality, the distribution of stimulus money will be tilted towards lower-income Americans, who have a greater propensity to spend additional funds than to save them. Expect a wave of consumer spending to begin in the next six months as the combination of widespread vaccination and stimulus funds reach the wallets of American consumers.

In light of the large negative surprise in the December Jobs Report, it is worthwhile to consider what might happen next as the economy recovers. The headline loss of 140K jobs was led by weakness in the service sector, which was attributable to to huge declines of -372K in food and beverage jobs, -92K in amusement and recreation, and -63K in private education.
Australia is a case study of what pent-up consumer demand looks like in a post-COVID environment. To recap, Australia underwent a full lockdown until late September as a second wave hit. Case counts have since eased dramatically, even without a vaccine.

Like other countries, it is the service sector of the economy that collapsed. Take a look at what happened next. Travel demand has fully recovered.

AirBNB has also enjoyed a revival.

In light of the Australian experience, imagine what would happen to the US economy if a vaccine and more fiscal stimulus were overlaid on top of that?
What’s more, the recovery is global in scope. 82% of manufacturing PMIs are in expansion mode.

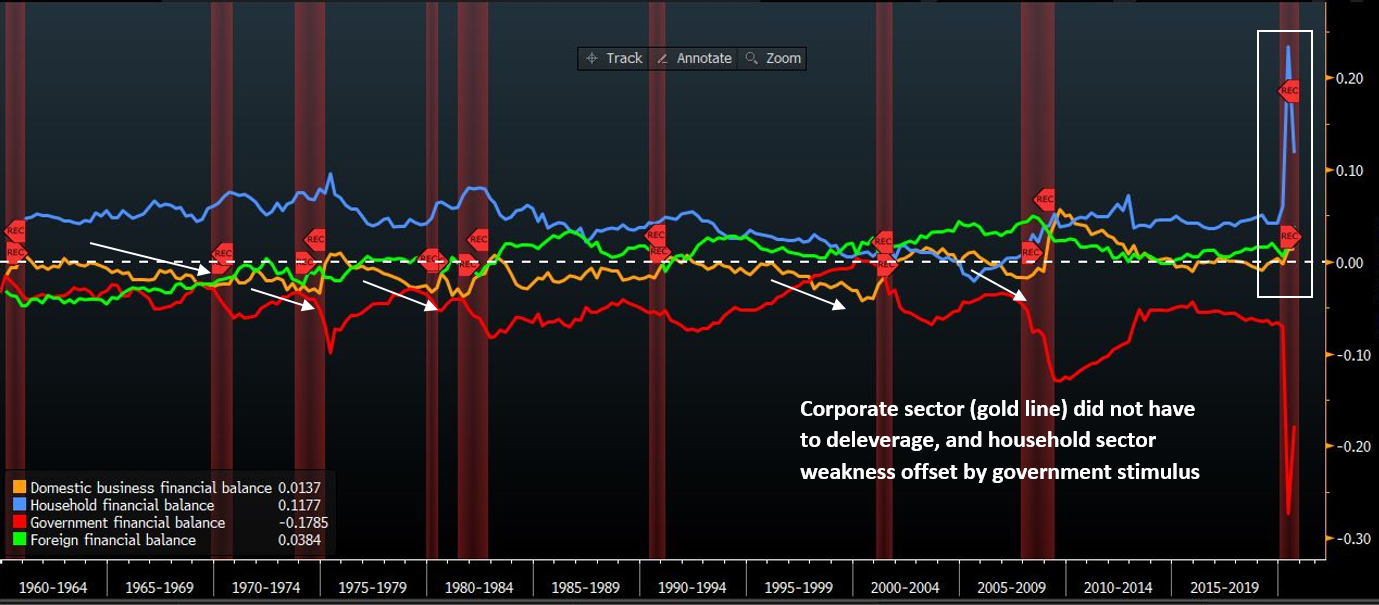
To sum up, the following sectoral balance analysis tells the story of an economy that’s ready to roll. Past recessions have been marked by over-levered household balance sheets (blue line) and corporate sectors that were deleveraging as the economy entered recession. This time, the corporate sector is in reasonably good shape, and weakness in the household sector has been offset by government stimulus. As soon as vaccines becomes widely available, the economy is ready to return to normal.
Too far, too fast?
However, equities may have risen too far, too fast. Willie Delwiche observed that the markets entered 2021 with 96% of global markets above their 50-day moving averages. While these readings have been long-term bullish, the markets are poised for a short-term pause.

The current market recovery is reminiscent of recoveries from recessionary bottoms, such as 1982 and 2009. If the past is any guide, the market is due for a period of consolidation and choppiness.

A global cyclical recovery argues for a greater commitment to emerging markets instead of US large-cap growth stocks, which were the winners of the last cycle. An analysis of EM fund flows shows that investors have not fully embraced the EM as a cyclical recovery vehicle just yet. Fund flows are nowhere near a crescendo, which is constructive.

In conclusion, the Democrats’ trifecta win is bullish for the cyclical revival investment theme, but the S&P 500 may face headwinds because of the excess weighting of large-cap growth stocks in that index. Investors should overweight sectors and groups levered to the cyclical recovery, both within the US and abroad, such as EM. Tactically, the markets are poised to pause their rally in the near-term, and investors should take advantage of any weakness to add to their cyclical exposure.
“Investors should overweight sectors and groups levered to the cyclical recovery, both within the US and abroad, such as EM. Tactically, the markets are poised to pause their rally in the near-term, and investors should take advantage of any weakness to add to their cyclical exposure”.
For the rank and file investors, what ETFs are the ones to be bought here? Need names. Thanks.
I’m buying VVIAX and VSIAX.
My list:
(a) EEM/ VWO/ VEMAX-> emerging markets.
(b) EFV->Developed markets value index (excluding US and Canada).
(c) VTV/ VVIAX->US large-cap value.
(d) VTIAX/ VTRIX->small-mid-large cap value stocks ex-US. I happened upon VTRIX via Paul Merriman’s list while digging around on Thursday for mutual fund candidates that might have been poised for outsized gains on Friday. The two funds seem similar – the difference being that VTRIX is actively managed whereas VTIAX is a passive index fund. As it turns out, VTIAX and VTRIX were my largest gainers on Friday.
(e) XLI->industrials, or what Dwyer often refers to as ‘tanks.’
(f) XLF/KRE->banks.
(g) IJS/VSIAX->US small-cap value.
(h) DLS->international small-cap value. I wouldn’t even consider a mutual fund in this category as it’s just too specialized – when it comes to mutual funds, I try to keep it simple.
(i) XLE/ RYEIX->energy. OIH->oil services in many ways acts like a turbo-charged version of XLE. USO->ST oil futures (but understand what you own, especially the effects of contango and backwardation).
(j) DIA/RYDHX->DJIA. In many ways, the DJIA displays the characteristics of a value fund, so I often use it as a proxy.
(k) IWM/RYRHX->Russell 2000. One advantage of RYRHX is the ability to trade two different windows during the day (730 am pst/ 1250 pm pst).
Non-US: EEM, EMXC, consider EWUS (small cap UK)
US: consider value (IWD, IVE), small cap value (IWN, IJS), XLF, XLE, XLB, XLF.
Happy New Year, Cam.
Great article from you, and comments from rxchen2 and Ken. Most appreciated.
The key to sentiment and technical indicators is adjusting for where you are in the stock market cycle. In the breadth chart above, the high breadth early in the new bull market from the 2016 low and the new bull market from the end of 2018 low, were to be disregarded because they were too early. The later high breadth in 2018 and in early 2020 (pre-Covid) on the other hand were good signals for caution.
So where in the cycle of a shift to Value are we? My Factor research says that the first signs of a new bull market happened mid-May but the real conviction takeoff was the November 9, Vaccine.
In my opinion, we are early days in a new bull market for the economically sensitive cyclical stocks, seven months if it started in May or two if in November.
It may seem obvious but it’s important to truly understand what a value company stock is all about. Their earnings go up and down with the economy often dramatically because their profit margin is slim and higher sales effect the bottom line geometrically. Right now, those profits are low and their PEs are therefore high. At the start of a new bull market, value looks very expensive. Years later when the economy is hot, they will look cheap just before the next recession pulls the rug out from under them.
Look at the chart above on the relative strength of Value versus Growth. It went from 100 to 50 in two years. Value underperformed by 50 bloody percent!!!! Also look at the small bump up in the line at the end for the upswing from the Vaccine low. It’s a pimple. This tells me that Value has a long way to go. Growth became too popular and Value too hated. In behavioral economics we see extreme herding behavior at the end of a momentum trend.
Before the last two years, we didn’t have these Growth/Value extremes so tracking the S&P 500 was fine as a way of capturing general investor sentiment and market valuation. Now, as I’ve said before, it’s like having a herd with a mixture of ostriches and buffalo and trying to figure out what they are doing. I’m tracking them separately. Growth and Value are different species.
Portfolio managers and investors are extremely underweight Value. Value stocks have very little selling pressure because these folks are reluctant to sell their small holding that is now going up and market gurus are now touting. They are looking to buy on a dip. We had a dip on a recent Monday and Value shot back up the next day. If you blink, you miss the dip. This also builds in a reluctance of holders of Value stocks from trying to sell and buy back cheaper like they used to do when Value was in the doghouse.
As interesting commentary on Value is D.V.’s comment above asking for Value ETFs names. Growth ETFs are easy to list. Who the hell has bought a Value one? In two years, the blog will be filled with us championing Value investment names after big profits have been made.
Some Value ETF names. These are not recommendations since I don’t know your circumstances.
General Value = VLUE
Financials = XLF
Major US Banks = KBWB Regional Banks = KRE
US Economy: Industrials XLI, Materials XLB, Energy XLE
Resource countries: Australia EWA, Canada EWC, Emerging Markets EEM
Resource Industries: US Metals and Mines XME, Global Mines PICK, Global Timber WOOD, Agribusiness MOO, Oil Services OIH
Ken,
Thank you for sharing these names.
Do you know of any leveraged Value ETFs (2X or 3X)?
Thanks!
sanjay
https://etfdb.com/etf-trading-strategies/ultimate-etf-trading-cheat-sheet/
Thanks Cam. Great site.
Excellent resource! Thank you.
Sorry, no. I only use unleveraged.
Cam has clearly pointed out that the consumer has the means as well as the desire to spend as more people are vaccinated and additional fiscal stimulus reaches the needy. It seems to me that consumer discretionary, travel, leisure, entertainment should see a big increase. The challenge is weather to invest value vs. growth framework or thematically which may have both value and growth.
Thoughts and comments would be very helpful.
Cam,
Seeing how the TSX (XIC) is dominated with financial, materials, industrials, and energy stocks, would you expect it to outperform the S&P going forward?
Thanks for all the actionable feedback. The names noted here are a who’s who of developed markets in the commodity/resource names, countercyclical commodities, banks, industrials, materials, natural resources etc. Very helpful.