Preface: Explaining our market timing models
We maintain several market timing models, each with differing time horizons. The “Ultimate Market Timing Model” is a long-term market timing model based on the research outlined in our post, Building the ultimate market timing model. This model tends to generate only a handful of signals each decade.
The Trend Asset Allocation Model is an asset allocation model which applies trend following principles based on the inputs of global stock and commodity price. This model has a shorter time horizon and tends to turn over about 4-6 times a year. In essence, it seeks to answer the question, “Is the trend in the global economy expansion (bullish) or contraction (bearish)?”
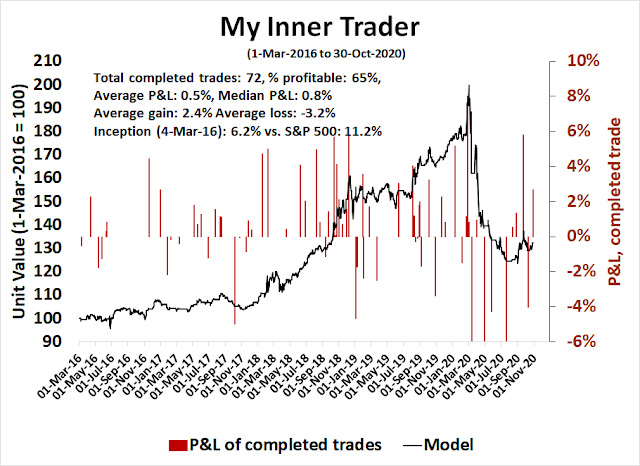
My inner trader uses a trading model, which is a blend of price momentum (is the Trend Model becoming more bullish, or bearish?) and overbought/oversold extremes (don’t buy if the trend is overbought, and vice versa). Subscribers receive real-time alerts of model changes, and a hypothetical trading record of the email alerts are updated weekly here. The hypothetical trading record of the trading model of the real-time alerts that began in March 2016 is shown below.
The latest signals of each model are as follows:
- Ultimate market timing model: Sell equities
- Trend Model signal: Neutral
- Trading model: Neutral
Update schedule: I generally update model readings on my site on weekends and tweet mid-week observations at @humblestudent. Subscribers receive real-time alerts of trading model changes, and a hypothetical trading record of those email alerts is shown here.
Subscribers can access the latest signal in real-time here.
Waiting for the Big Event
The US election is just around the corner, and there isn’t much more to say. I have been monitoring the evolution of SPY implied volatility (IV), and this chart represents the final snapshot before the election. Since I began keeping track in September, IV has spiked at the time of the election and remained elevated into 2021, indicating a high level of anxiety over the results, and the possibility of a contested outcome. It was only recently that contested election anxiety has faded, and IV began to normalize just after the initial spike.
The IV of other asset classes are following a similar pattern to stocks, as represented by SPY. Gold (GLD) and long bond (TLT) IV both surges at election time, and slowly fall afterward.
The upcoming week should provide greater clarity of macro developments. While the actual outcomes are difficult to predict, investors can engage in some scenario planning so that they can be prepared.
The election
First, I would like to point out that this level of anxiety of not unusual. BNP Paribas found that implied volatility – realized volatility also spiked before the election in 2016.
Here is what to watch for on Election Night. As the level of advance and mail-in voting has been very high, not all states will be able to complete most of their counts on Election Night. Pennsylvania, a key swing state, does not begin to process mail-in ballots at 7am on Election Day, and state officials have stated that they may not be able to report a full count until Friday. I refer readers to the analysis last week (see
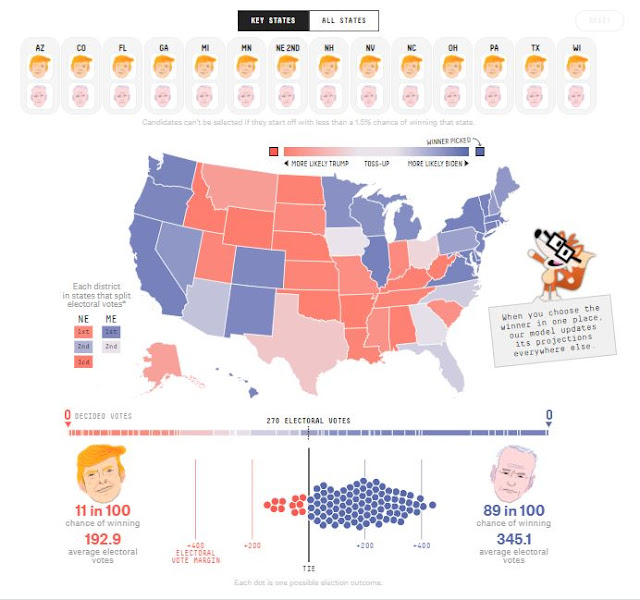
How the Election held the market hostage). Two key battleground states that are expected to report their results in a timely manner are North Carolina and Florida. FiveThirtyEight has a useful tool (link
here) to monitor the odds on Election Night. Both those states are must-wins for Trump. If he loses either of those states, it will be a long night for the President.
The next question is which party gains control of the Senate? The following graphic shows the likely fiscal effects of different scenarios. The most bullish outcome is a Blue Wave, with a Biden Presidency and Democratic Senate, while the most bearish is a Biden win, coupled with a Republican Senate.
New pandemic waves
In addition to election jitters, market concerns are also rising over the appearance of a second pandemic wave in Europe, and a third one in the US. The
Financial Times reported that a new mutation has appeared in Spain, and the new variant is spreading across Europe. France and Germany announced lockdowns last week, joining a host of other European governments.
Here is the glass-half-full version of the analysis. Lockdowns in Europe are constructive. because case counts fall shortly after they begin. Several vaccine Phase III trials are scheduled to report in the next 4-6 weeks, which are hopeful signs for 2021. However, vaccine approval is not assured, and even if one or more vaccines are approved, production and deployment may not be smooth. Investors have to consider the best and worst-case scenarios of vaccine development.
Earnings season
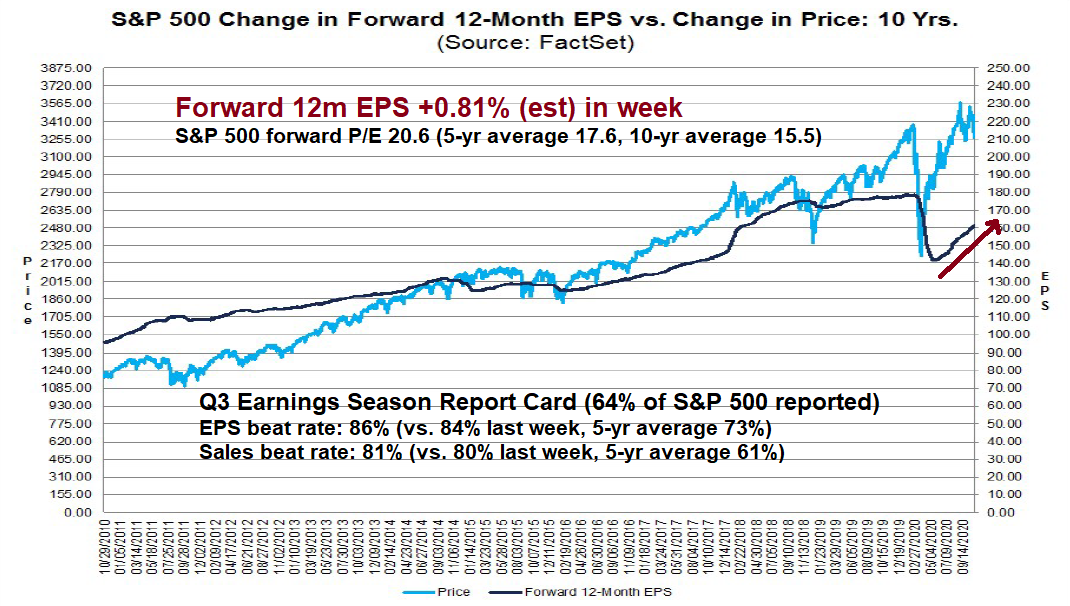
Lastly, the trajectory of equity prices depends on the earnings outlook. So far, the Q3 earnings season has been a success. Both EPS and sales beat rates are above their historical averages, and EPS revisions are positive.
In fact, earnings sentiment is positive across all regions.
However, some of the market’s reaction to earnings reports are disconcerting. Earnings misses are badly punished, but beats are not being rewarded.
Crossroads ahead
The near-term path of equity prices depends on how the macro outlook develops. The market is nearing an important crossroads, and we should get greater clarity in the coming week. Bill Luby of
VIX and More found that the VIX Index historically rises into an election, and declines afterward.
Analysis from Jeff Hirsch of election year seasonal patterns indicates that no matter who wins, November and December have been strong on average. If history is any guide, investors should view the recent market weakness as a buying opportunity, but averages can hide a lot of variation.
Investors can only engage in scenario planning, and stay prepared.
Oversold, but…
Looking to the week ahead, the market is entering the new month in a severely oversold condition. We now have an exacta buy signal from my Trifiect Bottom Spotting Model. As a reminder, the Trifecta Model consists of the following three uncorrelated bottom spotting components:
- Inverted VIX term structure indicating fear (Yes)
- TRIN > 2, indicating a “margin clerk” market involving price-insensitive selling (No)
- Intermediate-term overbought/oversold indicator of stocks above their 50 dma/stocks above their 150 dma < 0.50 (Yes)
In addition, the NASDAQ 100 is behaving remarkably well despite the poor performance of Big Tech stocks that beat earnings expectations but fell last week. The NASDAQ 100 remains in an uptrend relative to the S&P 500.
My inner investor is neutrally positioned at the asset allocation weight specified by his investment policy. Were it not for the looming event risk on the horizon, my inner trader would be inclined to take a shot at going long here.


We are in a truly unprecedented investment world where one’s previous experience isn’t useful and likely dangerous. In such a world, momentum-style investing is the logical strategy. Trends will develop and persist. I will be rebasing my momentum charts (over 80 factors, countries, GICS and subindexes) to November 3, election day and invest in outperformers that make some sense.
I remember a brilliant quote, “If you’re not confused, you simply don’t know what’s going on.”
We are entering what I call the “Grand Reshuffling” of so many things. Momentum, goes with the flow rather than predicts it.
Ken,
In the months following the 2016 election results, the best performing sectors were Financials (+19%) and Energy (+9%) as Trump was expected to tear-down regulations. Industrials and Materials also returned 9%, I assumed, anticipating reshoring of the US industry from China. However, all these sectors faded after the first few months as the fundamentals weighed in and overcame the policy support.
Why should it be different this time? Shouldn’t we just focus on analyzing the industry and company fundamentals especially if the momentum is not to be trusted over the long-term?
Sanjay, thanks for the comment. Momentum strategy flows to the best sectors. When Energy failed after its post-2016 election surge, Technology took over and stayed outperforming for many glorious long term years.
Factor research has found Momentum the best strategy among factors since it morphs to the successful areas.
The reshuffling will happen again. My point is that the future is unknowable and likely surprising but I expect long term trends to reveal themselves and profit momentum-style investors.
Ken, Thank you again for your posts.
I think your momentum strategy can switch from one leading sector to the next without losing most of the gains accumulated in the previous sector.
Read my book to see how I fixed momentum investing so you spot failure early and don’t give up big chunks of your gains.
Thanks, Ken! On my reading list.
Ken, that is a great quote…similar to the old joke “If you can keep your head while others are losing theirs, maybe you haven’t yet heard the news yet!” 😉
Things have reached a point in the market where I’ve had to start dusting off my notes/bookmarks on the Dunning-Kruger effect!!
For example: “…This leads to a fantastic paradox: They must first realize they are ignorant before they can cease to become ignorant. That is the type of problem that would make Confucius smile…”
https://www.joshuakennon.com/mental-model-the-dunning%E2%80%93kruger-effect/
Good luck to all. By the way, thanks for your great work Cam…yesterdays post on Taiwan was especially thought provoking.
For readers suffering from insomnia I add the following worries. Each in its own right may mean nothing but when they happen collectively one has to sit up and take notice. All happened last week:
: The vix has clearly sailed over its 200 day moving average.
: The dollar index ($dxy) has clearly broken its downtrend line.
: The 20 year Bond Index has closed below its 200 day moving average.
: The German Dax Index has broken down and confirmed a major top.
Some important data points are now in play i.e. The September 2 high, the lower October 12 high and the rally bottom of September 12 on the S&P 500. The breach and close below or above these points will likely portend a major move. For now we can look forward to a rally as the market is oversold. The quality and the move will tell us the health of the market. Enjoy the ride !!!
Its a given that the election results will be contested in a few states. Legal action that will effect the outcome of elections in TX, FL, PN, MI, and WI are already in the news.
Reference:
https://www.wsj.com/articles/lawyers-prepare-for-court-battles-in-pennsylvania-michigan-and-wisconsin-11604156400
https://www.statesman.com/news/20201030/court-fight-over-harris-county-drive-thru-votes-raises-alarm
Market declined roughly 10% leading up to the election in 2016 when Hillary was almost certain to win due to her proposed policy prescriptions. Similarly, the market has declined roughly 9%, pricing in a likely Biden win.
The big surprise would be a Trump win. Democrats will more than likely come to a quick agreement on a stimulus bill. The market would respond favorably.
I think Senate will go the way top of the ticket goes. It would be a favorable set up either way.
Good point!
Based on what I’ve seen so far in futures action, I’m looking for a green open. Which is too bad, because I’m hoping to buy into a steep decline.
RX, market always does the opposite of what I think is going to happen!
You would think that after thirty years of trading, I would have adjusted to the cycle of wins and losses that are an inescapable part of this game, but no.
It’s kind of like playing a sport. We always play to win, and any losses (however inevitable) are taken hard.
I had a good run last week – basically not only sidestepping the declines but actually booking a decent gain for the week. Yet here I am, upset at the prospect of heading into a gap-up open with no positions.
It generally takes about thirty minutes for me to get over the disappointment and formulate a new plan.
IV says 100+ point range on the S&P 500 expected this week.
Reopening BAC @ 23.6x/ AMZN @ 304x.
AAPL @ 109.9x.
GILD @ 58.6x.
Taking another swing at SNAP.
QQQ @ 272.4x.
https://tradingeconomics.com/united-states/business-confidence
The ISM Manufacturing PMI for the United States jumped to 59.3 in October of 2020 from 55.4 in September, beating market forecasts of 56.4. The reading pointed to the strongest increase in factory activity since August of 2018, amid faster increases in new orders (67.9 vs 60.2) and production (63 vs 61) and a rebound in employment (53.2 vs 49.6) and inventories (51.9 vs 47.1).
XLE @ 29.
Good chance we pull back into midday for an opportunity to open/add.
My concern, of course, is what if we don’t.
EEM @ 45.1x. BABA @ 309.5x.
I really hate to chase, but I’m going to have to suck it up and open a 25% position in RYSPX at the 730 window.
My biggest gainers thus far are BAC/ XLE. Biggest loser is AMZN. Probably a tell right here.
With the exception of RYSPX, I’ve added second allotments to all of the above on what I think may be the extent of the morning pullback. If I’m wrong, I’ll exit the second allotments and hang tight.
Taking a flyer on NIO on the pullback here.
The bigger picture is that the major indexes are still well off the September highs. The election risk is high, but the risk applies in both directions – we could gap down hard, but we could also gap up hard. So being partially positioned gives me something to work with/ something to manage. Whereas being sidelined presents (at least IMO) an even higher risk (should markets take off from here).
Texas is polling within margin of error in favor of Trump… about 4%
Fear and Greed @ 24. That’s what I call a comfortable reading.
Unfortunately, I need to trim back on positions here.
The silver lining being that I’m now able to look forward to reopening at lower levels.
Adding a position in BIDU.
Reopening a few positions.
/ES 3275 is held again, purchased more shares down here and hoping it holds. I am positioned for a post election bounce scenario. Could be a quick trip to 3225 if this breaks down from here though…
I think risk is to the upside. Many if not most are waiting for a post-election signal to buy into or sell short. What if it turns out the real buying opp was last week’s -5% decline?
agreed, i thought about this a lot over the weekend and decided my purchases last week didn’t leave me positioned aggressively enough for the upside risk here. Like you, I was hoping we would open in the hole so I could add, but was happy to see we faded into support for an easy entry point, and now things are looking very constructive to me on this bounce. If peak pre-election uncertainty has us bouncing around 3300 we have a lot of upside potential here depending on how things go tomorrow… event risk is of course extreme, but I’m betting on society continuing to function as normal as my base case (but mentally prepared to be disappointed and wrong on this).
Nice move, Jarad – I had 3280 as support, and thus 3275->3308 qualifies as an undercut-and-recover move.
The market did a good job of gapping up to frustrate underinvested traders and then shaking the tree.
Starter position in RYSPX was opened @ 59.70 at the 730 window->a +1.22% premium to Friday’s close – a little better than the +1.45% premium I had expected. At this point, the plan is to add to the position end of day.
RYSPX closes the day priced exactly where I was able to open a starter position this window – 59.70. So I’m back in the SPY game at a +1.22% premium.
Added to RYSPX and opened a smaller position in RYOCX (Rydex version of QQQ) at the close.
More good news. Hulbert’s sentiment index closed in the low twenties, 56 percentage points below the Oct 15 high.