RealMoney columnist Helene Meisler asked rhetorically in an article where her readers thought we are in the equity sentiment cycle. She concluded that the market is in the “subtle warning” phase, though she would allow that the “overt warning” phase was also possible.

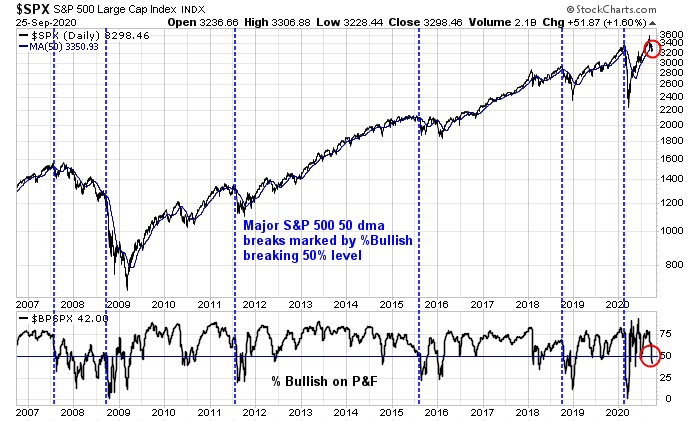
I agree. This retreat is acting like the start of a major pullback. The S&P 500 recently violated its 50 day moving average (dma). Past major pullbacks that began with 50 dma breaks were marked by the percent of S&P 500 bullish on point and figure charts plunging below 50%. To be sure, this does not assure us of a significant downturn, though it represents a sufficient though not necessary condition for one.
Two weeks ago, I discussed the magnitude of market weakness (see How far can the market fall?), with the caveat that those were not targets, but estimates of downside potential. This week, I outline some techniques on how to spot a market bottom.
The retreat is only starting
Evidence is gathering that the market weakness is only starting. From a top-down perspective, the Citigroup US Economic Surprise Index, which measures whether economic data is beating or missing expectations, has topped out and it is rolling over.

JPMorgan equity strategists pointed out that earnings estimates, are also weakening after peaking out, especially in the US.

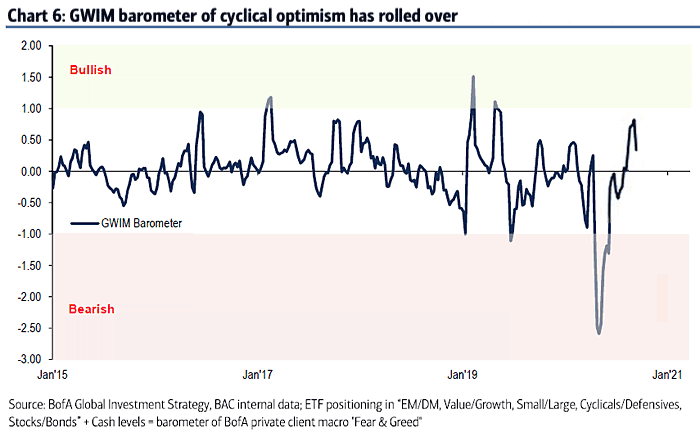
BoA reported that its private client holdings survey of cyclical optimism has peaked out and weakening.
Equally worrisome is the strength of the USD Index. The USD has been inversely correlated with the S&P 500 since the March low. Moreover, the AUDJPY exchange rate, which is another key foreign exchange risk appetite indicator, is weakening.

Arguably, USD strength is a sign that the market is growing concerned about the waning growth outlook. In addition, the appearance of a second pandemic wave in Europe has created doubts about the durability of a global cyclical rebound. Consequently, gold prices, which tend to be inversely correlated to the USD, have retreated below an important resistance turned support level, and the inflation expectations ETF was rejected at a falling trend line.

The market appears to be setting up for a prolonged period of heightened volatility. My survey of SPY at-the-money option pricing shows that implied volatility remains high and peaks out in mid-December, which is well after the election.

With Joe Biden ahead in the polls, the market is positioning for a loss by the incumbent, though we may get more clarity after next week’s debate. While the economy is not the only variable that affect voter intentions, this JPMorgan analysis shows a correlation between Trump support and employment levels, with key swing states highlighted. As the cyclical outlook weakens, this will creates headwinds for Trump.
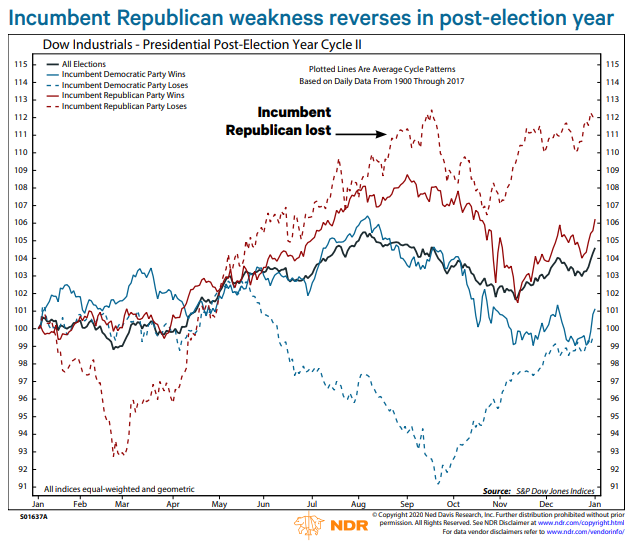
Ed Clissold of Ned Davis Research reported that incumbent Republican losses have historically been unfriendly to equity prices.

In the year after the election, the stock market has historically not bottomed out until early March in years when the incumbent Republican loses the White House.
As the large cap NASDAQ leadership breaks down after a terrific run, investors are reminded to heed the following Bob Farrell’s Rules of Investing:
- Rule #2: “Excesses in one direction will lead to an opposite excess in the other direction”; and
- Rule #4: “Exponential rapidly rising or falling markets usually go further than you think, but they do not correct by going sideways”.

The combination of technical breakdowns in large cap NASDAQ stocks, retreating cross-asset risk appetite, and nervousness over the election is setting up for a significant drawdown in equity prices over the next few weeks and months.
Spotting the market bottom
With that preface, here are some signposts of a durable market bottom. These are intermediate term timing indicators. They will not pinpoint the precise bottom, but they will identify attractive levels to be buying. I don’t expect that they will all flash buy signals simultaneously, but a majority should be bullish at a market bottom.
The first is insider buying. This group of “smart investors” have tended to be relatively prescient at market bottoms, though they can be early. Normally, insider selling swamps buying activity. I would look for clusters of insider buying that exceed selling.
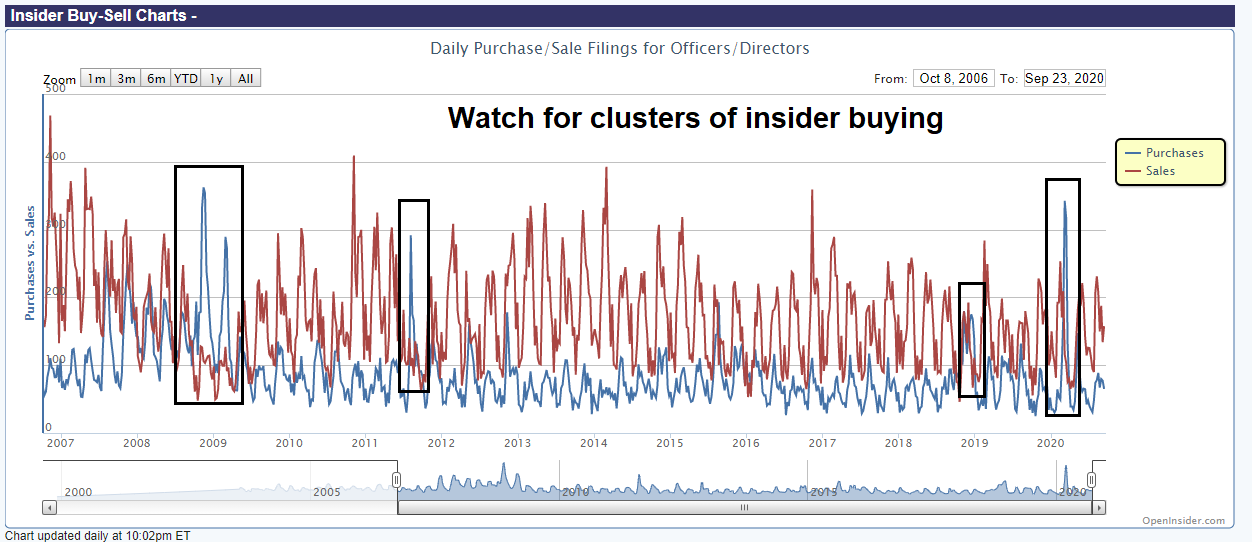
The one caveat about insider activity signals is they are not precise market timing indicators. Insiders were early at the bottom in 2008-09, and they began buying in late 2008 ahead of the final bottom in March 2009.

Where are we now? There are no signs of feverish insider buying. Instead, Bloomberg reported a flood of insider sales.
Corporate executives and officers at S&P 500 companies were busy unloading shares of their own firms over the last four weeks. The selling picked up so much versus buying that a measure of insider velocity tracked by Sundial Capital Research pointed to the fastest exit from stocks since 2012.

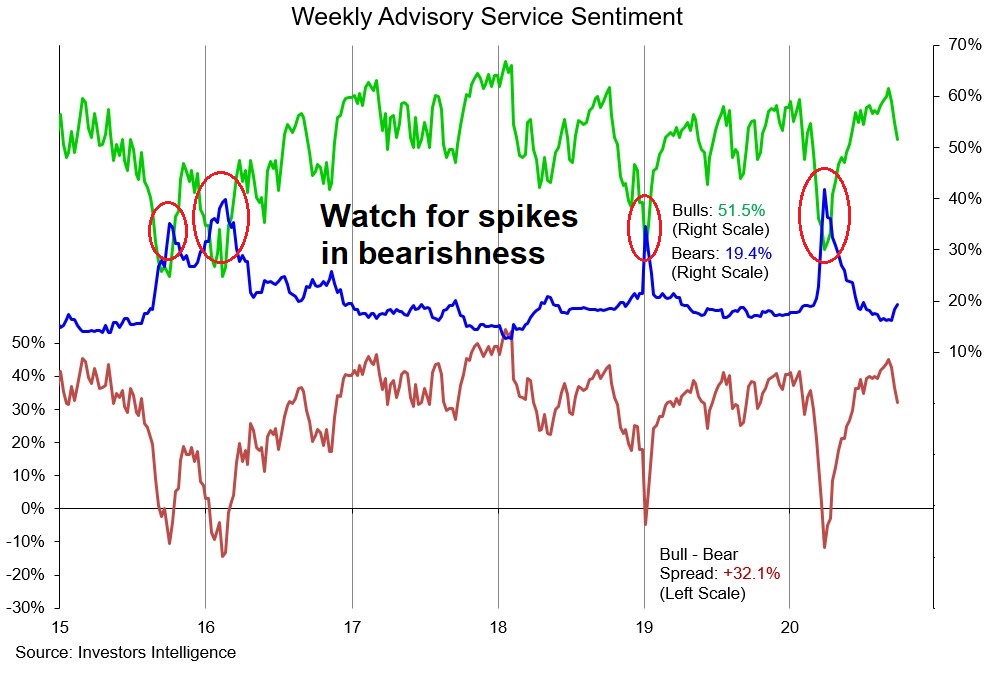
The second class of bottom spotting indicators is investor sentiment. Sentiment surveys, such as Investors Intelligence, have generally not recycled to a bearish extreme. While the recent decline in bullishness is constructive, I would like to see bearish sentiment soar. In the past, durable market bottoms have not been formed without a spike in bearishness.
Lastly, I am also watching for signs of an intermediate term oversold extrme. In the past, the combination of an oversold condition in the Zweig Breadth Thrust Indicator (ZBT) and a negative reading in the NYSE McClellan Summation Index (NYSI) has been reasonably a good signal of an intermediate term bottom. Technical purists will recoil at my use of the ZBT Indicator in a non-traditional fashion. Marty Zweig’s original ZBT buy signal looked for a breadth thrust, defined as an oversold condition on the ZBT Indicator, followed by an overbought signal within 10 trading days. Breadth thrusts are extremely rare, but ZBT oversold signals are not. The combination of a ZBT oversold condition and a NYSI negative reading can be good gauges of an intermediate term oversold market, with the caveat that this signal was early during the March decline and flashed a buy signal about halfway through the pullback.

This indicator appears to be nearing a buy signal, but appearances can be deceiving. StockCharts reports the ZBT Indicator with a one-day delay, and I have created my own real-time estimate. Friday’s market rally lifted the ZBT Indicator off the oversold level. The ZBT Indicator is no longer oversold.

From a breadth thrust perspective, Friday is day one, and the market has nine more trading days to achieve a ZBT buy signal. I am not holding my breath.
An orderly decline
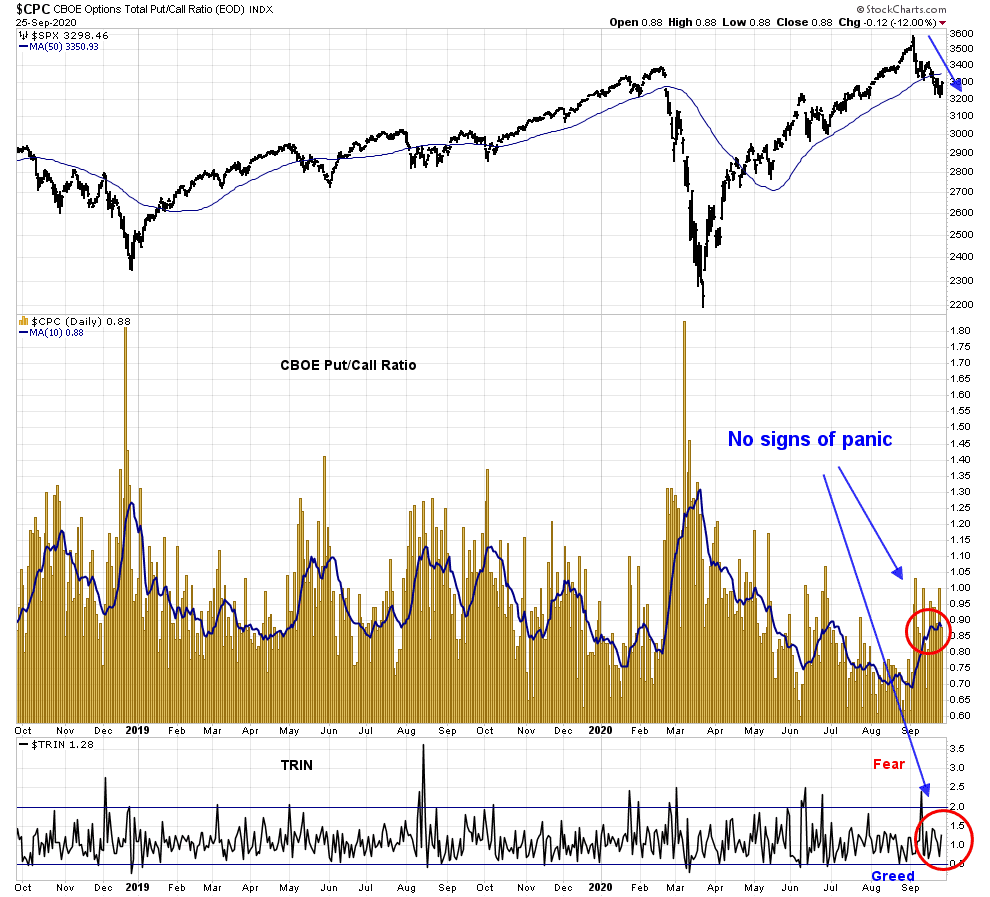
So where does that leave us today? So far, the market’s decline has been an orderly affair. Even though the S&P 500 is off about -10% off its highs in less than a month, there have been no signs of investor panic. The CBOE put/call ratio is still relatively low, indicating continued bullishness. In addition, there have been few TRIN spikes over 2, which are often indicative of price insensitive panic “margin clerk” selling that often occur at the end of major price declines.
Barring a significant fundamental turnaround, investors should be prepared for further stock market weakness. I would monitor the combination of insider trading, investor sentiment, and market technical conditions for signs of an intermediate term bottom.
We are not there yet.
Not only does the AUDJPY a track the S&P 500 well, it often leads by a day or so!
Hi Louis. I’ve dropped the AUDJPY pair on my daily S&P chart. Yes, it does track with the S&P, sometimes leading sometimes lagging and sometimes giving very false signals. It might be useful as a confirmation of trend. I don’t quite understand why this currency pair should track our markets. Maybe Cam can give us a definitive reason for the relationship.
Personal op:
Isn’t JPY usually seen as a “safe” asset? AUD on the other hand is tied to raw materials and to some extend Chinese econ.
So a high AUDJPY signals “risk on” which tracks s&p as expected. Just imo.
Yes. Rising AUDJPY = risk on. Falling = risk off
HI Cam:
Your analysis makes a compelling case for the market to continue its decline. I am curious to know if you have any contingency plan to close out your position in SPXU in the unlikely event that it does not work out. If so, at what price in the SPX and NDX. It would help us.
More on that tomorrow
We should differentiate whether the Republican Party loses but still controls the senate scenario from the blue wave scenario. In the latter, the monetary stimulus packages could be much larger, possibly driving the stock market upwards.
Excellent analysis, Cam, with one flaw. From what I look at, the election will end with a Trump landslide. If it were held today even, Trump would win. I’ll not go into detail to avoid upsetting the democrats here.
And, there are some wild cards out there with regard to economic distress. An early vaccine, a virus cure a government stimulus agreement along with judicial and prosecutorial surprises that could change economic sentiment.
A landslide either way will be bullish. The market won’t like the uncertainty of a contested election in the courts and in the streets
I don’t know if I would go that far, Cam, but I really don’t want to see the outcome drag on for weeks let alone months. Goldman says the risk of the result dragging on is overrated.
https://ca.finance.yahoo.com/news/goldman-says-markets-overestimating-election-005550034.html
Do you believe your lying eyes? Amazing!
https://www.zerohedge.com/markets/unprecedented-reversal-nasdaq-shorts-hit-second-highest-ever
I tend to believe it.
fwiw, yesterday’s reversal from -250 points in the DJIA futures to a +359-point rally barely moved the needle on Hulbert’s sentiment index. It rose from 1.74% to 4.63%. I think it’s supportive of further gains in the indexes over the ST…but I also believe the next major move will be down.
Hi Rajiv. I have a problem with Zero Hedge’s articles.
1.) Zero Hedge is ALWAYS Bearish. They dig around until they find analysts and data that support there bearish claim.
2.) Zero Hedge is run by Eastern Europeans who love Russia. Most of their commenters are Russians who will defend Russia’s actions to the death (it seems.) and
3.) Tyler Durden is a pseudonym for what ever grunt they have hired to write 10-20 articles daily. The guy they had when I was there finally quit for being over worked and left a very sour message. They just hired a new “Tyler” and didn’t miss a beat. LOL
A few years ago I read most of their articles and commented in their forums. Until one day they were running story after story about how great Putin was and how bad America was. I made the mistake of making negative comments about Putin in a couple posts. Man the threats and rebuttals just kept coming. I finally decided Zero Hedge was usually wrong on their market analysis and they had a mostly following of Russians who were not about to let anyone disparage their hero Mr. Putin. Adios, Zero Hedge.
Thanks for Wally for your input on Zero Hedge. I try to keep an unbiased view on the markets and try not to look for a confirmation of my beliefs or views. You may notice this happens a lot when people only view MSNBC, CNN or for that matter FOX News.
The ability to cut your losses quickly comes from being open to ideas that are contrary to what one thinks. That is the reason I posed the first question to Cam i.e. when does he know he is wrong in his analysis on his position in SPXU
I understand, Rajiv.
https://twitter.com/sentimentrader/status/1309577723770269696
Large speculators* haven’t had this much short exposure to major equity index futures in over a decade. They’re short about $47 billion worth.
* Hedge funds, trend-following CTAs, etc.
It would appear that Large Speculators never fully recovered their positions from the late 2018 decline and recovered even less from the 2020 winter pandemic decline. I’m not sure if this is telling us a long period of low market returns lies ahead of us or if this is telling us that a huge market rally lies ahead as that positioning is undone.
Thanks Rxchen2 for posting the contrarian bullish sentiment indicator.
The elevator down move occurred September 3-5. In the subsequent 14 trading days, market has traded in a broad range. The market had every opportunity to keep moving down with all the headwinds Cam has detailed.
I think there are many positives ahead. Four vaccines are in stage 3 trials. Granted they would not be immediately available to everyone, it is a big psychological boost to know we have found an answer. Federal Reserve is actively engaged in supporting the economy. Congress will enact fiscal stimulus. Maybe after the election which is not that far away. People are finding ways to adjust and adapt. No one I know is as afraid as at the beginning. Trump, if he looses convincingly, will transfer power gracefully. He has no other choice. If it’s close, it should be settled by recounts and legal process. Any other way will cause more harm than good. Hillary has advised Biden to never concede(doubts about what she did in 2016).
The doomsday scenarios are a tail risk. They make interesting reading. I have more faith in ourselves and our democracy.
To be clear, I still believe the next major move will be to the downside.
Another perspective:
https://www.cnbc.com/2020/09/26/the-september-market-swoon-accomplished-most-of-what-corrections-are-supposed-to-do.html?__source=iosappshare%7Ccom.apple.UIKit.activity.Message
Friends
I do not want to discuss politics here as it has been discussed at length here.
All day, today, I have been discussing investing with small time Joes and Janes, who are still extremely bullish. I am truly stunned to see the level of bullishness out there, with could not care less attitude. I am simply alarmed.
This smacks of a level of bullishness I witnessed in 2000 and 2007 to a certain extent. The back drop is different this time. That said, it is “never different this time”.
We are in the last leg into elections and I am worried that we could be looking at a jaw jarring pull back that is likely to rhyme March 2020. The countertrend rally from March 2020 till today could well prove to be the last stand of the bulls. I am circling in March 2021 as the bottom of the bear market.
Smart money is already short NAZ. See last graphic;
https://www.schwab.com/resource-center/insights/content/unwind-simple-rotation-or-something-more-sinister
No one saw the March 2020 and December 2018 corrections coming. This is likely to be the same.
Worried, very worried.
🙁
Traders are bullish because the Parabolic SAR on the daily is about to reverse from the bearish (magenta) and flip to bullish (cyan) support and the bears maybe unwilling or unable to stop that. That level is 3330. Once the Parabolic SAR resets, the base support will then be 3200 and the market will sell off to test that support. As to Cam’s observation on ZBT and NYSI, it is certainly possible to use that as a market turning point, but it is less accurate because an absolute levels such as 0.4 and 0 on these oscillators will probably not bring about an accurate reading of the price turning points. May I suggest using some other market breadths with a price component such as the SP IssuesAbove 50DayMA divided by the SP IssuesBelow 50DayMA and plot the nine period moving average of that ratio. The formula is in the attached picture as plotted. In many cases, such plots gave a predictive reading of turning points, such as the 2/19/20 top and sell off as well as the market bottom near 3/26/20 and corrections on 6/10/20 and 9/3/20.
https://postimg.cc/QBKfGdKy