- Ultimate market timing model: Sell equities
- Trend Model signal: Bearish (downgrade)
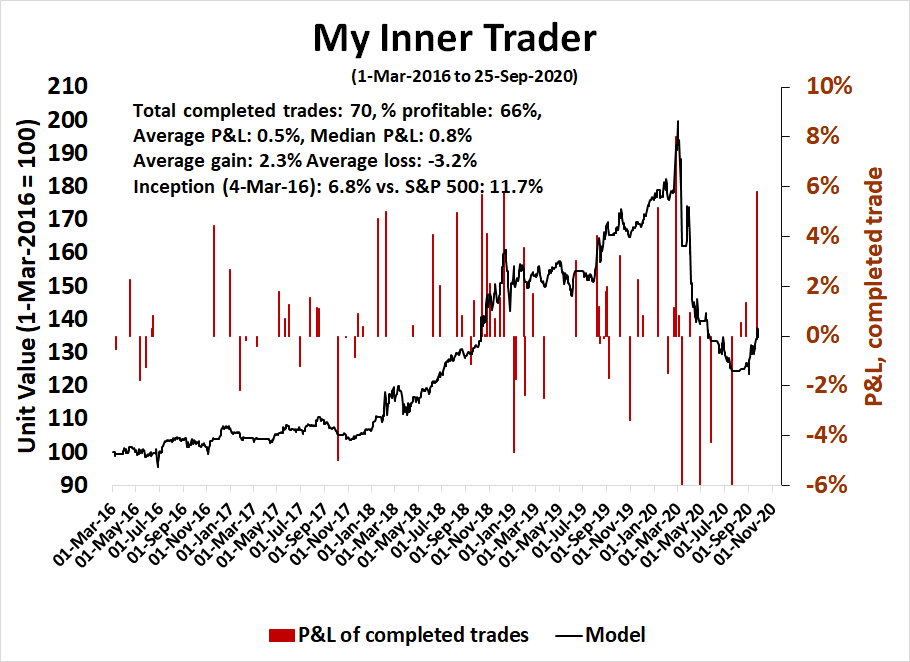
- Trading model: Bearish
Update schedule: I generally update model readings on my site on weekends and tweet mid-week observations at @humblestudent. Subscribers receive real-time alerts of trading model changes, and a hypothetical trading record of the those email alerts is shown here.
Subscribers can access the latest signal in real-time here.
Time to be cautious
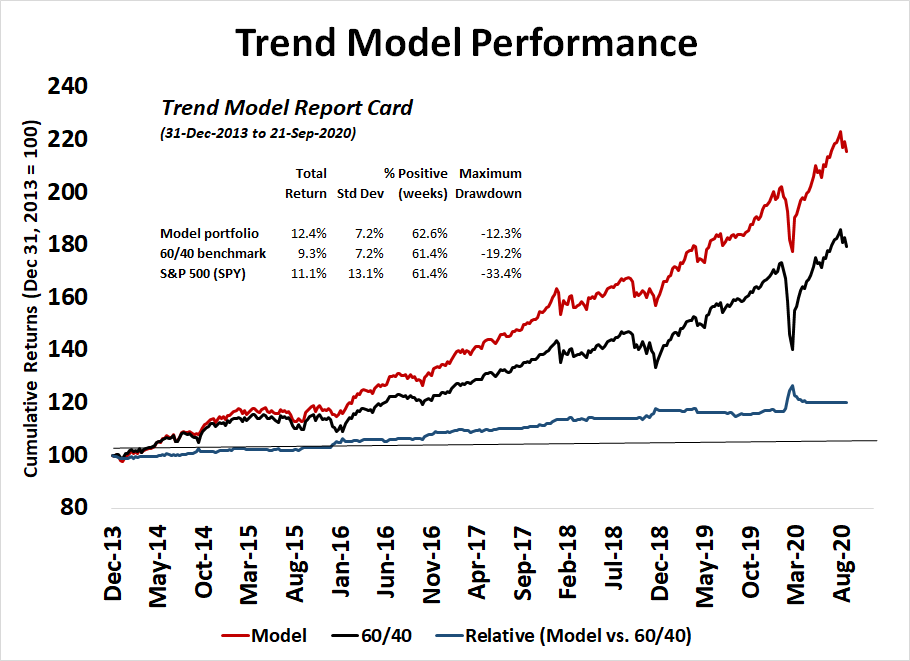
This is an out-of-sample application of my Asset Allocation Trend Model signals to a model portfolio. If the Trend Model is bullish, the model portfolio will take a 80% position in SPY (stocks) and 20% position in IEF (bonds), neutral at 60% SPY and 40% IEF, and bearish at 40% SPY and 60% IEF. As the chart shows, the model portfolio has been able to achieve equity-like returns over the test period with balance fund-like risk.
The Trend Model’s signal was upgraded to neutral from bearish on May 15, 2020 and it has remained in neutral ever since. Recent developments have caused it to turn more cautious. Here is why.
A tour around the world
The Trend Model applies trend following principles to a variety of equity and commodity prices around the world. There have been numerous technical breakdowns that have sparked general risk-off conditions on a global basis. Let’s take a tour around the world and assess conditions.
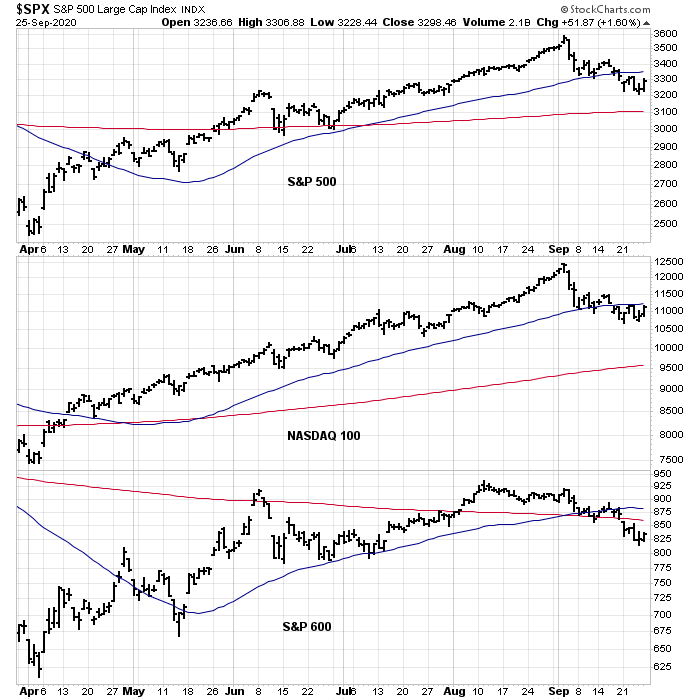
Starting in the US, we can see that the S&P 500 and NASDAQ 100 have decisively breached their 50 day moving averages (dma). While the NASDAQ 100 is trying to consolidate sideways, the small cap S&P 600 is even weaker, as it is trading below both its 50 and 200 dma.
Across the Atlantic, the Euro STOXX 50 has also breached both its 50 and 200 dma. The other major core and peripheral stock markets are also showing signs of weakness.
Across the English Channel, both the large cap FTSE 100 and small cap FTSE 250 are showing signs of weakness. The relative performance of the FTSE 250 to FTSE 100 has pulled back to test a relative support level, largely over increasing anxiety about the collapse in Brexit talks.
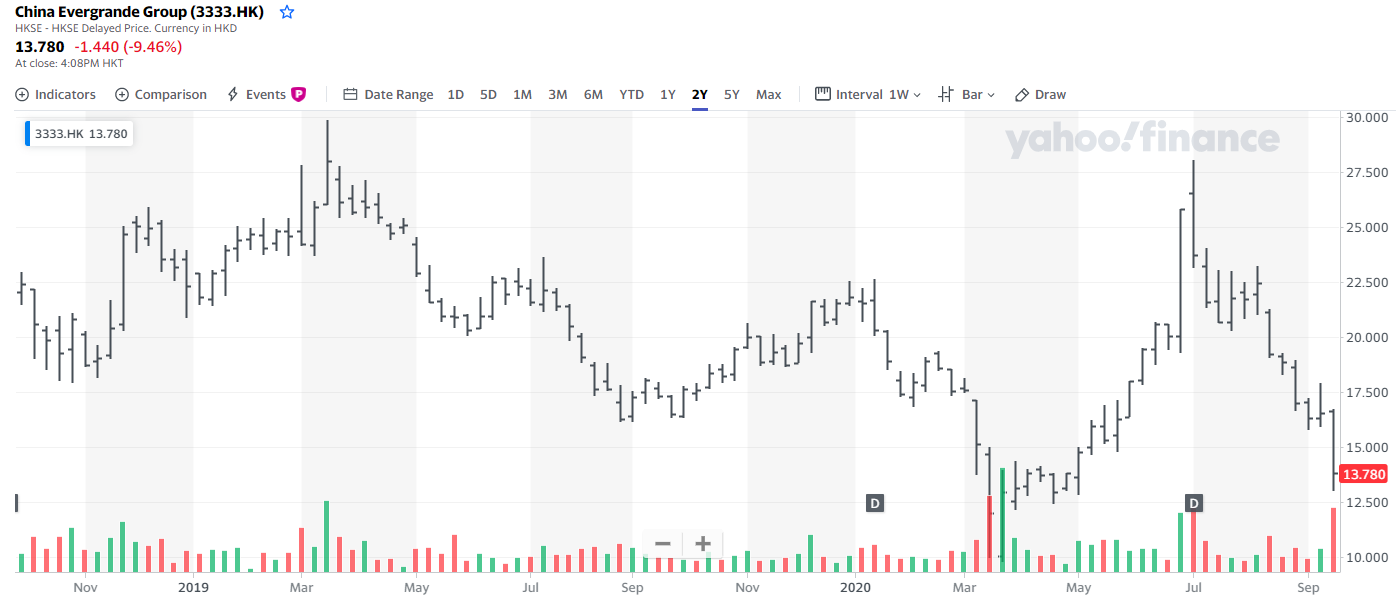
Over in Asia, the performance of China and the markets of her major Asian trading partners are also weak. The Chinese stock market is dominated mainly by retail investors, who treat it like a casino. That’s why I focus mainly on the signals from the other Asian markets. All of them are showing differing signs of weakness. In particular, the downside support violations in Hong Kong and Taiwan are especially ominous.
Cracks are showing up again in the mountain of debt in China. The plight of China’s largest property developer, China Evergrande, may be the canary in the Chinese coalmine.
Reuters reported that Evergrande, which is highly indebted, pleaded with local authorities for debt support:
The time has come for China to confront a too-big-to-fail quandary. In a letter to local government officials, highly indebted property developer China Evergrande contends that if it doesn’t secure approval soon for its reverse merger plan, it will wreak widespread havoc. Although the company says the missive is fake, the questions in it regarding systemic risk are real for investors and Beijing.
Evergrande beseeched officials in its home province of Guangdong for assistance with a so-called back-door listing, according to a copy of the Aug. 24 letter, whose authenticity was confirmed by Reuters sources. The idea, first proposed as part of an October 2016 restructuring, was for subsidiary Hengda to combine with a publicly traded state developer. If the deal doesn’t happen by January 2021, a group of investors can demand repayment of some 144 billion yuan, or about $21 billion, all of Evergrande’s cash as of June 30.

The one bright spot in Asia is Japan. The Nikkei Index price pattern remains constructive. However, there are three major trading blocs in the world, anchored by the US, Europe, and China. Japan is becoming a peripheral player from a global perspective.
Commodity prices can also be an important signal of global reflation or deflation. The message from commodities is one of caution. The Invesco-DB Commodity Index, as represented by the ETF DBC, has breached both its 50 and 200 dma. Gold prices have weakened in response to falling inflation expectations as hope fades for a fiscal response from Congress. The cyclically sensitive copper price has retreated to test its 50 dma.
A change in tone
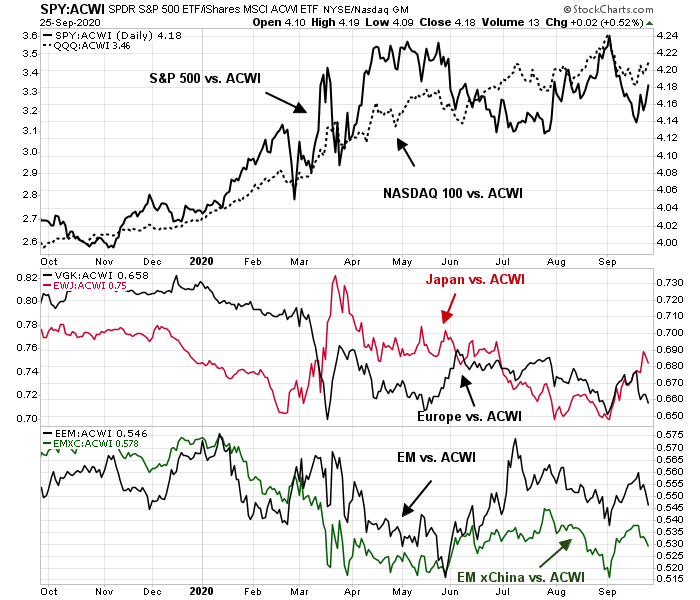
The tone of the market seems to be changing, and such changes are often characterized by a shift in leadership. The old leadership is faltering, but no new market leaders have emerged.
From a global perspective, the old US leadership has plateaued and begun to trade sideways (top panel), but none of the other major regions have emerged to be the new market leaders.
From a trend following viewpoint, these are all signs of a change in global trends. Coupled with a general weak tone in global equity and commodity prices, it is time for asset allocators to adopt a more cautious tone and de-risk portfolios. This cautious signal is also consistent with my past observation of a bearish 14-month RSI negative divergence in the Wilshire 5000, just after it flashed a bullish MACD buy signal. As a reminder, the last RSI divergence sell signal occurred in August 2018 (see
Market top ahead? My inner investor turns cautious), which resolved with a mini-bear market that ended with the Christmas Eve panic of 2018.
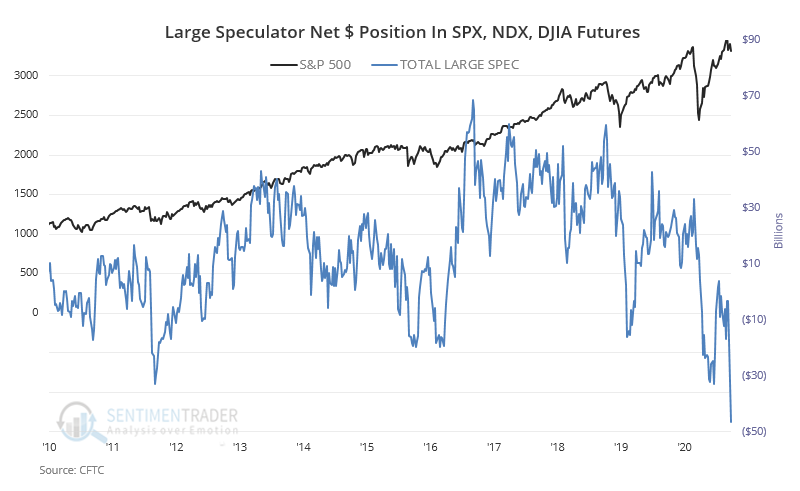
The key risk to the bearish call is that the Trend Model is already too late in its cautiousness.
SentimenTrader pointed out that large speculators and trend following CTAs are already in a crowded short in equity futures, which is contrarian bullish.
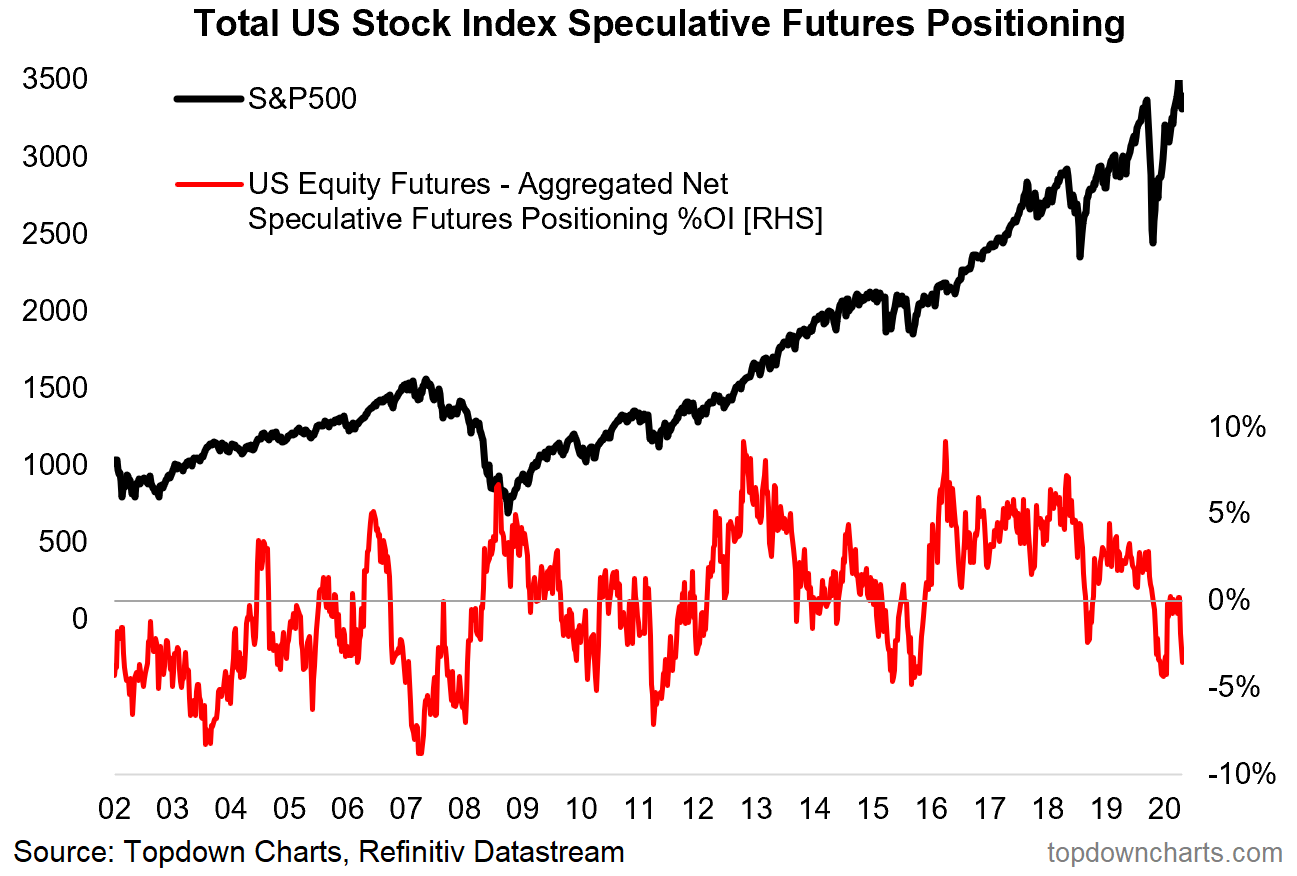
However, analysis from Callum Thomas showed that when futures positions are normalized for open interest, the net short speculative position isn’t as severe. In fact, large speculators were correct in their positioning at market extremes during and before the GFC.
\_(ツ)_/¯
Trend following models, by their nature, are slow to react to trends. They tend to be late, and they will never get you in and out at the exact top and bottom. This is a feature and not a bug. Investors therefore need to be prepared for relief rallies in the short run. Nothing goes up or down in a straight line.
The week ahead
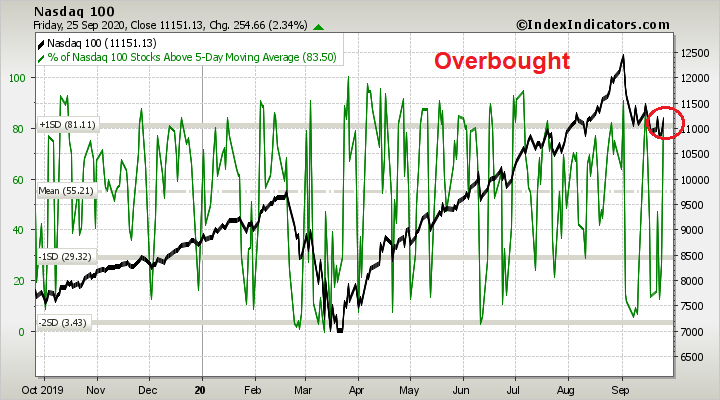
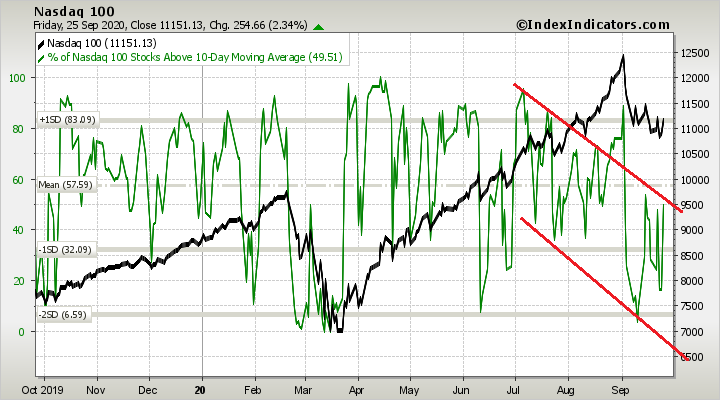
The market faces a critical technical test early in the week. The market leadership NASDAQ 100 is testing overhead resistance at the 50 dma. The bulls need to demonstrate some momentum to show that they are regaining control of the tape. The bears need to hold the line at the 50 dma, and preferably to push relative returns below the rising trend line.
The bulls will have a tough task ahead of them. The market is already overbought on the percentage of NDX stocks above their 5 dma.
The percentage of NDX above their 10 dma remains in a falling channel of lower lows and lower highs. A decisive upside breakout will be a positive development.
In terms of event risk, we have the first scheduled debate between Biden and Trump on Tuesday, September 29. As there are very few undecided voters in this polarized electorate, the debate is unlikely to move the needle, but there is always the possibility of a stumble by one or both candidates. In addition, there is a flood of Fed speakers, and the September Jobs Report is due on Friday.
In conclusion, a review of global equity and commodity markets reveals a growing risk-off trend, which is a signal for investors to be more cautious in their asset allocation. This bearish signal is confirmed by a monthly RSI negative divergence sell signal that was triggered in August 2018, just before the market fell by -20% into the Christmas Eve panic bottom of that year. In the short run, the market may be too stretched to the downside, and a relief rally is always possible. Nothing goes up or down in a straight line but the risk/reward is tilted to the downside.


I would be interested to see the full history of the trend model signals since 2014. Is that available?
Thank you.
Cam, the yield on the 10 yr. bond has been in a narrow range since August. Can you comment on why that is since the market has already experienced some weakness? Do you expect that yield to resume its decline if the market declines further? And, what effect do you think the Fed will have trying to mitigate any market and economic decline?
The yield on the Tenner will go down, once the Fed starts to buy. At the current yields, no one probably wants to buy this paper. To be sure, yes balanced type Mutual Funds and ETFs (60/40 or 40/60 types) would be forced to buy these scrips no doubt, but otherwise, there would be little reason to buy. Another reason would be hedging. If market loses 50% from here (approaching Cam’s target of 1800, give or take), yes. the yield on the Tenner will approach zero.
I assume that the 10-year will act as a risk-off asset, but it hasn’t worked that way in this latest sell-off.
On the other hand, if the market strengthens on the back of a better economic outlook and the yield curve steepens, I’m not sure how far the Fed will allow the 10-year yield to rise. Rise too far and it will snuff out the recovery.
I am convinced that the Fed will wind up with some form of yield curve control. We just have to allow them to get there at their own pace.
Hulbert makes a historical case for the other side of the story.
https://www.marketwatch.com/story/heres-how-stocks-typically-perform-in-october-and-why-you-might-want-to-buckle-up-2020-09-25?mod=mark-hulbert
Be careful with October. Some of the major losses started in October.
October 2018 was the start of the correction to Christmas eve 2018 (we had triple top by October that year).
October 2002 led to deeper pull back into March 2003. Same for October 2008, that led to deeper pull backs. Again, there was some difference between what happened prior to October 2002 and October 2008. All said, I am always wary of October.
Thanks for your replies, D.V.
Read WSJ article of September 27. Talks about how traders have hedged all kinds of assets into December. Would that not dampen the volatility? In other words, if one is hedged, why sell?
If the events turn out to be less dire( no fighting on street corners to settle the results), Congress passes stimulus bill, news on vaccine, shorts and people on the sidelines will miss out a rip your face off rally.
If you miss the ten best days in the market in a decade, one sorely falls behind. Markets go up 80% of the time.
I am rebalancing to policy allocation. Too many likely positives ahead to get defensive as outlined.
https://projects.fivethirtyeight.com/2020-election-forecast/senate/
Posting this here, a reputable analytical site.
Just like fivethirtyeight in 2016…
*** This comment has been edited. Please keep your commentary to investments and not political opinions ***
Donald Trumps Taxes have NOTHING to do with investments Cam. Get a damn life, buddy.
And neither does liberal polling data.
A good reason not to be too bearish is the CCC junk bond spreads that are currently very tame. All the big declines outlined above happened with junk bond spreads blowing out. Here is the chart (keep the link).
https://fred.stlouisfed.org/graph/?graph_id=582384&rn=562
Thanks, Ken, that is interesting. But it looks like the democrats here would rather talk about politics today.
I agree. Credit markets are not signaling weakness ahead. HYG is down about 2.7% in September which pales in comparison to March episode.
https://www.nytimes.com/interactive/2020/09/27/us/donald-trump-taxes.html
Unsure if this is THE October surprise.
At a minimum, this is going to throw the Trump campaign off-balance and take all the oxygen out of the room for the next couple of news cycles. Unfortunate timing for him ahead of the debate.
Worse if there are follow up stories.
I doubt if anyone voted for him because he is a billionaire. Some may have justified the choice but not the underlying reason for their votes.
At the same time, this tax news and the SCJ nomination take the focus away from key issues of Covid-19 and the state of the economy where Trump is really vulnerable and may lose some elderly votes among his core supporters.
Ok, enough. This is not a forum for political discussions.
Cam, I was just replying to earlier posts including your’s.
Enough from you and D.V. too. Don’t be such a liberal nut.
This is old news. Millions of individuals and corporations do the same. It’s a tax code issue. And who reads NYT? Liberals who dislike Trump to begin with. Non issue!!
https://www.nytimes.com/2020/09/27/us/trump-taxes-takeaways.html
https://www.nytimes.com/2020/09/27/us/trump-taxes-editors-note.html
Did you see that the Biden Foundation is promoting transgenderism on children as young as 18 Month Old? Disgusting.
https://thenationalpulse.com/exclusive/biden-transgender-campaign/
Come on, Cam!!! How about deleting this entire nonsenscal thread??
please stop.
The NYT has had these returns since 2016. It is irrelevant. Have you seen the Senate report on the Hunter Biden/Joe Biden criminal activity? No? Of course not, the main stream press won’t publish the Senate report story but here is a summary.
https://www.foxnews.com/politics/hunter-biden-gop-report-claims-prostitution#
Cam, do you want to give me editing privileges so I can clean up this thread? At least I’ll be an honest cop.
I can’t. You would need to be a privileged Administrator and see all sorts of other things, such as subscriber data and limited credit card details.
I see. Well, you should just delete every comment after Ravinda’s except for Ken’s with a warning to leave politics out of these forums.
Cam, do you expect the MACD to turn negative this month (as it did in Aug 2018)?
Too early for that.
https://www.yahoo.com/finance/news/pound-falls-two-month-low-075404575.html
Brexit final deadline is fast approaching. The weak Pound may be due to a worsening pandemic or due to a final Brexit deadline. Either way, check out EWU that has Blue chip stocks, 3.7% dividend and has pretty much gone no where in the last decade.
Another WSJ news story this weekend:
Americans are starting new businesses at the fastest rate in more than a decade!!
No matter which side you are on or what market does this week or next, one must admire the entrepreneurs who take the risk even in the middle of a pandemic. Creative Destruction, a concept put forth by Joseph Shumpeter , in full action!!
I am optimistic about us.
3333.hk (China Evergrande Group) just rallied almost 20% tonight off some good news/rumors. …
Today is Monday, end-of-quarter and Yom Kippur – Asia and Europe are seeing strong rallies. I have a feeling that shorts may be risky today and SPX wants to retest 3400.
Closing all positions in ETFs opened Friday morning:
vti rpv ijr ijs vnq vea efv fndc dls dgs
Will close the majority of positions in Rydex equivalents of SPY/DIA/QQQ/IWM at the 730 am trading window.
Make that SPY/IWM only. The Rydex funds for DIA/QQQ can only be closed end of day.
Important read from Tim Duy on the high level of job openings:
https://blogs.uoregon.edu/timduyfedwatch/2020/09/28/bullard-may-be-more-right-than-wrong/
Lengthy tweet thread that provides a 5-star summary of the state of covid vaccine testing. Worth the time to read the whole thing, but jumping to roughly tweet 79 bypasses some of the more technical discussion.
https://threadreaderapp.com/thread/1310372301314101250.html
Saw it, haven’t yet read it… if you have a summary, I’d thank you! 🙂
Well, here’s the last couple of tweets –
<<<<>>>>
What the…
Here’s what I tried to quote
134) Despite all the challenges discussed here, we are in the process of developing vaccines as a countermeasure against SARS-CoV-2 at an unprecedented speed, and it is certainly possible that vaccines with safety and efficacy that has been proven in phase III trials….
135)…. might enter the market in 2020. Maybe initially not in large numbers and just for high risk groups but it will be a start. And every day after that will bring us closer to our normal way of living. I am very positive about this, we can do it!
And also..
138) OK, somebody is going to ask which vaccine I would take. After seeing all the human data I would likely go with Pfizer or Novavax. But that might change, based on data coming up from Phase III trial. I am also kinda curious about Sanofi.
Thanks!
It sounds hopeful the promise will bear out. I worry about an adverse event and politics/social media making a royal mess of it.
Err on the side of the bulls? short term trade 9/28/20 12:55 ET
It may be early, but the medium term strategy says this breadth thrust could be real and lasting for days which is counter to the short term (ST) strategy which covered and went long at 10ET 9/25/20 is now saying to short into this gap up rally because there is actionable selling signals. However, there is a gap waiting to be filled near SPX 3384 (magenta line) and the ST strategy doesn’t know about the gaps. Note that while this ST strategy is nearly 100% in the market and has a 3.04 profit factor overall, with 100% long trades profitable, the short trades are only 52% profitable over the last 3.5 months studied. The average profitable trades taken on the short side are also only 1/3 the profits of the long trades. The safe course is usually to err on the side of the bulls.
https://justpaste.it/ls/7di4v/eklfgnob4dla5dlz
I would have a hard time opening positions after a two-day rally.
Yes, but you’ll need to look at the size of the breadth thrust and other market internals.
I’m open to buying/reopening on early weakness on Tuesday.
Closing the Rydex versions of DIA/QQQ.
After the market closed today 9/28/20 we now have a few data points we didn’t have last Friday. The Parabolic SAR has now flipped and the supporting point is now 3212. An above average breath thrust is on going (yellow crosses on the chart), suggesting a continuation. The last time we saw this near a 20 day low was 5/15/20 and the rally went on for more than 15 trading days. If this had happened near a 20 day high instead of a 20 day low, then there may be a high probability of a sell off such as it did from 6/5 to 6/11. Notice on the lower panel, the SP50DRatio has now crossed over its 9 period moving average – another criterion for extending this rally. If you see SPX hugging close and staying above the 5 period MA, then the rally is likely intact.
https://justpaste.it/ls/5hkwl/7i5bb4xkd7ax9tvb
Correction: we saw a loss of 1.05% of the SPX on 5/19 the next day to the 5/18/20 breadth thrust (it was 5/18 and not 5/15 as posted above), but SPX stayed near or above the 5 day MA and the rally continued.
Is that an island on the SPY chart?
Close, but it doesn’t look like an island to me
Sorry no offence but, based on your bearish calls since march, what is there left to “de-risk” ?
Of course you can argue that this is another sign that the market is indeed in a crowded long position (i.e. readers challenging your calls) , but I am just really wondering, have you listed a number of things that would make you turn bullish or at least neutral ? If so, what are they and why do you think the possibility of these materializing is low ?
Thanks
“The Trend Model’s signal was upgraded to neutral from bearish on May 15, 2020 and it has remained in neutral ever since. Recent developments have caused it to turn more cautious. “