There was some excitement last week when SentimenTrader wrote about the massive aggregate short by large speculators and CTA trend followers in equity futures. Conventional contrarian analysis would be bearish, but this is a lesson for traders and investors to look beneath the surface before jumping to conclusions.

Mitigating conditions
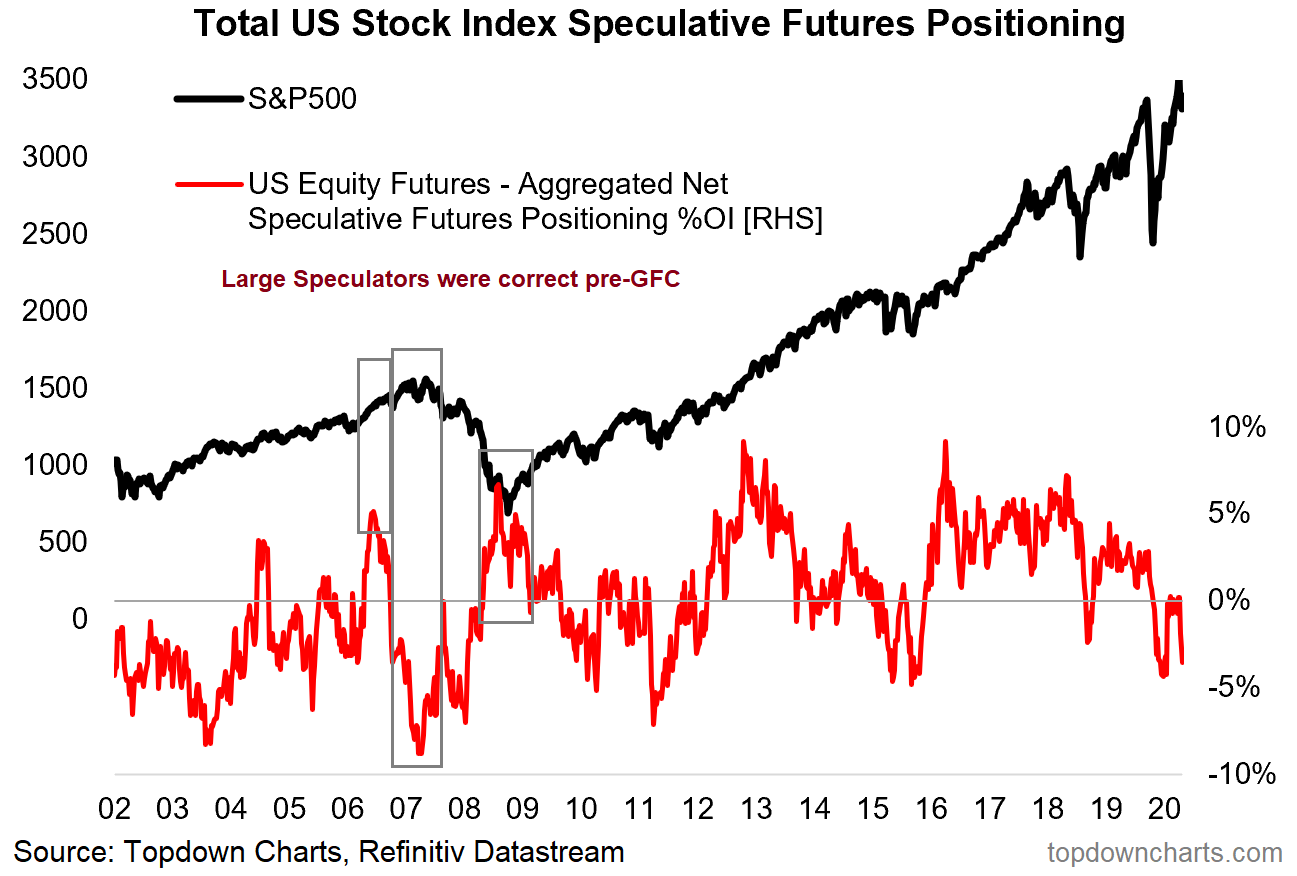
Here are some mitigating conditions to consider. Analysis from Callum Thomas revealed that, when normalized for open interest, the short position is not as extreme. Further analysis shows that large speculators were mostly correct in their positioning just before and during the Great Financial Crisis. This is a lesson not to be contrarian just for its own sake.
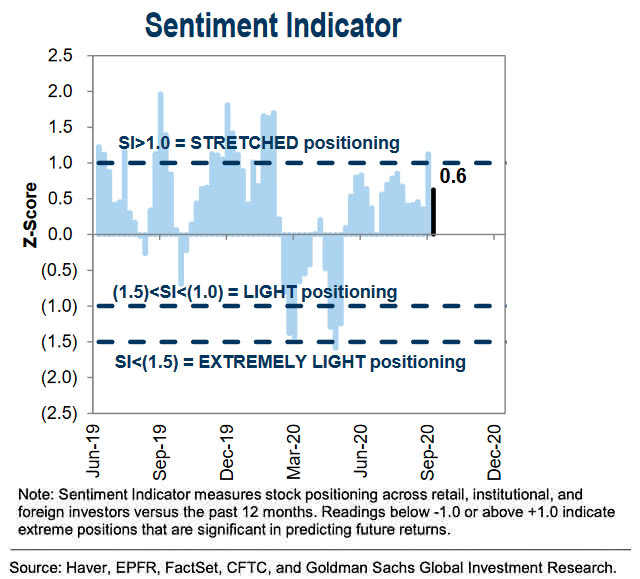
In addition, Goldman Sachs’ positioning studies show that investors, which include institutions, individuals, and foreign investors, are net long equities. Readings are falling from a crowded long and not extreme. These sentiment conditions are consistent with a market that is pulling back.
Cross-asset signals
If you are relying on Commitment of Traders (CoT) futures data to be contrarian, then what would you make of the massive USD short position (via Macro Charts)?
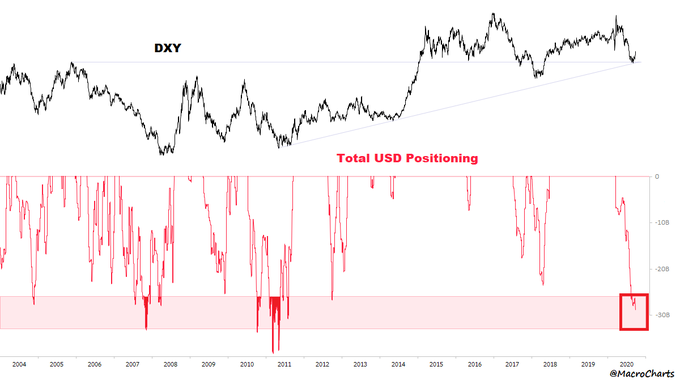
Large speculators are in a crowded USD short, and the USD Index has just staged an upside breakout from a narrow range and sparking a risk-off episode. The AUDJPY cross, which is a sensitive risk appetite foreign exchange indicator, is confirming the risk-off tone.

Taking a contrarian position based strictly on CoT data can lead you astray. How do you resolve the inherently contradictory positions of a massive equity short, which leads to risk-on positioning, and an equally massive USD short, which leads to a risk-off conclusion?
I interpret CoT data as trade setups, and not actionable trade signals. I prefer to look for crowded trades, combined with a trading catalyst. As an example, the crowded USD short and upside breakout leads me to adopt a risk-off tone. On the other hand, I am watching if the bulls can rally the NASDAQ 100 above its 50 day moving average. Most of the large speculator short positions are in the NDX, and a decisive upside breakout will lead to a short squeeze. Based on Monday’s close, the NDX has broken up through its 50 dma, though TRINQ shows no signs of panic buying. Trend following CTAs tend not to react instantly to breaches in key levels in order to minimize whipsaw. We will have to watch if the bulls can hold these levels over the next few days.

However, the market is overbought in the short-term. I will be closely watching the NDX, as well as the behavior of the currency markets in the next couple of days.
The jury is still out on question of whether today’s market action is the start of a pain trade for the bears, or a bull trap. Stay tuned.
Disclosure: Long SPXU
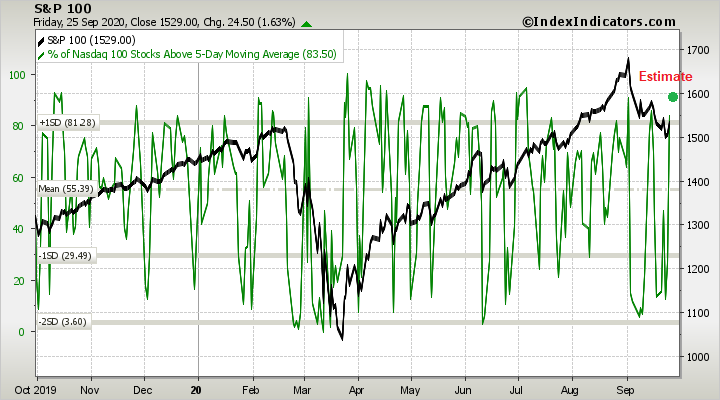
H Cam: I am starting with the assumption that large institutions, hedge funds and money managers trade the NDX(qqq) as opposed to Robin Hood traders. If that assumption is correct then the more appropriate measure of over-bought NDX will be % of Nasdaq 100 stocks above 10-Day moving average which is less volatile and allows for larger movements in the Index.
It will be interesting to see what happens because the 10 day is not yet overbought.
https://www.marketwatch.com/story/heres-the-shocking-truth-about-robinhood-investors-vs-wall-street-stock-pros-2020-09-29?mod=home-page
I have to admit I have never made a dime out of studying the commitment of traders reports. Frankly the data looked like it is another regulatory form that large clearing members filled in just to satisfy CFTC which the CFTC is hard pressed to “review for reasonableness” as they claimed on their website.
The mildly bullish trend following yesterday’s thrust begs the question ‘What is the likelihood of a profitable long position following a 9/28/20 like breadth thrust?’ Well, the following strategy analysis using 11 years of data says there was a 68% chance of profitable trades out of 44 trades in the last 11 years, total time in the market was 2 years 3 months with average days in the winning trades as 17 days, average days in losing trade was 8 days. There is a trailing stop on these trades to prevent large losses. The Sharpe ratio is about 1.5, 6.4% annual return and the equity curve looks encouraging for the bulls. The trade has been triggered this AM 9/29/20 when it briefing traded about yesterday’s close.
https://justpaste.it/ls/33xb4/4npdfd06s6lyishw
That last sentence should read ‘ The trade has been triggered this AM 9/29/20 when it briefly traded above yesterday’s close.’ The maximum drawdown is 9% (trade close to trade close).
Nice call so far, Alex.
Thank you but it was only a strategy analysis. When markets reacts in a way that is unfamiliar, the first reaction may be to blame the Feds or some unseen forces. But don’t be surprised that some quant has done a study somewhere and have seen something the average trader may not have seen. I am certainly not the first one to have done this analysis. For the bulls to continue, they need to stay roughly above the 5 day MA and close above it 4 out of 5 days in its rally which on the average may last 17 days, possibly more.
Short Term (ST) adjustment. Bulls take profit, bears sharpen their claws 14:55 ET
The sell off that began at 14:25 ET 9/30/20 showed that the bears are not giving up as the bulls are taking profit at today’s R2 of 3393 (from pivot analysis). One way to see this is the divergence that was forming around 14:00 ET (magenta diagonal lines). Both SPSI SP 500 summation index and NASI showed this divergence vs price. The NASI (green plot lower panel) is again lagging the SPSI. This may resolve itself with the gap up from over the weekend (9/28) at SPX 3308 being filled. Too early to tell where the bottom or reversal will rest but the ST model should show the first indication. The ST trade (short at 3353) that was taking a beating since this morning may still have a chance at being profitable even as the medium term (MT) model shows a rally continuing.
https://justpaste.it/ls/6ehpk/2u1vx267s2q294ca
Reopened a small position in RYGBX (Rydex Long Bond) at the close.