Mid-week market update: The Presidential Debate last night was painful to watch. After the debate, different broadcasters conducted instant polls of who won the debate. The CNN poll showed that 60% believed that Biden had won, and 29% thought that Trump had won. The Fox poll showed that 60% thought Trump had won, and 39% thought Biden had won.
Lol! There was something for everyone*.
In reality, the debate probably didn’t change many minds, and the market’s perception of electoral risk was also largely unchanged. My own survey of SPY’s at-the-money option implied volatility shows that while implied volatility had fallen, the shape of the curve is unchanged. The early November election spike is still there, and risk remains elevated until mid-December.

For equity traders focused on market direction, there is also something for both bulls and bears.
* Please think twice before posting political commentary in the comments section.
For the bulls
The bulls can point to several constructive developments. Both the S&P 500 and NASDAQ 100 have regained their respective 50 day moving average (dma) lines. In particular, the NASDAQ 100 rallied above its 50 dma and held the upside breakout for three days. In light of the large net short position in NASDAQ futures by hedge funds and CTAs, trend following models could force shorts to cover and push prices higher.

Another positive technical development is the ongoing bullish recycle of the daily stochastic off an oversold condition. This is a sign of bullish momentum that should propel prices higher.
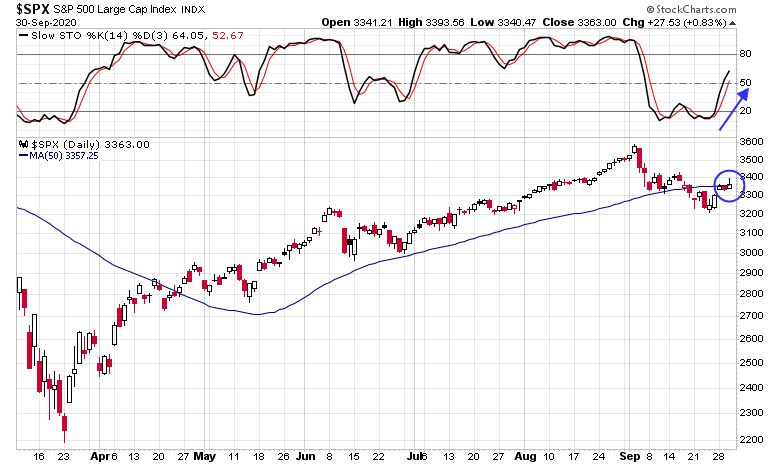
There is also the lurking possibility of a Zweig Breadth Thrust buy signal. The market rallied off a ZBT oversold condition last Friday, and it has 10 trading days to become overbought to flash a ZBT buy signal. Today (Wednesday) is day 4. The bulls are ever hopeful.

For the bears
“Not so fast,” say the bears. The intermediate-term outlook is still unsettled.
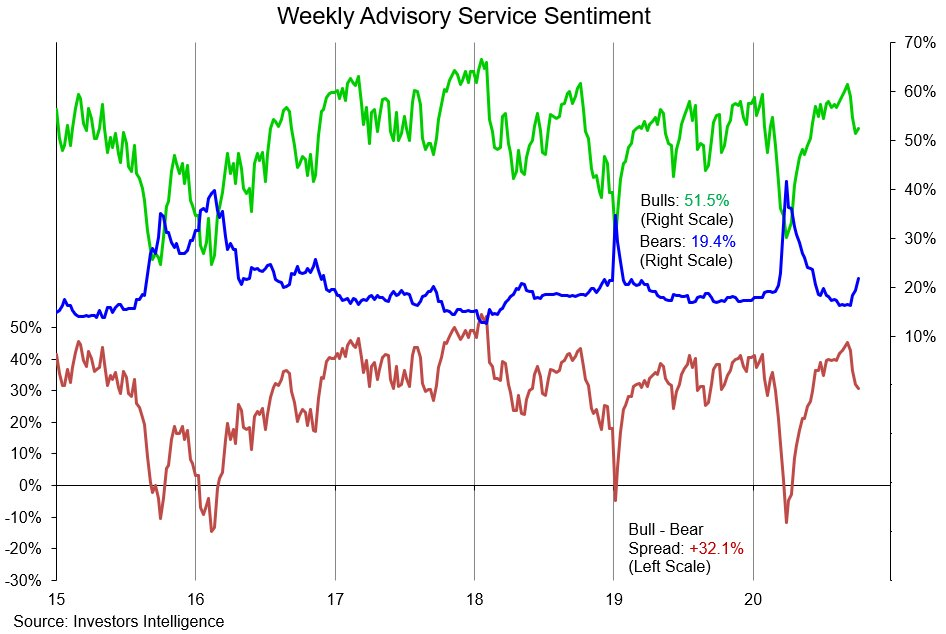
One of the bottom spotting signals that I identified on Saturday (see How to spot the next market bottom) was a bearish sentiment capitulation. The latest update of Investors Intelligence sentiment shows that while %bulls have retreated and %bears have edged up, bearish sentiment is not at levels consistent with wash-out lows.
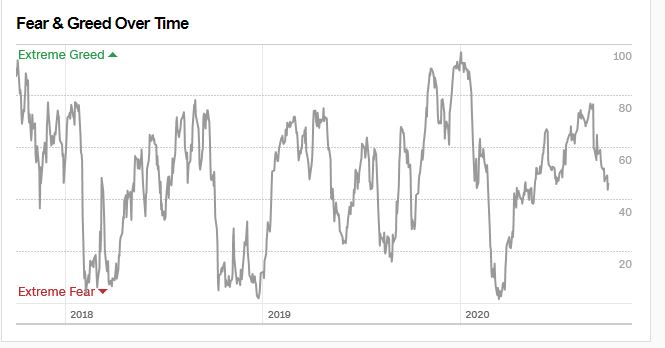
Similarly, the Fear & Greed Index is firmly in neutral territory. Durable market bottoms don’t look this way.
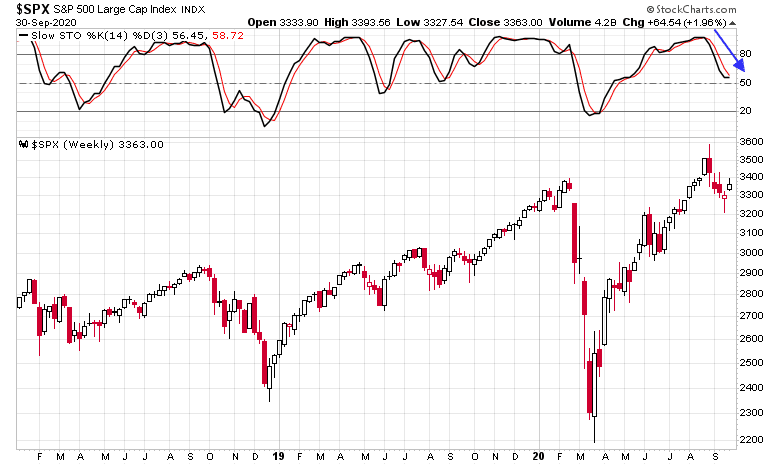
What about that bullish recycle of the daily stochastic? The weekly chart tells a different story of a bearish recycle. The intermediate term outlook is bearish, not bullish.
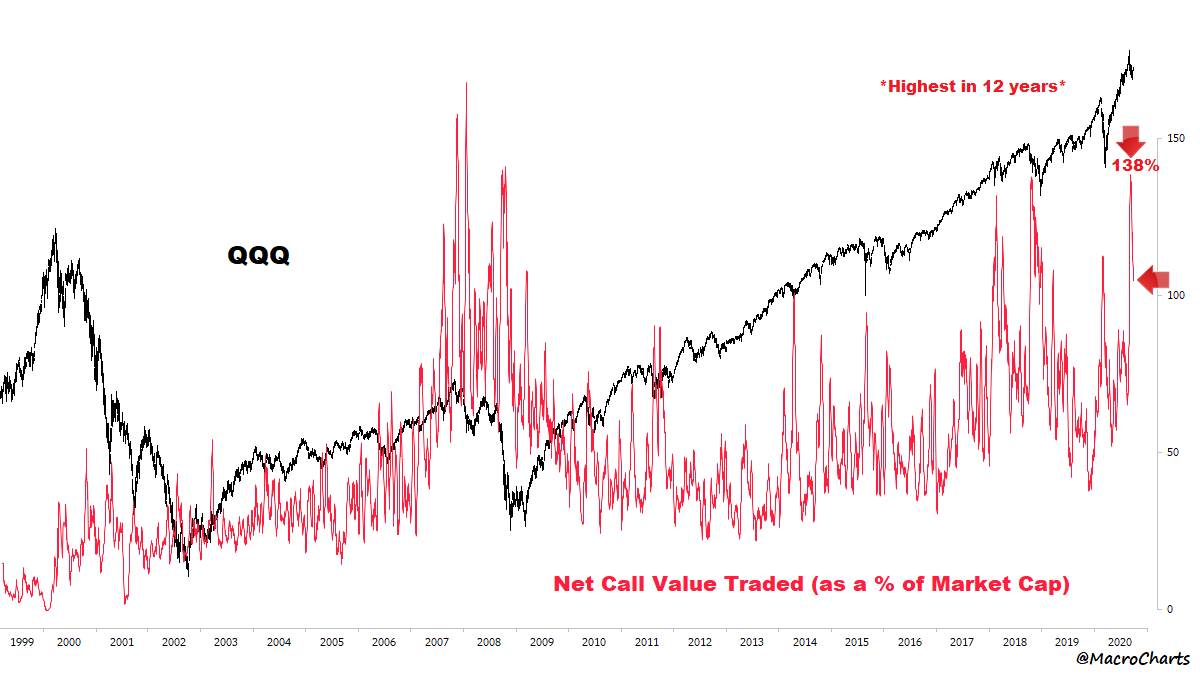
As well, Macro Charts pointed out that the volume of QQQ calls is still highly elevated, indicating either excessive bullishness, which is contrarian bearish, or signs of possible hedging activity that offsets the large short position in NASDAQ 100 futures.
Where does that leave us? I warned recently about the possibility of rising volatility, which is likely to persist until the November 3 election and possibly beyond. In the short-term, there is event risk, owing to excitement about a stimulus deal and Friday’s the September Jobs Report.
In the absence of a substantive development, such as an agreement on a fiscal stimulus package, I would expect further choppiness with a bearish bias until early November.
Disclosure: Long SPXU
.
I thought it was quite interesting the futures began to rise the moment the debate started and crashed right after it ended.
Yes, it was probably short covering. I noticed it too.
Opening a small position in SPXU.
Thanks for sharing. Same here @ 8.20
https://twitter.com/ryandetrick/status/1311650216194510850?s=21
The bulls seem content to holding SPX at 3375, hugging the 5 day MA and the short term (ST) model has covered its shorts at SPX 3378 for a small loss of 0.8%. You can see the previous link for an updated chart.
Just for kick, I asked the question ‘What happens when the NY Summation Index catches up to the Zweig Breath Thrust?’
10/1/2020 2:40:12 PM ET
Watching the original NY Summation Index is usually like watching paint dry or more like watching plants grow in that they do happen eventually. The following is a rarely seen chart of what happens when it does, usually you would see a 10 or more day rally and it is especially true if starting from below a zero level on the NYSI. A modified faster NYSI in green is included to show where the intersection may look like.
https://justpaste.it/ls/3r2s1/x94rs3sj5jq68k9v
Closing SPXU.
10/2/2020 11:23:55 AM ET
A fast version of the NYSI and NASI has both the daily and weekly chart staying in an up-trend . The SPX is down 0.60% yet trading very close to the 5 day MA. It is likely the bullish medium term trend from the breadth thrust of 9/28/20 will continue.
$VXN is 36.24 which is even lower than the high of yesterday. That doesn’t suggest volatility has markedly increased even with the news. Increasing, it is likely the presidential election and the presidency is being priced out of the markets.
Hehe Zerohedge is reporting that Softbank is back at the gamma squeeze game. Don’t know what to make of it, is it fake news? But there’s been some strong dip buying this morning. https://www.zerohedge.com/markets/sp-caught-gamma-trap-slide-below-3300-will-trigger-indescriminate-selling
This looks more and more like a shake out move by the bulls. The short term (ST) model is now long at 3361.
A little whippy out there, but I’m beginning to reestablish positions in EEM/ AAPL./ QQQ. Could easily be stopped out before the close.
Adding a little TSLA/ AMZN.
And, surprisingly, a little XLE/XLF as well.
My rationale comes down to the fact that markets have mostly recovered from the opening panic. The right trade is fading the panic.
Of course, I could be wrong. Only ~25% invested and not looking to add. I am, however, willing to hold through the weekend.
Ended up adding a starter position in SPY end of day via RYSPX.
Closing RYGBX end of day for an estimated -0.5% loss over two days.
Closing print now in-> overall loss on RYGBX -0.35%.
Weekly SPSI NASI summation still up trend 10/2/20 15:25 ET
If this is a sell off a la Sep, Oct 2018, it is not happening (at least not yet). Weekly and daily summation indices are all still uptrending. SPSI in red, NASI in green, lower panel. No short signal in the weekly. No short signal in the daily since 8/27/20. ST and MT models all staying long.
https://justpaste.it/ls/2lldz/vkjoawnujmsrm8ch
Do you know if we have an NASI buy signal right now?
Alex_tm, yes, could be.
If you look at the weekly chart in that link, the NASI (green plot) made a bottom on 9/18 but you didn’t know it until the next bar completely formed by 9/25 (although it updates tick by tick and you could have seen the formation real time but that could be deceiving if you only see the early days of the week). Meanwhile the SPSI was fairly flat and it too bottomed on 9/25. The reason NASI lags the SPSI seems because there are >6 times the number of stocks in the NASI than SPSI.
https://twitter.com/QuantifiablEdgs/status/1312065969070788608/photo/1
Compare results for the first Friday with that of the second Friday.
The updated charts of ‘What happens when NY Summation Indices catches up to Zweig Breadth Thrust’ is up. Compare that to other periods and you will see that now is definitely not Feb 2020 and this is not Oct 2018. All those periods saw the NYSI and ZBT falling which is the exact opposite of what we are seeing.
https://justpaste.it/ls/3r2s1/x94rs3sj5jq68k9v
Surprised no ones mentioned Trump. I’ve gone short on the expectation that he may be at severe risk.
From the reports I’ve read on patients that have similar health issues and age, most patients don’t make a full recovery.
The fact that he was given an experimental and non-FDA approved drug is not a good sign.