
In light of these conditions, I have been asked about downside equity risk. Is this the start of a significant downdraft? How far can stocks fall from current levels?
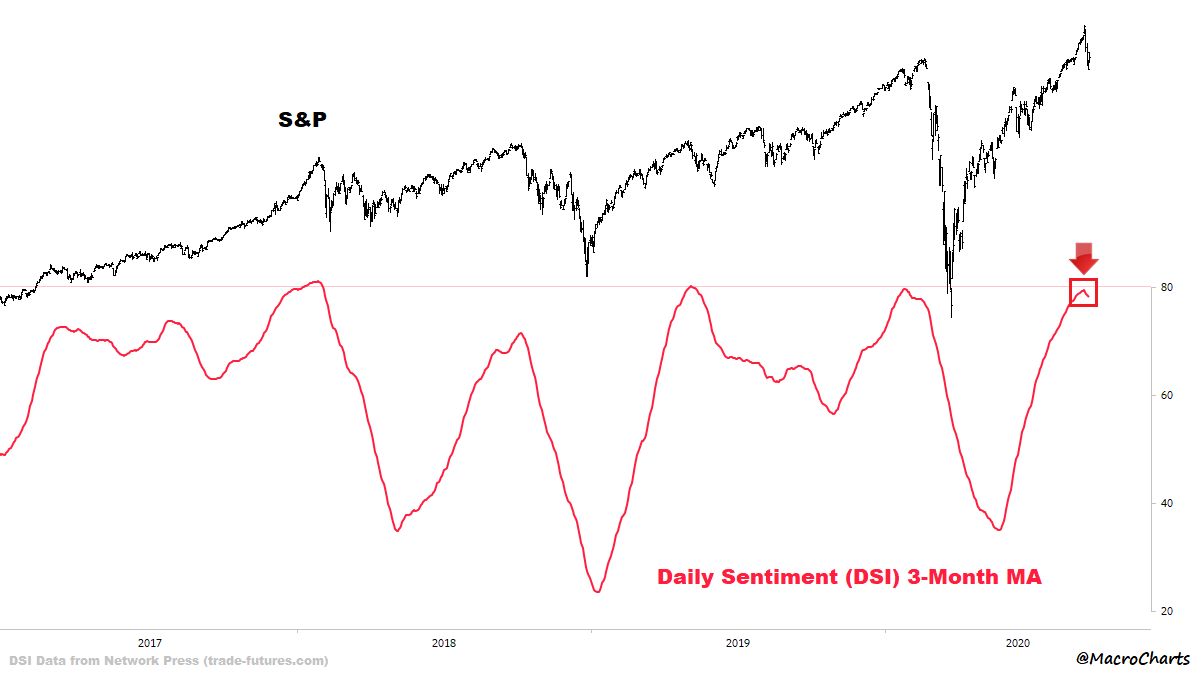
I answer these question in the context of secular leadership change. The Big Three market leadership themes in the latest bull cycle has been US over global stocks, large cap growth over value, and large caps over small caps. Transitions from bull to bear phase act to cleanse the excesses of the previous cycle. Until we see definitive signs of leadership changes, it may be too early to call a market top just yet.
From that perspective, we can see that the relative performance of US against global stocks is consolidating sideways after an uptrend; growth beating value, but pulling back; and small caps still lagging large caps after a brief episode of better relative performance.

NASDAQ crash?
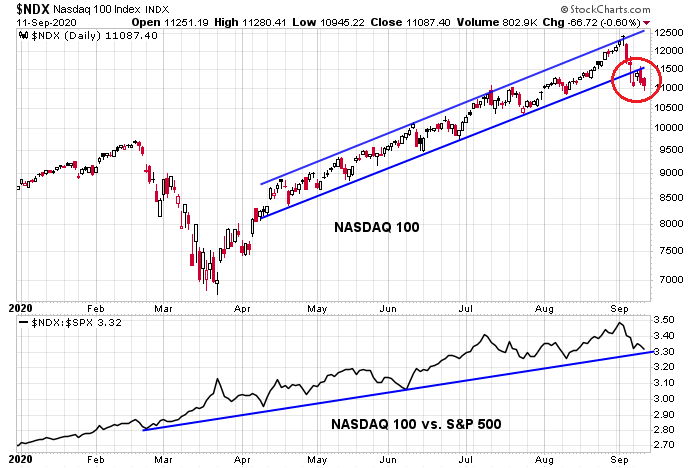
There are growing, but unconfirmed signs that large cap growth and NASDAQ stocks are weakening. The NASDAQ 100 recently breached its rising trend channel, but its performance compared to the S&P 500 remains in a relative uptrend. In the short run, too much technical damage has been inflicted on these market leaders for them to continue to roar upwards immediately. The most constructive bullish scenario would see them consolidate sideways for several months before resuming their uptrend.
We can see further evidence of technology weakness from small cap tech stocks. Even as the relative performance of large cap tech against the S&P 500 pulled back but remains in a relative uptrend (black line top panel), small cap tech has dramatically underperformed the Russell 2000 (green line, top panel). These are all signals that an important correction may be brewing for the technology sector.

If this is indeed the start of a NASDAQ crash, bear in mind Bob Farrell’s Rule #4 as it applies to NASDAQ stocks: “Exponential rapidly rising or falling markets usually go further than you think, but they do not correct by going sideways.”
Let’s consider what happened last time these stocks deflated. The bear market spared mid and small cap stocks because they did not participate in the dot-com bubble. Non-US stocks crashed along with the NASDAQ because they were also caught in the tech frenzy. Fast forward to 2020, non-US stocks are likely more insulated from a potential NASDAQ crash today as they have gone nowhere since 2014. By contrast, mid and small cap stocks only began to trade sideways since 2018.

We can see that in the valuation of US large, mid, and small cap stocks. Their forward P/E ratios are either in the high teens or low 20s, which are elevated by historical standards.

From a global perspective, the forward P/E ratios of non-US regions are far lower than US stocks.

That said, too many investors are fighting the last war. The latest episode of US large cap growth dominance cannot be compared to the dot-com mania. The late 1990’s boom was led by unprofitable companies trading on price to eyeballs metrics. I would argue that the best comparable period to today is the Nifty Fifty era of the early 1970’s, when investors were willing to pay for quality growth at any price. The growth companies then were highly profitable, just as they are today. As a reminder, the S&P 500 went sideways for roughly a decade after the Nifty Fifty bust, though investors could have profited handsomely through sector and style rotation.

The economic outlook
The dominance of Big Tech growth stocks is evidence that the stock market isn’t the economy, and the economy isn’t the stock market. Looking ahead to the next 12-18 months, the economy should see definitive signs of recovery by Q2 or Q3 2021. New Deal democrat has been keeping an eye on the economy with his suite of coincident, short leading, and long leading indicators. He has been making the point that his indicators tells the story of an economy that wants to recover, subject to progress against the pandemic.
All three time frames are positive, although the nowcast is only slightly so.
It is really unfortunate that right now was the precise time reporting stopped on one of the consumer spending metrics, as the other (Redbook) went just slightly negative this week, “possibly” reflecting the termination of federal emergency unemployment benefits. To reiterate my overall outlook, over the next six months, the coronavirus, and the reactions of the Administration (both present and possibly new in January), the Congress, and the 50 governors to the coronavirus, are going to be the dispositive concerns. Nevertheless, by late next summer – especially if there is a reasonably effective vaccine – I expect the economy to be firmly in expansion.
Several Phase III vaccine trials are underway. Despite the AstraZeneca trials being put on hold, my base case scenario calls for availability of a vaccine by mid-2021. While there will inevitably be some teething problems with distribution, vaccine availability, or the anticipation of availability, should be the catalyst for an economic recovery. I would add that the fight against the pandemic needs to coordinated, and global in nature. As Bill Gates has pointed out, we don’t need the virus to be hiding in some pockets of the world and act as a reservoir for COVID-19 to infect others. Control and eradication needs to be global.

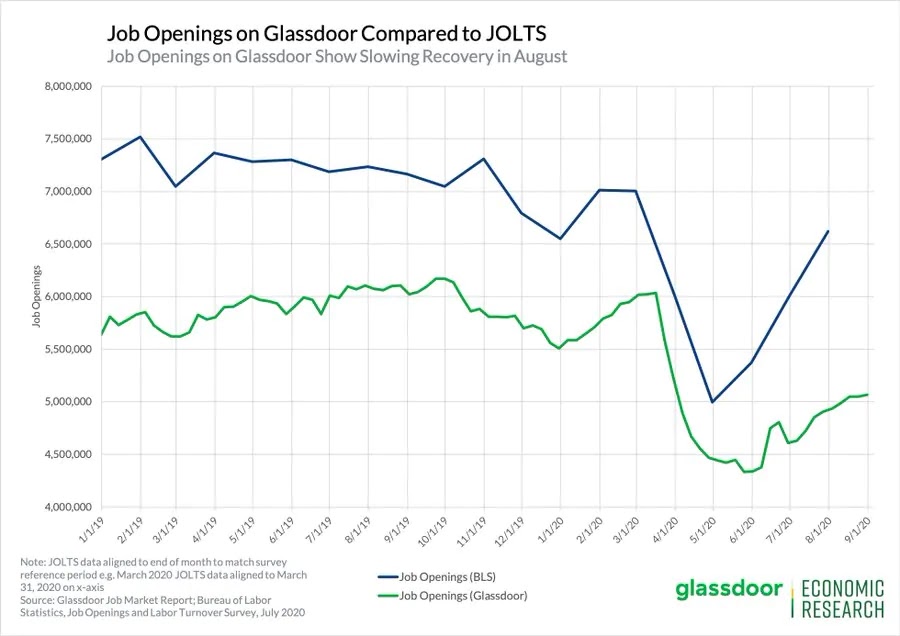
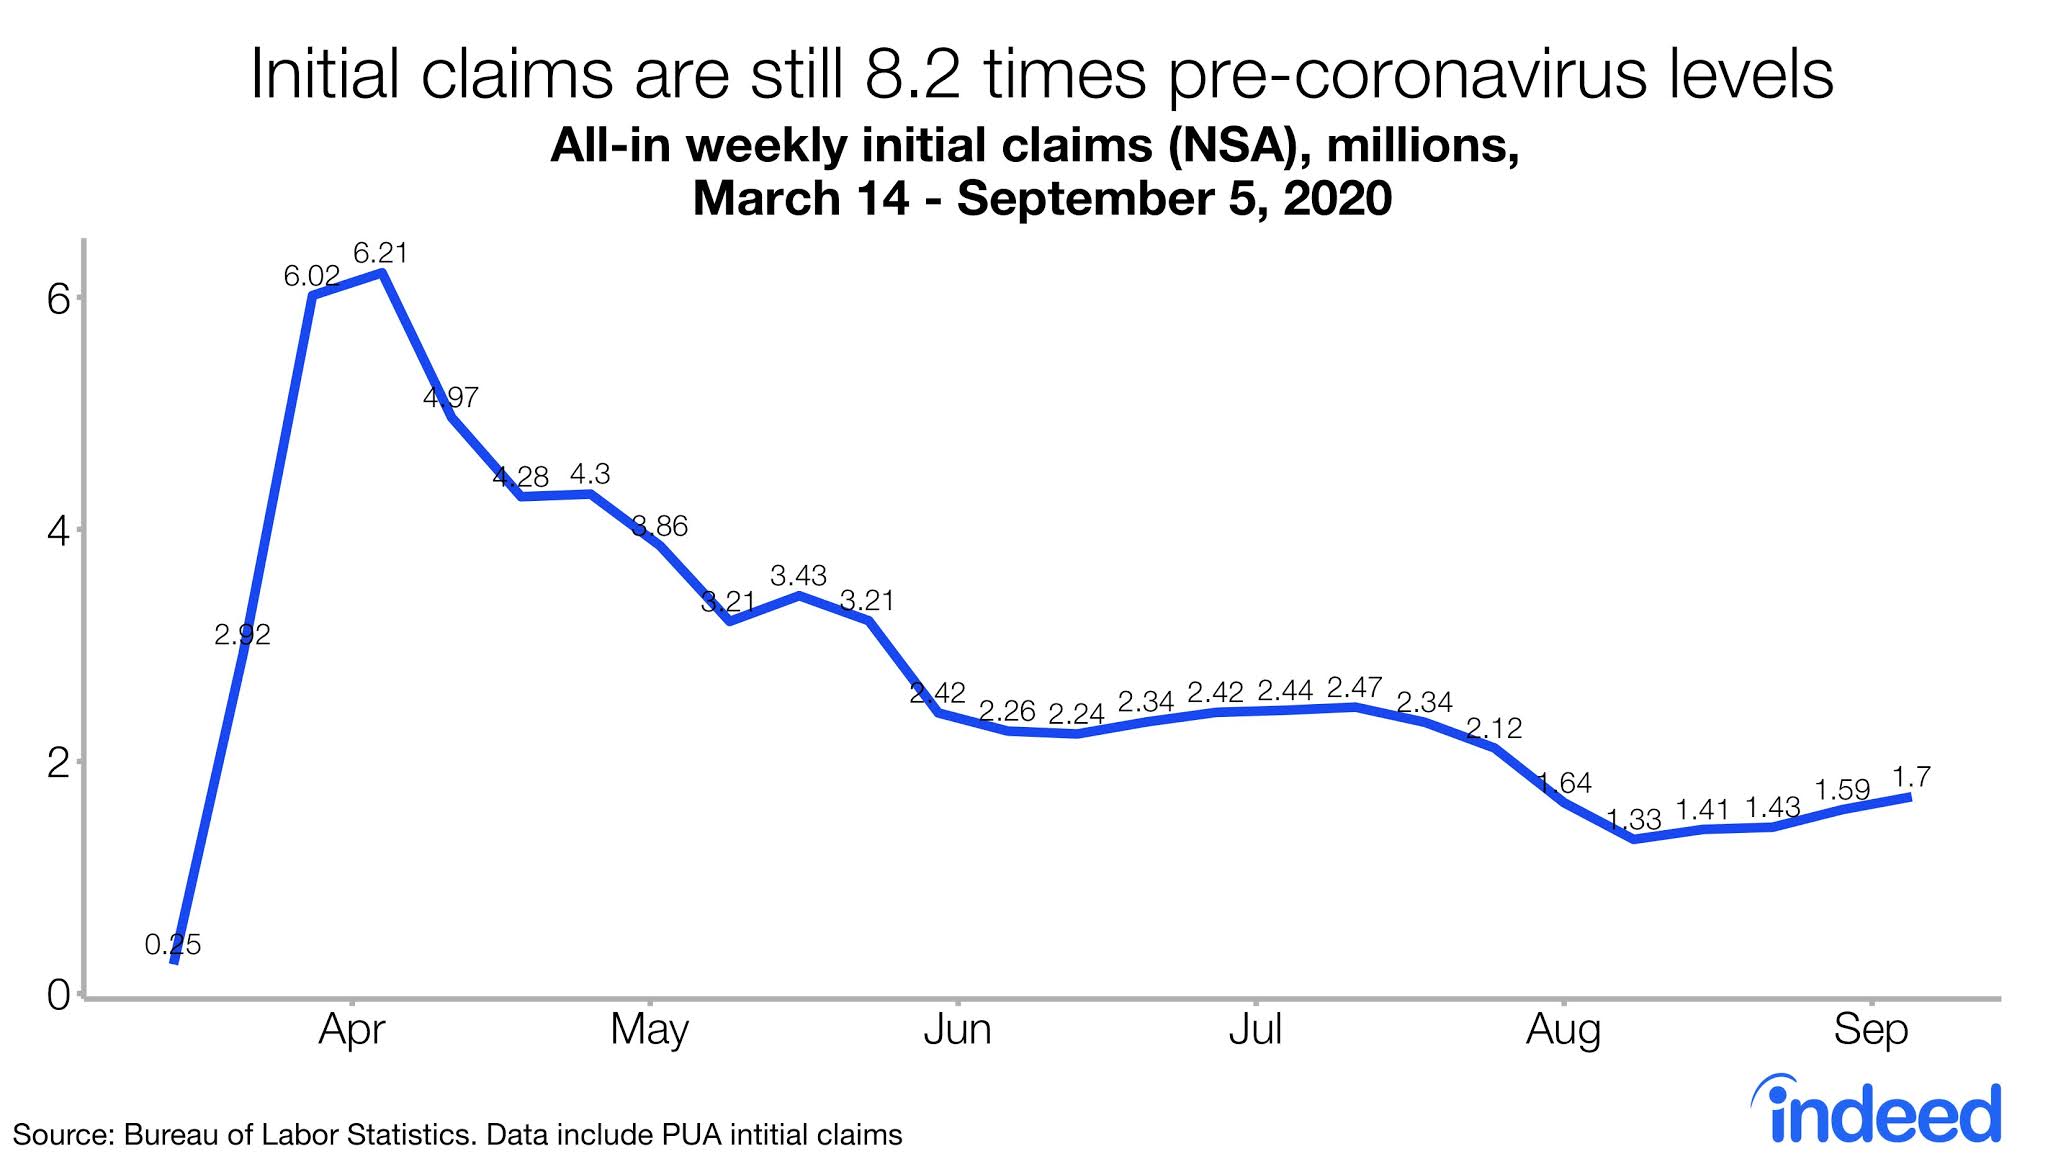
In the short run, the risk of a double-dip recession is rising due to fiscal inaction. High frequency data shows that the job recovery is stalling,
Funding is drying up for the supplemental weekly jobless benefit payments authorized by President Donald Trump at the start of August.
Funding for the Lost Wages Assistance program, which authorized an extra $300 a week from the federal government to most jobless benefit recipients, will not extend beyond the benefit week ending Sept. 5, according to statements by government officials from Montana, Texas and New Mexico. The states said they were informed Wednesday.
Where are the opportunities?
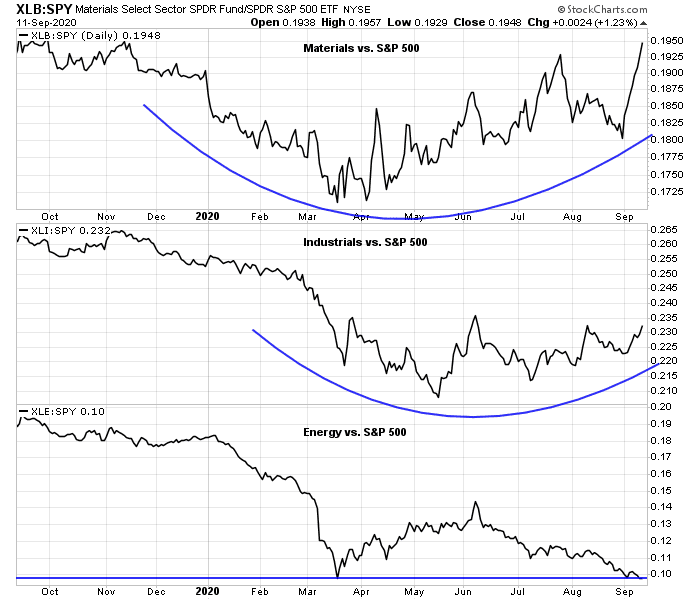
Notwithstanding the short-term risks, a NASDAQ crash argues for a rotation into cyclical and value stocks. We are already seeing constructive patterns of relative performance among material, energy, and industrial sectors.
From a global perspective, non-US stock markets provide greater opportunities from both valuation and sector exposure perspectives. An analysis of the sector weight differences between the S&P 500 against MSCI EAFE (developed markets) and the MSCI Emerging Market Free Index shows that the S&P 500 is heavily overweight technology and communication services. EAFE is overweight value (financials) and cyclical sectors (industrials, and materials). EMF is overweight value (financials) and cyclical sectors (consumer discretionary, materials, and energy).

Downside equity risk
We began this journey by posing the question of downside equity risk. If this is the start of a significant pullback, how far can stocks fall?
We can analyze the S&P 500 from several perspectives. While the S&P 500 does not represent the economy, the average stock, as measured by the Value Line Geometric Average, is a better representation. If the two were to converge, fair value for the S&P 500 would be about 2300, with the caveat that markets can overshoot on the downside.

If we were to analyze the market using the forward P/E ratio, it has historically bottomed out at a forward P/E of 10-15 times, and mostly at about 10. The main exception was the 2002 bottom, which was about 15 times.

Bottom-up 2021 EPS estimates is 166. At 10 times forward, this makes for an S&P 500 target of 1660; 12 times, about 2000; and 15 times, about 2500. The 2500 figure is also consistent with the analysis of fair value when comparing the Value Line Geometric Average to the S&P 500. FactSet reported that the 5-year average forward P/E is 17.1, and the 10-year average forward P/E is 15.4. The market bottomed out at just a forward P/E of just above 12 at the March panic low.

Putting it all together, my base case downside risk for the S&P 500 is 2000-2300, with a possible overshoot to about 1700 if the market were to really panic. This does not necessarily mean that the market will fall that far as it is based on the assumption of a NASDAQ and large growth stock crash. US equity investors can be largely insulated from the downdraft and find opportunity in cyclical and value stocks. Global investors will find more upside potential in non-US equities, with a particular focus on emerging markets.
While a downside target of 2000-2300 makes rational sense, don’t you think the FED or congress will roll out ‘packages’ way before then. Without a serious financial panics, it’s hard to imagine the FED will let things tank that far. Of course there are possible accidents that can happen. We might need a serious triggering event (maybe the election) to push the market lower steeply.
What do you think?
I agree Sean. I’m thinking it’s all about the second aid package. It’s puzzling that Trump is not pushing them harder as he has everything to gain from it, however nothing like a market drop to get Republican senators off the sideline.
Livewell, I’m afraid it is Pelosi and Schumer who are holding up the aid. They are refusing to go along with anything that doesn’t include a Trillion dollars plus to bail out dem controlled states and cities and a few billion for the post office. That puts the two sides at about a trillion and half dollars apart.
There’s only so much the Fed can do. It’s quite obvious that there won’t be a package until after the election. The Democrats are united. The Republicans don’t even have enough Republican votes to pass a package in the Senate because of the budget hawks in their ranks, so they’ll need Democratic votes to pass a bill. That puts Pelosi and Schumer in the driver’s seat. If Trump and the Republicans blink, that means a big package, funding for the Post Office, and they lose the election.
In the short run, we are facing two double dip waves. One from state and government layoffs, and the second from the expiry of the $600, and then the $300 per week of additional UI aid.
Democrats are united – question then is what are they united for or against? They are in my opinion united against giving aid to individuals unless post office gets the aid. Why are these two issues connected? Politics! Damn the individuals and the economy.
Republicans are united against giving aid to post office and States. Most blue states are a big mess (I live in one) and now want Federal Government to bail them out.
The tragedy is that individuals who need help are not getting help. The responsibility lies with both Democrats and Republicans. Neither party can pass a bill without each other’s help. Even after the election unless Democrats get sixty senators.
I agree economy might loose steam temporarily. But markets are forward looking. Any good news on vaccines and we will be off to the races. Short or step aside on your own peril. Rebalance but don’t quit.
Democrats are united in their legislative agenda. Republicans are not. Otherwise they would’ve passed a bill in the Senate.
Let me restate my point. Sixty votes are needed for any relief bill. Republicans, even united, have only 53. Democrats agenda is post office and blue states. So, if they wanted to pass a bill without the bailouts, it would be done in a heartbeat.
Just being united isn’t good for the individuals and the economy. United to help is what us missing.
It doesn’t matter if the Senate passes a bill anyway. Pelosi’s House will not give it the time of day. Not unless it has their two big bailouts.
It’s unfortunate to say but likely true that the wide income divide can result in a strong demand for cars and houses, interest sensitive areas, because high earners and remote workers are buying them and the folks that need the extra $600 wouldn’t even if they got the extra. We have two retail markets.
When you look inside the Materials Index, you see paints, chemicals, plastics, industrial gases, glass, metals. These are sold for home improvements, for home building, new cars, which are all booming due to the Covid. Sadly, these industries don’t need their customers to get extra unemployment benefits.
Yes, I liked the video too.
One thing that has been in my thinking is about whose money gets abused. Back during the depression the USA was the world’s biggest creditor and was running surpluses, so abusing the dollar was akin to shooting oneself in the foot. I don’t remember exactly when the USA became a debtor, but it’s been going on for a few decades, and this coincides with how the Fed has been reacting to all the recent market crises. So now when they decide to toss out a few trillion here, a few trillion there, it starts to add up lol…but who is getting shot in the foot? In 1933 when they took the gold and revalued it, the dollar was still backed by gold and this made further episodes of dollar bashing hard because other countries could have asked for gold instead of dollars.
This time may not be different, but just very very rare, so even if you look back to 1929 it may not be far enough because when was the last time a global hegemon got into trouble with debt and deficits while using a fiat currency?
Politicians will do what they can get away with and be reelected. Raising rates, sound money when it is not our money anyways, I don’t think will happen. They will continue abusing the dollar. Well it’s easier at least than reminding coins with less gold, and many other countries are in the same boat.
So, I feel nervous, but this can take a long time to evolve since the USD is reserve currency and debt is everywhere
Ken, thanks for the weekly update video!
You are very welcome.