Preface: Explaining our market timing models
We maintain several market timing models, each with differing time horizons. The “Ultimate Market Timing Model” is a long-term market timing model based on the research outlined in our post, Building the ultimate market timing model. This model tends to generate only a handful of signals each decade.
The Trend Asset Allocation Model is an asset allocation model which applies trend following principles based on the inputs of global stock and commodity price. This model has a shorter time horizon and tends to turn over about 4-6 times a year. In essence, it seeks to answer the question, “Is the trend in the global economy expansion (bullish) or contraction (bearish)?”
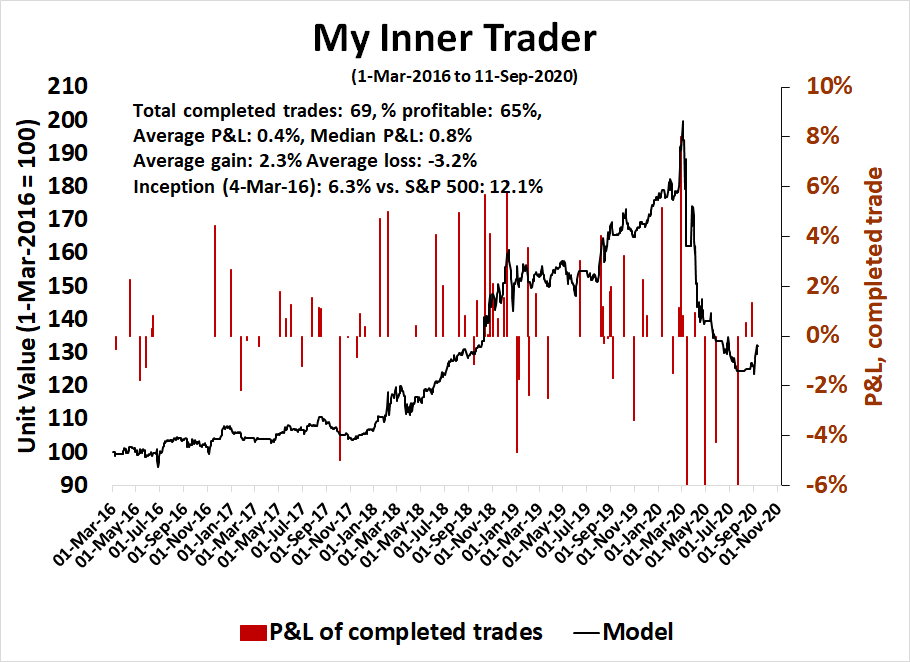
My inner trader uses a trading model, which is a blend of price momentum (is the Trend Model becoming more bullish, or bearish?) and overbought/oversold extremes (don’t buy if the trend is overbought, and vice versa). Subscribers receive real-time alerts of model changes, and a hypothetical trading record of the those email alerts are updated weekly here. The hypothetical trading record of the trading model of the real-time alerts that began in March 2016 is shown below.
The latest signals of each model are as follows:
- Ultimate market timing model: Sell equities
- Trend Model signal: Neutral
- Trading model: Bearish
Update schedule: I generally update model readings on my site on weekends and tweet mid-week observations at @humblestudent. Subscribers receive real-time alerts of trading model changes, and a hypothetical trading record of the those email alerts is shown here.
Subscribers can access the latest signal in real-time here.
A sentiment buy signal?
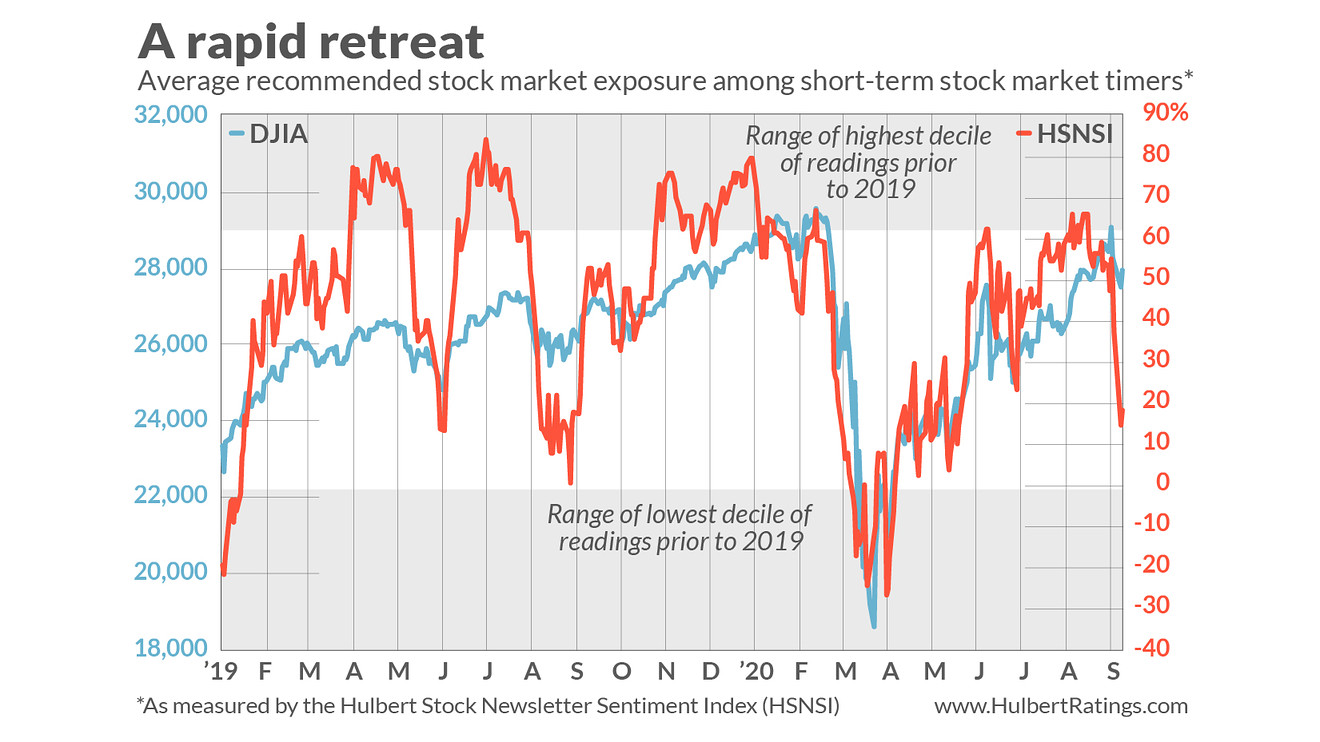
Consider the average recommended equity exposure level among a subset of short-term stock-market timers that I monitor on a daily basis. (This is what’s measured by my Hulbert Stock Newsletter Sentiment Index, or HSNSI.) This average currently stands at 30.1%, which means that the average timer now has 70% of his equity trading portfolio out of the market.
Just three weeks, ago, in contrast, the HSNSI stood at 65.9%. As you can see from the chart below, the HSNSI’s recent plunge rivals what happened during the February-March waterfall decline. That’s amazing, since the market’s early September sell-off — scary as it was — is child’s play by comparison. In contrast to a 34% plunge in the earlier downturn, the S&P 500 SPX, +0.05% from Sep. 2 to Sep. 8 lost less than 7%.
Other indicators begs to differ

We’re currently in the seventh of those great waves, which began about six years ago. Added Rhodes-Kropf: M&A waves tend to accelerate right before they end. And recent M&A activity does appear to be such an acceleration. “I’m not predicting the end,” he said. “But I wouldn’t be surprised if we’re near the end.”
One of the factors fueling the acceleration of M&A activity are the SPACs that are falling over themselves going public. There are the Special Purpose Acquisition Companies that are otherwise known as “Blank Check Companies.” SPACs have no business operations; they are created solely to raise money that would enable them to acquire other already-existing companies.
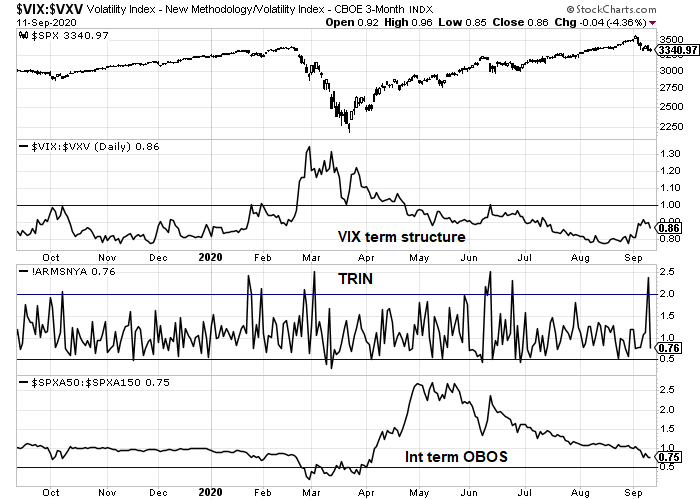
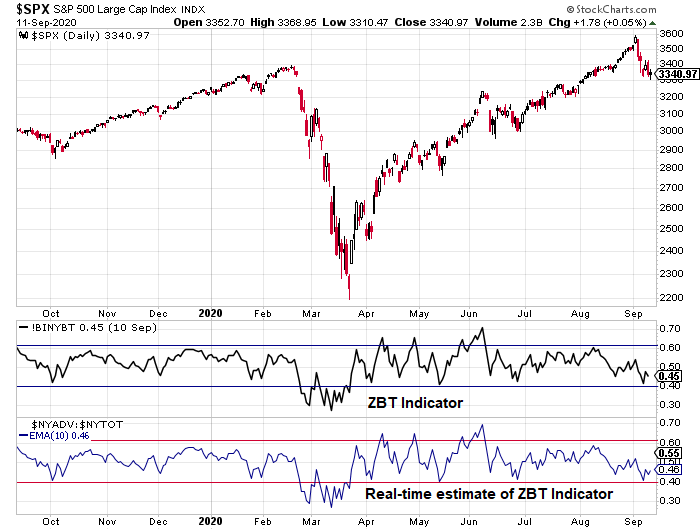
Another key component of my Trifecta Bottom Spotting Model, namely the term structure of the VIX, is not even inverted indicating a lack of fear. While TRIN did spike above 2 on Thursday as a sign of panic selling, the intermediate term overbought/oversold model has not reached the deeply oversold conditions consistent with an intermediate bottom. In the past, two or more of the components of this model needed to flash simultaneously buy signals before the market can see a durable trading bottom.
The week ahead

So, are you suggesting a probable correction, Cam? Or a revisit of the the March low (or close to it)?
Correction, yes. Don’t know how far down though.
I’m unclear about the market timers comments. I t looks to me like they get it mostly right.
Do a mental exercise. Fade the market timers and what do you get ? Broke.
Wes, I see the same thing. The timers (especially a select few) get on new trends really early. Then ride them to their conclusion.
Generally there are economic signals as well to indicate a bear market type scenario outlined. Credit Markets (high yield) have remained firm, interest rates are stable and I don’t see that credit events have led to the current equity weakness. Can equity weakness lead to credit events and be a downward spiral?
Equal weight S&P is relatively stable as well. Earnings are expected to rise and cyclicals are relatively strong. It does not speak to economic weakness.
The matter of unemployment benefit running out. It’s true that benefits period ended. But most of the money has not been paid by the states. It is expected lump sum checks will go out for $1800-$2400 In September and October.
It feels like a correction of the froth so far. Average stock in s&p is down roughly 2%. Fed is still supporting the financial markets. Vaccine trials are on track.
The biggest risk to me is the post election chaos and mayhem. We have seen the ‘summer of love’. I think it could be a prelude to what’s to come.
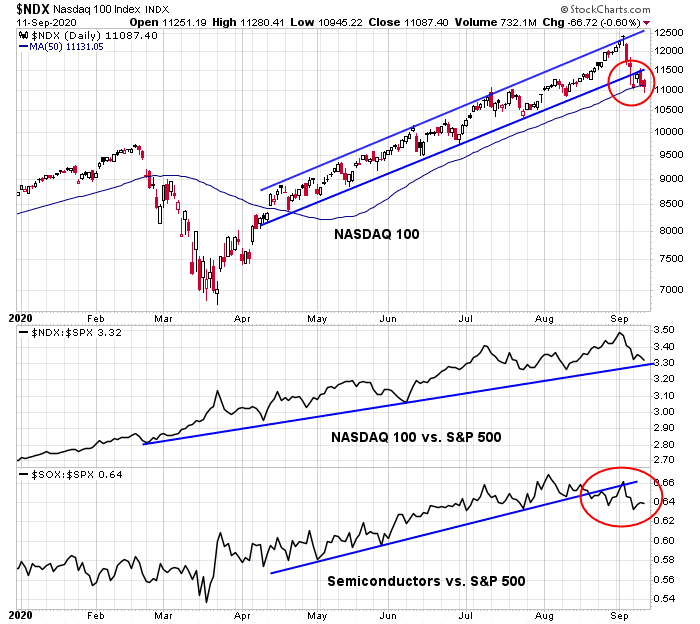
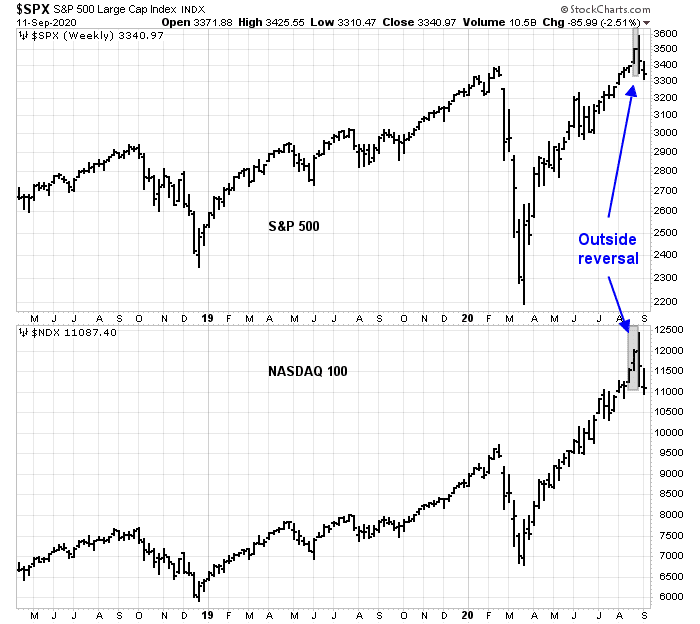
Excellent points, Ravindra. The one thing I see that I concerns me is that the Naz indexes have broken under their 50 dma. I was hoping to see more support at those levels – especially being the first time there since breaking new highs. The S&P is sitting right above its 50 dma.
I feel a rally coming soon. The strength of that rally will tell us a lot about the market strength.
I believe institutional investors don’t bail out unless 200 day average is violated. They also don’t add below 50 day SMA.
Not uncommon for markets to dip below 50 sma briefly. We may chop around here for a while
I lightened up on longs last week of August. Stroke of luck!!
Where are D.V. and rxchen2? I enjoy reading their posts.
I’m around, Wally. I just don’t have anything to say right now.
Sitting in RYGBX (Rydex Long Bond). That’s it.
OK, buddy.
Sorry, Wally, I am here, like Rx, and do not have much to add, plus have been very busy at work.
I have been reading a book by Laurie Garrett, titled The coming Plague. This was written in 1994, and warns of the oceans of pandemics we humans seem to ignore. This book won her a Pulitzer. You may like to check it out. The book paints a grim picture of Vaccine development (!).
I am short in the market. That said, this is more of a reluctantly moving down type of a market. It has been a grind down to 50 DMA. That said, Palantir IPO is coming week after next and should be bullish, so not adding to short positions for now. What is curious is the stair step way down on the S&P 500, but the VIX is also stair stepping down with it. Cam had talked about this, a few posts ago (the reverse of what I said). To that, I think there may have been a technical reason why the VIX was rising with the Market (I posted this a few posts ago). The same technical reason may be driving the VIX down with the market. The stair step way the market is going down is not what I like. It is just too orderly for me, to get excited. All said, we are not even 10% below ATH of 3587. What can I say.
I am sure there is a September and October surprise somewhere. So, nothing to add.
Great post, D.V. Good to see you are still checking in. I read some of the reviews on The Coming Plague. It sounds like there are a lot of stories of how the CDC handled or mishandled some of the past diseases that have popped up. I’m hoping a vaccine puts our current plague behind us soon.
The last two Tech bubbles that popped were the Nifty Fifty of 1973 and the Dot.com of 2000. Both of these popped after Fed saw the bubbles were a consequence of an overheated economy. So they were tightening which both led to general recessions after continued tightening.
This bubble is different in that it would have to pop in an environment of an extremely easy FED and fiscal stimulus. They are trying to get out of the current COVID recession not an overheated one.
My factor research is showing that this downturn in similar to the 1973 and 2000 ones in that popular stocks are leading the market down. The economically sensitive groups are doing fine. The earlier ones had the economy eventually roll over into a recession and carry everything lower.
Will the economy stall out and pull the economically sensitive stocks (Value) down? Or will this be a short dip where mainly the popular stocks adjust? This would see the market overall only have a fast 10% max downturn.
BTW there was a similar downturn of popular growth stocks leading the way down from January to February 2018 that was over in a month. This followed the big surge in growth stocks in 2017 and the tax-cut at year end. Speculation was hot. The FED was on the sidelines then and no economic stress ensued.
Ken makes a good point about the Jan 2018 correction which preceded a bigger correction later in Oct 2018. Along the way, there were buyers early in February through May of 2018 when $NDX dropped >0.5% and $VXN dropped 1% or more in the same session. The three buy signals were 2/2/18, 2/8/18 and 5/21/18. All yielded about 5 to 10% returns with a maximum drawdown of 8.5% for the first trade with an average time in trade of 17 trading days.
https://postimg.cc/fVG4LTs0
I wish we could get a warning like this when it is time to get out of the market.
https://twitter.com/holdmyale/status/1304893998151204865
I think someone made an interesting point that the “correct” way to interp Barron’s cover story is that they say it IS a bubble, so it clearly is not!!
I found this thread by Ed Clissold to be interesting and elucidating. https://threadreaderapp.com/thread/1304809806302150661.html
Clissold goes on to say this:
Ed Clissold
@edclissold
·
18h
Replying to
@ldiped01
We defined cyclical bulls purely by quantitative measures, a 30% rally over 50 calendar days OR a 13% rally over 155 days. If it doesn’t look like the economy is going to open up more by early 2021, your concerns will be validated, and this will be a short cyclical bull, IMO.
https://www.yahoo.com/news/top-disease-expert-warning-another-165313827.html
Call me a pessimist, if you like, but I see myself as a realist. I remain less than optimistic about a vaccine, in the short term.
https://www.amazon.com/Coming-Plague-Emerging-Diseases-Balance/dp/0140250913/ref=rtpb_1/137-0794594-4670351?_encoding=UTF8&pd_rd_i=0140250913&pd_rd_r=3eb4b043-f072-4921-a59d-0c3bc267e76a&pd_rd_w=bpDsE&pd_rd_wg=UWmDD&pf_rd_p=1060fc32-cc06-48f1-987d-6b74a57cd8f2&pf_rd_r=M5A5P74KZXG9KE0426XG&psc=1&refRID=M5A5P74KZXG9KE0426XG
Check this out, for more a realistic view on infectious diseases and vaccines (Especially the chapter on AIDS).
Did you see what the Pfizer CEO said about their vaccine?
https://www.foxbusiness.com/healthcare/pfizer-ceo-coronavirus-vaccine-new-year
Wally,
Not to be a pessimist but, Can you imagine what will happen to the vaccine, which is rushed through, after 10 people get Guillain Barre syndrome or any other complications? The vaccine will come to a Dead stop from being used. Like I tell my patients, in this age of instant gratification, You can Try rushing biology, but it takes the time that it takes, you can’t rush it. As an example I do this mental exercise with them and say, “Let’s put 9, 1 month pregnant women in a room, and then expect a baby out in 1 month because the 9 month time limit has been reached by adding more bodies. It DOES NOT work like that. You can’t rush biology, it is what it is. If it takes a woman 9 months to get a healthy baby, then that’s what it takes.”
So, yeah we are rooting for the vaccine but that has other implications which all the pundits in their hype are not familiar with.
Just my $0.02
True, Mohit, but we may be due a little help from God, too.
There is an old saying that I hope is still true, “God watches out for little children, Israel and the United States of America.”
Peace in the Middle East would be wonderful and not a distraction as Polesi say. Pulling troops out and signing peace agreements. Iran looks to be more isolated and hopefully the chance for ultimate peace (I am that naive) is not far in the future. What a great old saying.
I don’t know, Mark. There is so much hate, ignorance, bad government and ideology in that part of the world I’m not sure that us mere mortals have the ability to solve the problem of creating peace there. We will probably need to wait for a higher power to intervene.
Dr. Mohit, two physicians in my immediate family have trust and confidence in the scientific community to do the right thing. When it is available, it will be safe for use. Scrutiny will be extraordinary but benefits will outweigh the risks. Every known drug, procedure and invasive test has risks that we routinely accept. I think younger population may take it initially.
A new SentimenTrader Lite blog post has been published. It is shown below, or you can read it on our blog by clicking the link below.
The Nasdaq’s internal momentum has been waning
Arguably the two biggest stories in sentiment this week are the continued explosion in speculative options activity and nascent signs that the momentum bubble in the Nasdaq has been pricked. The two are related and will have a big impact on overall market returns going forward.
As for the Nasdaq’s momentum, the 10-day average of its Up Volume Ratio has slid below 50%.
Nasdaq up volume ratio
There are all kinds of ways to define market environment and momentum, and using an average of Up Issues or Up Volume is effective on a short- to medium-term time frame.
We can see from the chart that the Nasdaq’s annualized return when 10-day Up Volume is above 50% is a very robust +20.9% while below 50% it’s a lowly zero. The Composite tends to struggle when Up Volume is negative but not negative enough to be oversold.
This ended the Nasdaq’s 3rd-longest streak in 35 years with 10-day Up Volume above 50%. The longest streak ended in September 1995, almost exactly 25 years ago, and it preceded a couple of months of a choppy decline.
Closing RYGBX end of day. It may be just lack of patience on my part, but I’m just not seeing any strong bids for bonds right now.
As of last Friday’s close, the trade was up +0.96% – and the majority of the gain should hold into today’s close.
In the short term, if the rally persists, there probably won’t be a positive move in bonds as I see it. The bond market would do better if Cam’s Naz crash happens.
SPY/ QQQ would have to break out above 349/ 290 for me to get bullish again.
In the meantime, I’m playing the ‘six and eight’ for cash flow.
There are many ways to look at market internals and many students of the markets who looked at it had been wrong in this rally from mid-March, including Sentimentrader. It will take too long to explain how the summation index should be read, but the following is one way to look at it, and the data showed that even though the week is still early, there is a sign of bullishness even in the $NASI (weekly) even as the $NASI (daily) is heading down. It is a paradox that could be explained by the analogy to the ‘coastline paradox’ if you care to read up on that. If you look at the chart of $NASI (weekly) on 10/4/19, that is the week that the autumn rally started in 2019 and that level is the same as we are today.
https://postimg.cc/ctrZDYv5
Goldman Sachs economists said they recently raised their third quarter GDP growth forecast to 35% from 30%, and they say consumer spending was a big reason for their above consensus forecast.
https://www.cnbc.com/2020/09/10/goldman-forecasts-a-much-higher-35percent-jump-in-q3-gdp-growth-based-on-strong-consumer.html
Yesterday’s S&P high was just a few points under the monthly fib at 3410. This morning we opened over that fib by a couple points. The next fib is around 3455. We may see clear sailing to that level if we don’t pull back under 3410 this morning without bouncing back over it.
Closed a bit under the 3410 fib. Setting up for another gap open above it. If it doesn’t open above it the odds favor a down day heading back towards the 3330 fib.
Opening partial positions in AAPL/ BAC/ DIA/ SPY/ QQQ totaling ~17% of the portfolio.