Mid-week market update: While it may seem like the Apocalypse for people trading the momentum FANG+ stocks, this is not the Apocalypse. Sure, the market has violated its rising trend line, but this trend break is nothing like the COVID Crash experienced earlier this year.
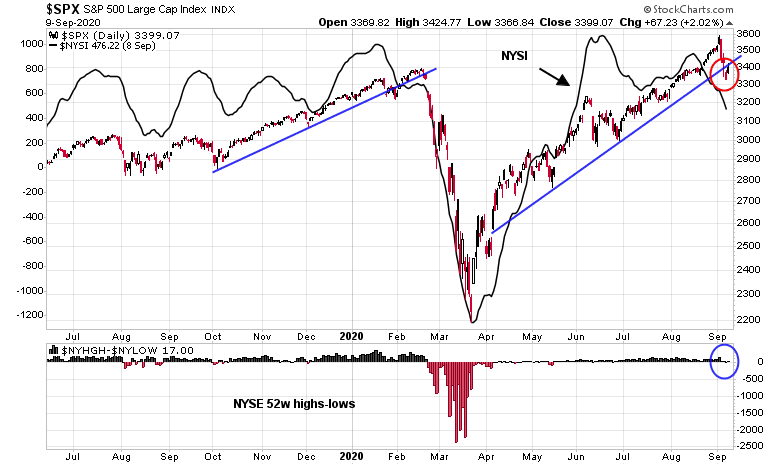
Before the bears get all excited, there are several key differences between the current trend break and the February trend break. While the NYSE McClellan Summation Index (NYSI) warned of deteriorating breadth in both cases, net NYSE highs have not broken down in the manner of February 2020.
The latest trend break was led to the downside by Big Tech stocks. The analysis of the NASDAQ 100 show similar violations of rising trend lines, and similar warnings by the NASDAQ McClellan Summation Index (NASI), but the NDX/SPX ratio remains in a relative uptrend. We can see the strength of NASDAQ stocks during the COVID Crash by observing that while the SPX broke the uptrend in early February, the NDX uptrend held during that period and did not break down until later in the month. As well, similar the S&P 500 chart, the current readings NASDAQ net new highs are also not showing any signs of signification deterioration.

Fading momentum
If this is not the start of a significant pullback, what’s going on? It might be a case of fading macro and price momentum. The Economic Surprise Indices, which measures whether top-down economic data are beating or missing expectations, are all starting to roll over all around the world.

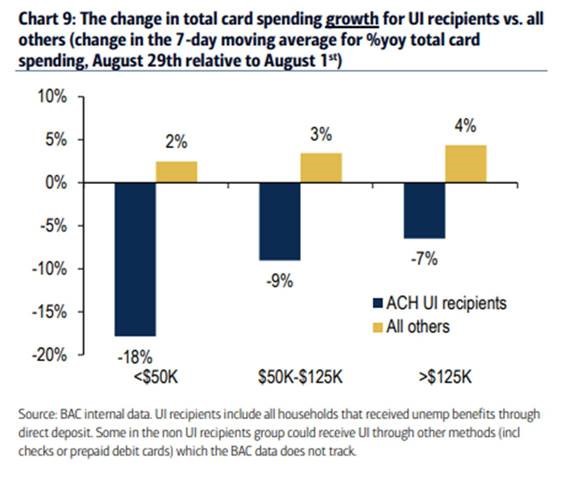
The withdrawal of fiscal stimulus is starting to bite. BoA tracked the card spending of all known unemployment insurance recipients for the month of August, and all have seen significant declines.
Calculated Risk also reported that timely rent payments slid -4.8% in September compared to August.
A recent Bloomberg article enumerated the rising risks all around the world:
The world economy’s rebound from the depths of the coronavirus crisis is fading, setting up an uncertain finish to the year.
The concerns are multiple. The coming northern winter may trigger another wave of the virus as the wait for a vaccine continues. Government support for furloughed workers and bank moratoriums on loan repayments are set to expire. Strains between the U.S. and China could get worse in the run-up toNovember’s presidential election, and undermine business confidence.
“We have seen peak rebound,” Joachim Fels, global economic adviser at Pacific Investment Management Co., told Bloomberg Television. “From now on, the momentum is fading a little bit.”
In addition, different indicators price momentum factor are also weakening.

Negative seasonality
Another explanation might just be seasonality, which is negative for stocks over the next few weeks.

Renaissance Macro also observed that election year seasonality is turning down just at the right time.

A bounce, then…
In the short run, the market is due for a bounce of 1-3 days as readings as of last night (Tuesday) have become sufficiently oversold to warrant a relief rally.

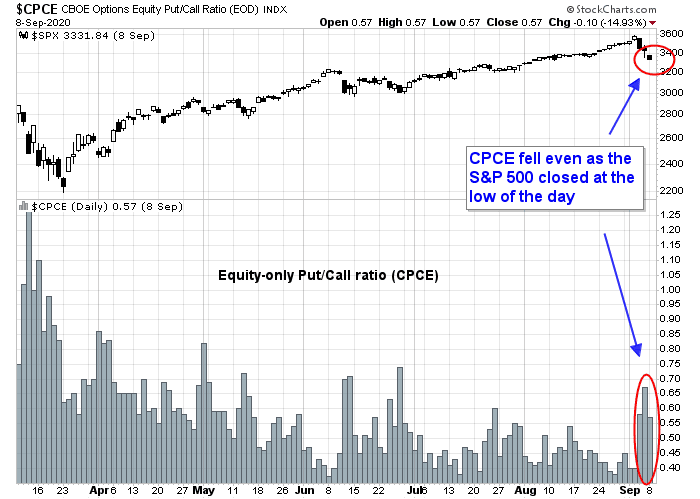
But make no mistake, this decline isn’t over. The equity-only put/call ratio actually fell even as the market closed near the lows of the day yesterday. This is indicative of excessive complacency among option players.
Watch for a short-term relief rally, followed by a resumption of the pullback.
Disclosure: Long SPXU
Cam, thanks for the timely weekly update! Good job as usual. I see on the top charts you referred to the McClellan ratio adjusted summation indices of the Adv Decl for NYSE ($NYSI) and NDX ($NASI). I don’t usually look at the summation index because the $NASI has a tendency to move negative and NYSE doesn’t seem to drive the markets these days. I will post what I see with my Adv Decl summation based on the SPX using AdvSP and DeclSP which basically showed a flat line and a slight curling up on the weekly chart. I don’t claim this is identical to the McClellan summation but it is calculated the same way and ratio adjusted to the $NYSI. I don’t always answer the threads because most of my posts are moderated which may be due to my internet connection I suppose, but thanks for all the updates and keep up the good work.
Adv Decl summation based on the SPX using AdvSP and DeclSP data from Tradestation.
https://postimg.cc/0bSd1Cqk
Nasdaq ADVQ DECLQ Summation ratio adj, weekly based on Tradestation data. May be bottoming around zero.
https://postimg.cc/PvnsfNDc
We had a pretty sizable bounce today which topped out at the 21d ema (also gap fill) before profit taking into the close.
Was that the relief rally before further pullback?
I would wait for this to get to at least a neutral level first. Probably it needs to get overbought, or a near overbought reading.
http://www.indexindicators.com/charts/sp500-vs-sp500-stocks-above-5d-sma-params-x-x-x-x/
All right. The long bond has reversed to trade higher, and will likely close at the highs.
The real question is whether it’s the beginning of a larger move – +5% to 7%, perhaps.
SPY 315 to 320 versus TLT 172 to 175 over the next few weeks?
It’s a lovely day for a bear and at this moment SPX at 3345 won’t find any level of chart support until 3300.
As I previously said it’s about time the market has gotten into sync with Mr. Hui.
Correction — SPX Support is at Tuesday’s close – 3332. Bounced today from ~3:30pm intraday low of 3329 .
My gut feeling is that we see another swoon tomorrow morning probably to the neighborhood of 3300 as boveri mentions – maybe a bit lower. Then I expect a mid or late day rally that starts a multi-day move up into next week.
I believe this selloff has come as the market has begun to realize that the democrats have no intention of passing a covid relief bill for Americans unless they get a Trillion+ to bail out democrat run states and cities. They could change their minds if they come to the conclusion that their reluctance to help small business and the unemployed is costing them a large number of votes in November.
Today is only the 3rd time in the last 2 years where $NDX loses 2% and $VXN loses 0.8%. Bearish or bullish? The other times were 3/20/20 and Tuesday.
https://postimg.cc/yJFfwg3r
I put on a short trade near the day’s high (lucky me) and have pulled my stop to BE + lunch money. I’m planning to leave it on until stopped out or we break yesterday’s lows.
Liberals here will be happy to know that I sent Senator John Cornyn (R – Texas) an email saying that I’m going to hold my vote for him. He 1) asked for a donation from me with some lie that his opponent was within 1% of him in the polls and 2) this morning I heard him on the news disparaging President Trump. Cornyn can take a hike with that attitude.
Covered my short on the break to the lows of the last 4 days. The S&P is now sitting right on the 50 dma. Maybe we break significantly through that, maybe not.
Weekly SPX ADV DECL summation Index (SPSI) ended the week flat or slightly curl upwards. It had broken down below 380 by Thursday but showed accumulation by close on Friday. This is unlike the $NASI for Nasdaq which has a decidedly negative bias by week’s close. I should explain that this index differs from the McClellan by taking the summation at week’s end and not daily and therefore avoids the accumulation problem that is similar to the ‘coastline paradox’ in cartography where the smaller measurements accumulates to a larger number and bias. This is why this indicator is more rapidly responding to the market internals.
https://postimg.cc/jLqtymL1
https://www.marketwatch.com/story/this-1-big-change-in-the-market-means-higher-stock-prices-are-likely-over-the-next-few-weeks-2020-09-11?mod=home-page
Another simple one line strategy that has a 15.3% annual return, 54% total over the last three years. Simple 1 line: rateofchange( c, 1) < -.5 and rateofchange( c data2, 1) 1%, then buy next day. The strategy is 100% profitable when allowed for a maximum of 16.5% drawdown (actual close to close drawdown is $0). Ten trades in 3 years, average trade profit is 6%. Yes, the $NDX looks like it is breaking down, but somebody is buying or else why should the $VXN be down? The next trade is buy on open next bar (Monday, 9/14/20). Don’t blindly follow the trade.
https://postimg.cc/xNPgDYbD
Some text got cut off in the post, the strategy parameter is on the picture linked and is:
rateofchange( c, 1) < -.5 and rateofchange( c data2, 1) < -1