Preface: Explaining our market timing models
We maintain several market timing models, each with differing time horizons. The “Ultimate Market Timing Model” is a long-term market timing model based on the research outlined in our post, Building the ultimate market timing model. This model tends to generate only a handful of signals each decade.
The Trend Asset Allocation Model is an asset allocation model which applies trend following principles based on the inputs of global stock and commodity price. This model has a shorter time horizon and tends to turn over about 4-6 times a year. In essence, it seeks to answer the question, “Is the trend in the global economy expansion (bullish) or contraction (bearish)?”
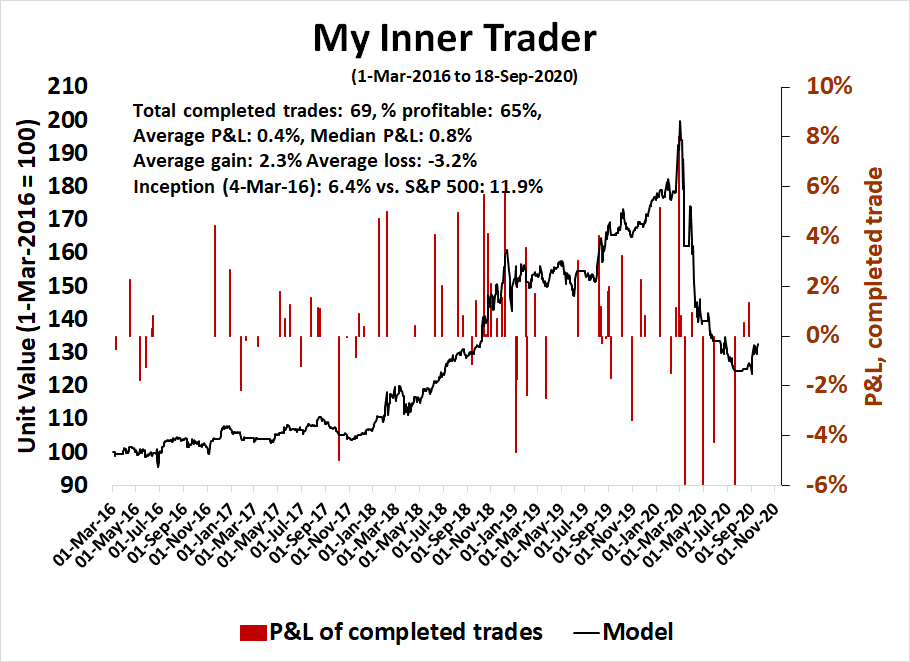
My inner trader uses a trading model, which is a blend of price momentum (is the Trend Model becoming more bullish, or bearish?) and overbought/oversold extremes (don’t buy if the trend is overbought, and vice versa). Subscribers receive real-time alerts of model changes, and a hypothetical trading record of the those email alerts are updated weekly here. The hypothetical trading record of the trading model of the real-time alerts that began in March 2016 is shown below.
The latest signals of each model are as follows:
- Ultimate market timing model: Sell equities
- Trend Model signal: Neutral
- Trading model: Bearish
Update schedule: I generally update model readings on my site on weekends and tweet mid-week observations at @humblestudent. Subscribers receive real-time alerts of trading model changes, and a hypothetical trading record of the those email alerts is shown here.
Subscribers can access the latest signal in real-time here.
More election volatility
While I am not a volatility trader, my recent calls on the evolution of volatility have been on the mark. Three weeks ago, I raised the possibility of a volatility storm (see
Volmageddon, or market melt-up?) owing to rising election jitters. I concluded “I would estimate a two-thirds probability of a correction, and one-third probability of a melt-up, but I am keeping an open mind as to the ultimate outcome”. Two weeks ago, I turned more definitive about rising volatility and called for a volatility storm (see
Brace for the volatility storm).
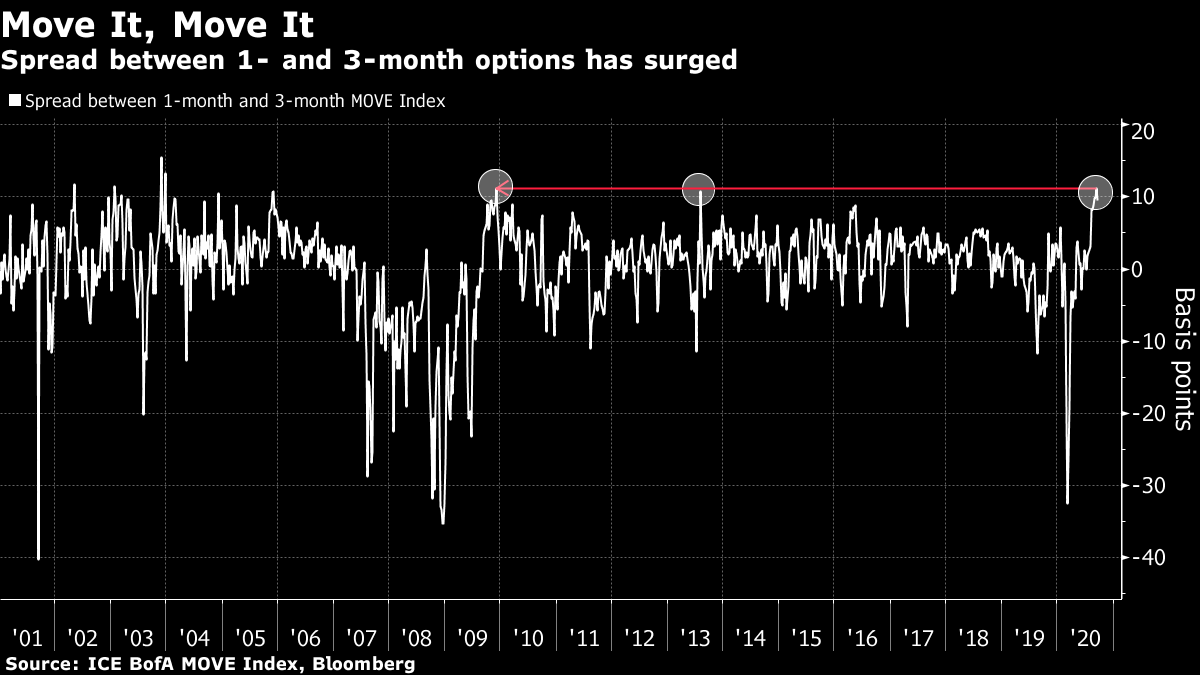
The rising election induced volatility theme has become increasingly mainstream in the financial press. Bloomberg highlighted that the one and three month spread in the MOVE Index, which measures bond market volatility, is spiking.
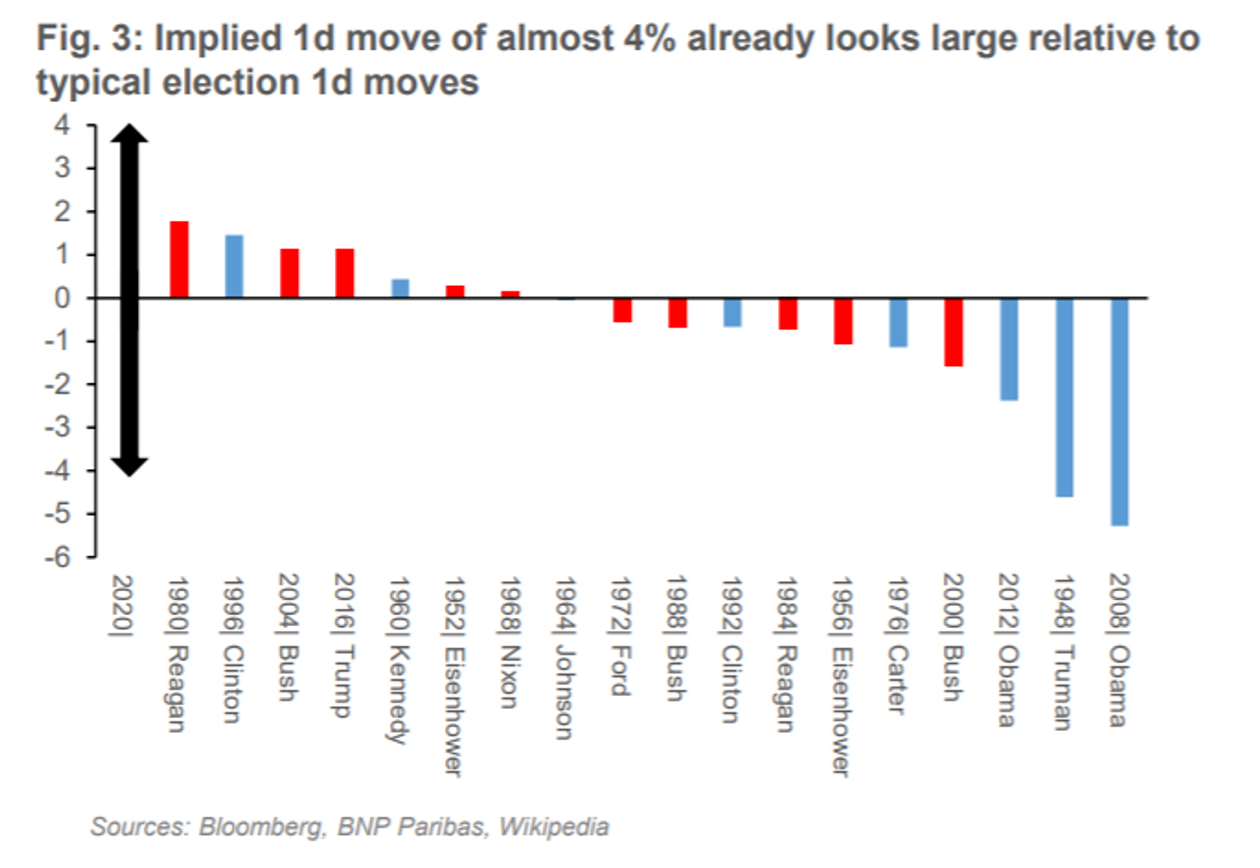
Marketwatch also reported that analysis from BNP Paribas shows that the implied equity market volatility over the election window is sky high compared to past realized returns of election results.
In addition, all these option readings were taken before the news about the death of Supreme Court Justice Ruth Bader Ginsburg. Should the election results be contested and wind up in the Supreme Court, the odds of a 4-4 deadlocked decision just rose with Ginburg’s death, in which case the lower court’s decision would stand. This raises the odds of judicial and constitutional chaos. Imagine different states with wildly inconsistent decisions on balloting. The Supreme Court nomination fight also raises the political resolve of both sides in Congress. Don’t expect any stimulus bill before the election, and even a Continuing Resolution to fund the federal government beyond September 30 is in jeopardy. Watch for implied volatility to rise in the coming week.
It seems that the bears have taken control of the tape, based on a combination of election uncertainty and a reversal of excessive bullish retail positioning on Big Tech stocks.
Technical breaks
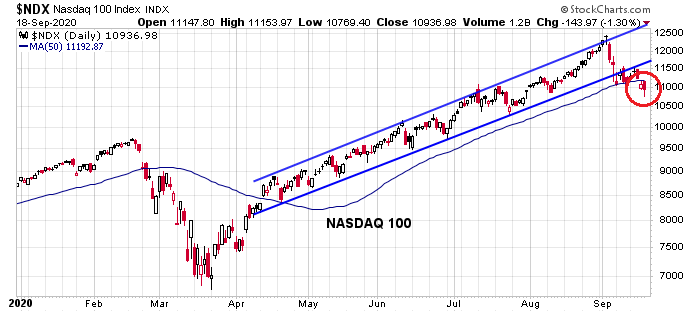
The S&P 500 and NASDAQ 100 are experiencing major technical breaks from both short and intermediate term perspectives, which is leading to the conclusion that the correction isn’t over.
In the short run, the daily chart of the market leadership NASDAQ 100 violated both a rising trend line and its 50 day moving average (dma), which are important levels of psychological and technical support. As Big Tech sectors (technology, communication services, and Amazon) comprise 44% of S&P 500 index weight, weakness in the tech heavy NASDAQ 100 is an important indicator of the direction of the broader market.
The S&P 500 also violated an important rising trend line and exhibited a minor break below its 50 dma.
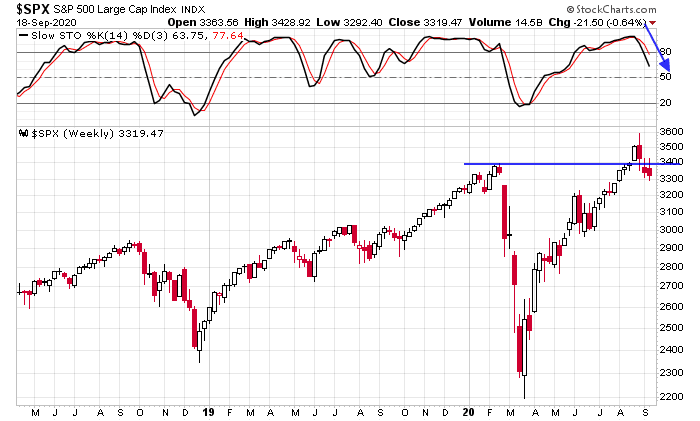
The weekly chart of the S&P 500 is just as ominous. The index has broken down through a breakout turned support level for two weeks. In addition, the stochastic has recycled from an overbought reading, which is an intermediate term sell signal.
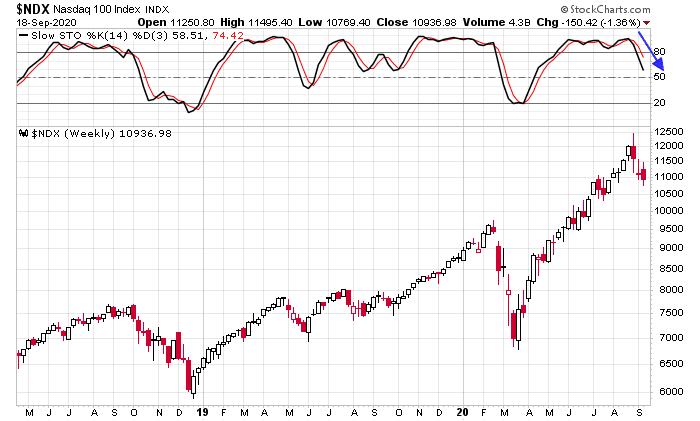
The weekly chart of the NASDAQ 100 also flashed a similar stochastic sell signal.
These conditions lead me to believe that an intermediate term correction has begun, and will not be complete until the election in early November.
Sentiment still frothy
The second major reason for the bearish break is the unwind of excessive bullish sentiment among retail traders. There has been an explosion of stories about the speculative activity among Robinhood traders due to the attraction of its zero commission policy, and the frenzy has spread to other major online brokerage firms. The froth was quite evident when even
TMZ began publishing sponsored articles about day trading.
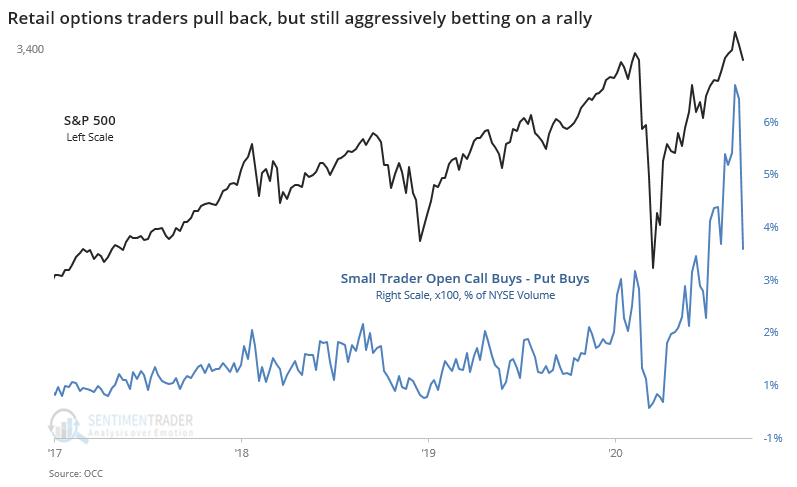
Moreover, retail call option activity has exploded. An astute reader pointed out analysis from
SentimenTrader showing that while retail call volumes have receded, they are still very high and small traders are still very bullish. Despite the pullback in the popular Big Tech stocks, SentimenTrader wrote that bullish sentiment remains elevated and it has not fully capitulated.
Clearly, there was a big pullback in speculative volume last week, dropping off by more than 50% from the upside panic to start September. But when zooming out, we can see that last week was still higher than any previous record high, by far.
An orderly retreat
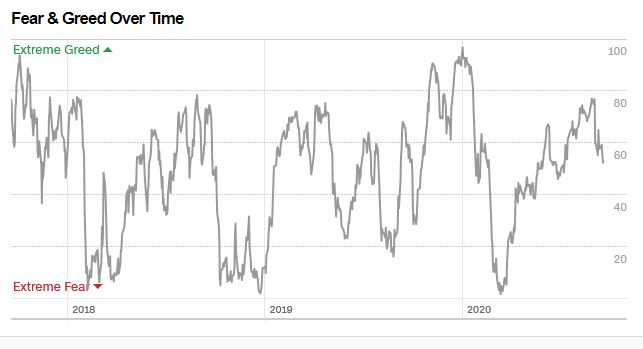
The market has been devoid of the panic that marks intermediate term bottoms. The Fear and Greed Index is falling, but the reading is only neutral.
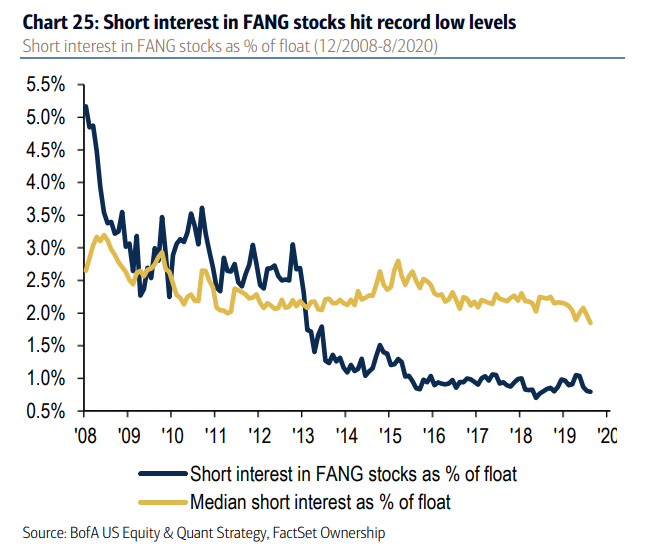
The weakness in the NASDAQ 100, which had been the market leadership, is especially disconcerting. BoA pointed out that FANG short interest is extraordinarily low, indicating that short covering demand will not put a floor on these stocks as they weaken.
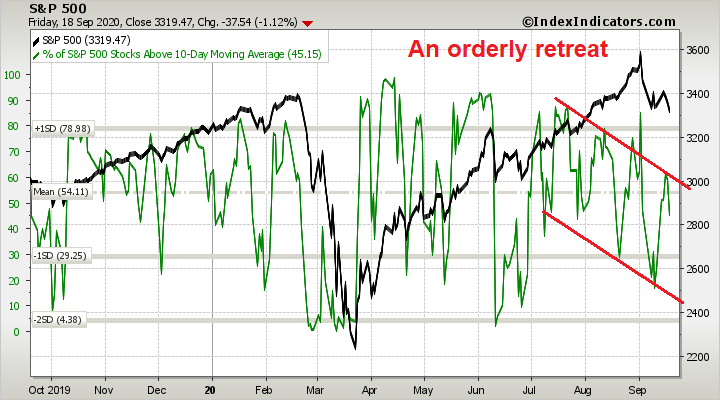
Moreover, the market’s retreat has been orderly. The percentage of stocks above their 10 dma are in a downward sloping channel of lower lows and lower highs.
In conclusion, the bears have taken control of the tape. Traders should brace for a period of weak and choppy markets until the November election and beyond. Much will depend on the course of electoral fortunes. The Presidential debates lie ahead, and there is always the possibility of an October surprise. Moreover, there is a high level of uncertainty over whether the election results would be contested in the courts, or even worse, in the streets, after November 3. It is therefore difficult to formulate downside target levels, except to say that the combination of sentiment and technical indicators are not pointing to a bottom today.
Disclosure: Long SPXU


Given the uncertainty about almost everything I appreciate the very clear stay bearish conclusion.
This is a classic Factor Beta Crash where popular high beta stocks plunge with a tame economic backdrop. It is a sentiment swing of short term traders. These are painful but short lived.
My Gorilla Index of seven high flyers was 55% up from the Feb. S&P 500 market peak and now its about 40%. The S&P 493 (ex the Gorillas) is down about 5% since the the Feb peak.
I expect that many other popular stocks in Technology, Communication Services and Transportation got a big relative overbought boost that is also currently being worked off.
So, as these stocks fall in the Beta Crash, when do you step in as a rational investor?
How much higher should the New Age – Post Covid Gorillas be valued. Their business models have been relatively benefited by the new Covid world. Should the premium of the high growth stocks over the general market stock be 20% compared to the 45% now? That seems cheap since growth in the new Covid future will be difficult for companies to achieve. Should it be 30%? 35% or is the current 45% okay? What do you think?
These are the questions that longer term investors should weigh deciding when to catch a falling knife to buy excellent growth companies during volatile markets.
The Gorillas bottom will give us the clue as to when other popular, previously overbought growth stocks will also bottom. They are interlinked.
When I see a tame economic backdrop, I’m looking at CCC Junk bond spreads continuing to narrow and leading economic indicators up. I see economically sensitive Materials and Industrial indexes hitting new highs last week as the Gorillas have been plunging for over two weeks. The economy is fine. It’s the Robinhood crowd that is being squeezed.
This could offer a good buying opportunity.
I would tend to agree with the Beta Crash thesis. We just have to wait for the technical and sentiment indicators to settle out and watch for a bottom.
Market is becoming unsettled over the possibility of turmoil over a possible unsettled election. In all likelihood, this means a market bottom in late October or some time in November.
A historical look at election years by Michael Santoli:
Investors could be overplaying the election as a lasting driver of the market
https://www.cnbc.com/2020/09/19/investors-could-be-overplaying-the-election-as-a-lasting-driver-of-the-stock-market-history-shows.html?__source=iosappshare%7Ccom.apple.UIKit.activity.Message
I just think this is an exceptional election year and the Ginsburg drama is going to cause so much uncertainty as to where the country is heading that it can’t help but effect the market negatively. I hope I am wrong but as Ingjiunn said in yesterday’s post, we’ll just have to see how it plays out and adjust accordingly.
It has started. Pelosi is treatening to impeach President Trump again if he even tries to appoint a new SCOTUS Justice for Ginsburg. I hope someone is looking for her lost marbles. LOL
Interesting tactic. Under the rules of impeachment the Senate needs to conduct a trial with all members present and no hearings to consider new justices can be held.
Gloves are off. For the markets this means no fiscal package and economy goes south. At least Pelosi said that she is open to a CR to keep the government running.
Cam,
‘No fiscal package and the economy goes south’ – questions about how long before it starts to affect the data, how much will be the impact in your opinion?
Why is it not getting reflected in the bond market?
Last nine daya the equities are in a range (choppy). VIX is not elevated. Earnings estimates are rising.
Mixed signals at best.
* Daya > days
I thought the Dems were launching an emergency investigation into Durham’s investigation. Also, did Pelosi said she is going to impeach Bill Barr? Now, impeach Trump, again?
I cannot imagine if Durham releases his results and couple high profile Dems get arrested. Don’t forget a potential October surprise to kick the vix up a little more. Oh no… Whatever happen to COVID19?
LOL I hope they try it, Mark. All of it! People will get tired of the democrats really quickly.
Let’s all try to focus on the market consequences of the political maneuvers, rather than turn this into a Trump or Biden support board.
Hey, I’ve been pretty good lately. We only have one more month to go (I hope).
This one month til election is so loaded with fireworks, it feels like a dog year (times 9). Also found Covid19, across the pond in England. Oh no..
Well if we are musing about how the market react to political outcomes…
Could the recent tech weakness (rotation into other sectors or w/e) be due to people expecting some sort of tech regulation to come in after the election?
Side musing, how come people are not talking about the Chinese econ much these days? (I know Cam did in the last post) It used to be all that people talked about earlier this year.
Could be. The Democrats have talked about breaking up Amazon, Google and Facebook. I don’t know if the Republicans will develop an appetite for that or not but I sure have.
😉
They would if they read this book from a few years ago!!
https://www.goodreads.com/book/show/37830765-ten-arguments-for-deleting-your-social-media-accounts-right-now
I’m reading it now…most fascinating.
The FANGS need to be de-fanged.
Should have put on a larger short Friday!!! LOL
Friday having been OpEx day the fibs have re-adjusted slightly. We opened at the new fib that was at Friday’s low then fell lower. Then next lower fib is now at 3210.
Make that next lower fib at 3216. The bad news is that after that fib there aren’t any until 3100 which is were the 200 dma is sitting.
Wow! We are only 14 S&P points from the 3216 fib. If we get there today do we bounce or power on through it?
The S&P has bounced up to a daily fib that offered some support after the open before being violated. We seem to be trying to bounce lower off this fib right now. Leading indicators indicate this resistance might fail.
The market is trying to bounce at the daily lows. I covered my short position even though I think it will break this low. The Semis and FANG ETF’s are bouncing, too, although the High Beta ETF is not. I’ll put my short back on after we bounce whether from here or from lower.
Market is back up to the daily fib that stopped the earlier rally. This time it is looking less formidable. It’s a long way up to the next weekly fib (high of the day) so we’ll just have to see what happens here. Friday’s close should provide heavy resistance if we can get there in the next day or so.
FANGS and NAZ trying to lead the market rally back.
FANGU down 0.12%
NAZ down 0.99%
S&P Down 1.89%
So far, higher highs and higher lows but very sideways looking. ST volume is constructive. 1:30 – 2:05 CDT should provide clues to the closing trend.
Buyers showed up just above the day’s lows. However, the volume isn’t very convincing yet. I will probably stand aside for the rest of the day and leave my long term portfolio longs unhedged.
https://quantifiableedges.com/is-the-weakest-week-still-weak-when-there-is-weakness-prior-to-the-weakest-week/
Can you repeat that ten times in a row?
Ah, I see what you did there, RX. We are supposed to repeat the title three times fast:
“Is the Weakest Week Still Weak When There is Weakness Prior to the Weakest Week”
Nice trade, Cam!
Taking Cam’s lead and opening a ST long on SPY @ 322.25. Small.
You’re more courageous than I am.
I made one truly courageous trade earlier in the day. TSLA – opened at 420 and closed at 436.
picked up TSLA this morning, holding until the battery announcement tomorrow. Counting on Elon the magic man. Using my best investment strategy, praying. haha
Mark, they have already been talking about the million mile battery on Fox today. (lasts for a million miles before replacement not charge once and goes a million miles. LOL)
Elon is better than David Copperfield.
‘Taking Cam’s lead’ should be read as following on the heels of his decision to tactically close his short position – ie, as far as I know, he has not made a call to go long (I think he’s simply waiting to reopen his short).
Catching falling knives is always a dangerous business.
I have the scars to prove it.
LOL. We all have a few of those.
Bounces have been really weak suddenly. SPY to maybe 325-6?
That sounds about right to me.
Right on target, Allan.
Good move on the SPY trade, RX. I was worried for you at about 1:30 PM CDT but the turn around was awesome.
Good call to cover shorts by Cam, too! Thanks Cam, it helped me decide to cover my short trade from late Friday.
UK, Israel and parts of Europe are experiencing a Covid resurgence and talking renewed lockdowns. This seems to be part of the reason the market is down so much today. We’ll probably have to wait until this afternoon to see if the decline continues or is shrugged off and markets rally.
Apparently Bloomburg has more reasons for the market selloff.
https://finance.yahoo.com/news/currencies-steady-early-trading-yuan-211203202.html?.tsrc=rss
I’ve closed out AAPL and AMZN as well (entries were undisclosed, but I don’t always have time when opening positions in a volatile session).
Opening a position in KBE (banks).
Not because I believe banks will do well – purely a bounce play. There’s sufficient panic to warrant a buy.
Out of SPY @ 325.2x.
On a side note – my wife and I purchased a number of silver Canadian Maple Leafs in November 2014 when silver was ~15/ounce. Last weekend, we discussed selling them today. Naturally, when I checked spot prices this morning they were down -8%! We’ll wait.
Patients, grasshopper.
lol
Cam- Thanks for this morning’s alert. Nailed it.
The market closed last night into some resistance. The new monthly fib is sitting right at S&P 3290 and we are sitting just above that number. On the upside we have the 50 dma at 3345 which looks formidable with daily lows at that level and the next fib at 3400. So, there is some room to move up if the buyers want to take it up there.
Cam issued a potential sell for today or tomorrow and we see the next lower fib still at 3216. Yesterday’s low was just above this fib by about 12 points or so.
The market just broke over a daily fib that had been the top bracket of fibs between today’s high and low. Leading indexes are looking mostly positive as is the light volume.
I think we try going higher first. We’ll just have to see how it behaves as it tries.
The S&P broke the high daily morning range fib but has since moved to the lower morning range daily fib. Volume, leading indexes and action indicate that we may break that lower fib. I rarely buy or sell around these early daily fibs because they can be broken so easily.
We popped under the lower range fib then rallied back to it. I’ve taken a small short position here even though the odds are not tremendous. Everything is looking lower though.
After starting out in the right direction, the S&P popped back into the morning range fibs and I covered my short for now.
What’s the old saying? “Never Sell A Dull Market” And this market is getting dull.
Patience grasshopper… 🙂
Beat me to it.
LOL
Stuck between these morning fibs. Maybe the strongish Semis and Amazon will break us out and up.
S&P tagged the high from this morning. Will make a small buy if it pulls back a little looking for a move to the 50 dma.
Filled but had to chase it a bit.
No Mo. Tight stop taken out. Having Internet problems today so I’m done for the day.
Now we start making new daily highs. Figures.
The market just ran into a daily fib that is giving it a little pause. I think we power through this fib.
The market couldn’t get past that fib and stay there. Daytraders settling up their long trades came in with some selling in the last 10 minutes.
Taking a swing at another RT in SPXU. Playing the short side with a short leash today.
The only long setup that looks interesting is the long bond. Waiting for a decent entry.
All right! Good to see my faith in Cam has been rewarded.
Seriously, I think the next big move is down, not up.
The market is trading between the daily fibs this morning. The dog goes to the vet this afternoon so I may not be able to enter positions later.
Bought SPXL at 50.15 looking for about 51.00 with a tight stop if it breaks. Leading indicators are weak.
Not this time. Stopped out.
Leading indexes are improving and volume has very slightly improved. But no trade since the lower daily fib was violated.
Weekly near targets would be lower fib at 3290 and higher 50 dma at 3350. Tuesday’s high would also be an important point to watch on a rally which also is a daily fib.
Probably a good place to get on board Cams short on the little bounce back up to 3300.
That was prescient.
Guess I scheduled the wrong day to take the dog to the vet. I missed the entire decline.
Not much support around the 3290 weekly fib. Bounces should be sold. Yesterday’s low at 3270 may offer a bounce and the next stop would be 3216.
Looks like the weakest week is headed for a weak week despite heading into this week with a series of weak weeks.
Closing the second RT in SPXU here.
Interactive brokers has raised margin requirements. This thing is moving too much by the book. The moves on the downside are too orderly. Even VIX index is on the relatively tame side.
Watching gold here around 1550-1750, for opening fresh positions.
Dividend paying stocks are looking interesting, but not buying yet.
RYT and other equal weighted Tech may be better buys than QQQ for those underinvested in Tech.
Same for EWCO for longer term positions. Not buying yet. Watching 3210 on the S&P 500. Next pit stop 3020 and then 2700, give or take.
October usually has a reputation to be a ‘bear slayer” that said, may be not so fast, this year, as Corona pandemic is not abating.