Preface: Explaining our market timing models
We maintain several market timing models, each with differing time horizons. The “Ultimate Market Timing Model” is a long-term market timing model based on the research outlined in our post, Building the ultimate market timing model. This model tends to generate only a handful of signals each decade.
The Trend Asset Allocation Model is an asset allocation model which applies trend following principles based on the inputs of global stock and commodity price. This model has a shorter time horizon and tends to turn over about 4-6 times a year. In essence, it seeks to answer the question, “Is the trend in the global economy expansion (bullish) or contraction (bearish)?”
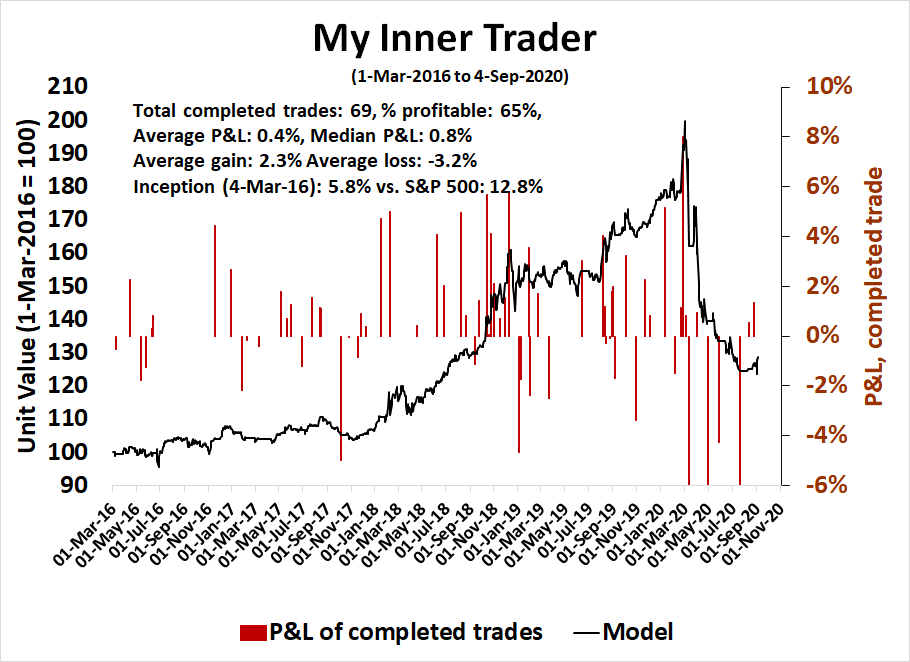
My inner trader uses a trading model, which is a blend of price momentum (is the Trend Model becoming more bullish, or bearish?) and overbought/oversold extremes (don’t buy if the trend is overbought, and vice versa). Subscribers receive real-time alerts of model changes, and a hypothetical trading record of the those email alerts are updated weekly here. The hypothetical trading record of the trading model of the real-time alerts that began in March 2016 is shown below.
The latest signals of each model are as follows:
- Ultimate market timing model: Sell equities
- Trend Model signal: Neutral
- Trading model: Bearish
Update schedule: I generally update model readings on my site on weekends and tweet mid-week observations at @humblestudent. Subscribers receive real-time alerts of trading model changes, and a hypothetical trading record of the those email alerts is shown here.
Subscribers can access the latest signal in real-time here.
Why Are VIX and S&P 500 Moving Together?
Something odd is happening in the equity option market.
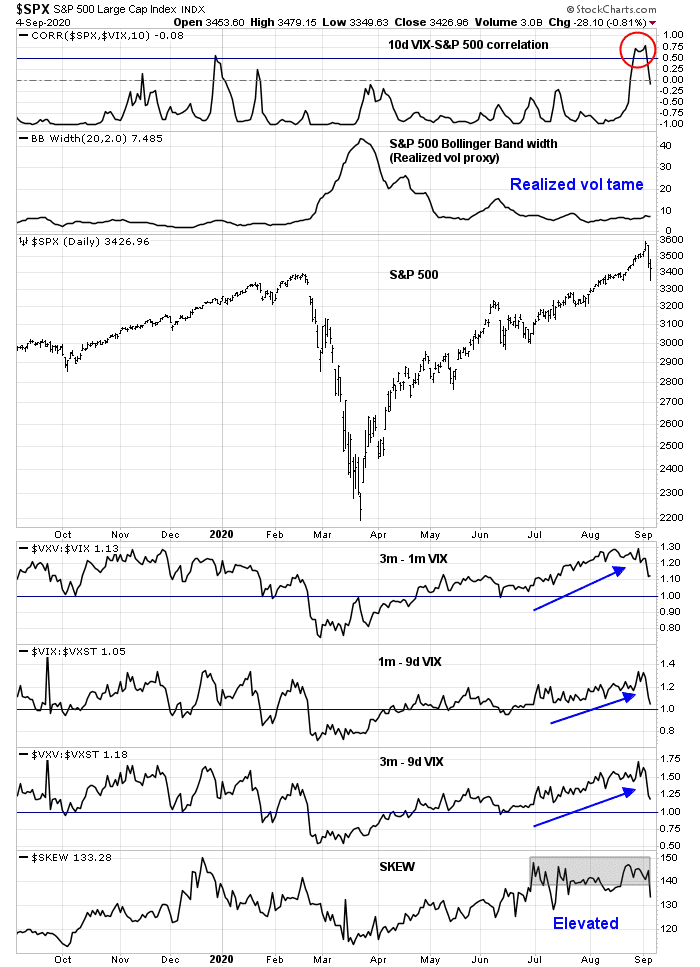
- Until the market sold off last Thursday, the VIX and S&P 500 had been rising together. The 10-day correlation of the VIX and SPX spiked to over 0.7, which is highly unusual as the two indices tend to be negatively correlated with each other (top panel).
- The rise in implied volatility, as measured by the VIX Index, was not matched by rising realized volatility. The second panel in the chart below shows the width of the SPX Bollinger Band as a proxy for implied volatility, which has been tame.
- Until the market sold off last Thursday, the term structure of the VIX was steeply upwards sloping. The spread between 9-day, 1-month, and 3-month implied volatility was uniformly high by historical standards.
- The SKEW Index, which measures the price of hedging tail-risk, was also elevated.
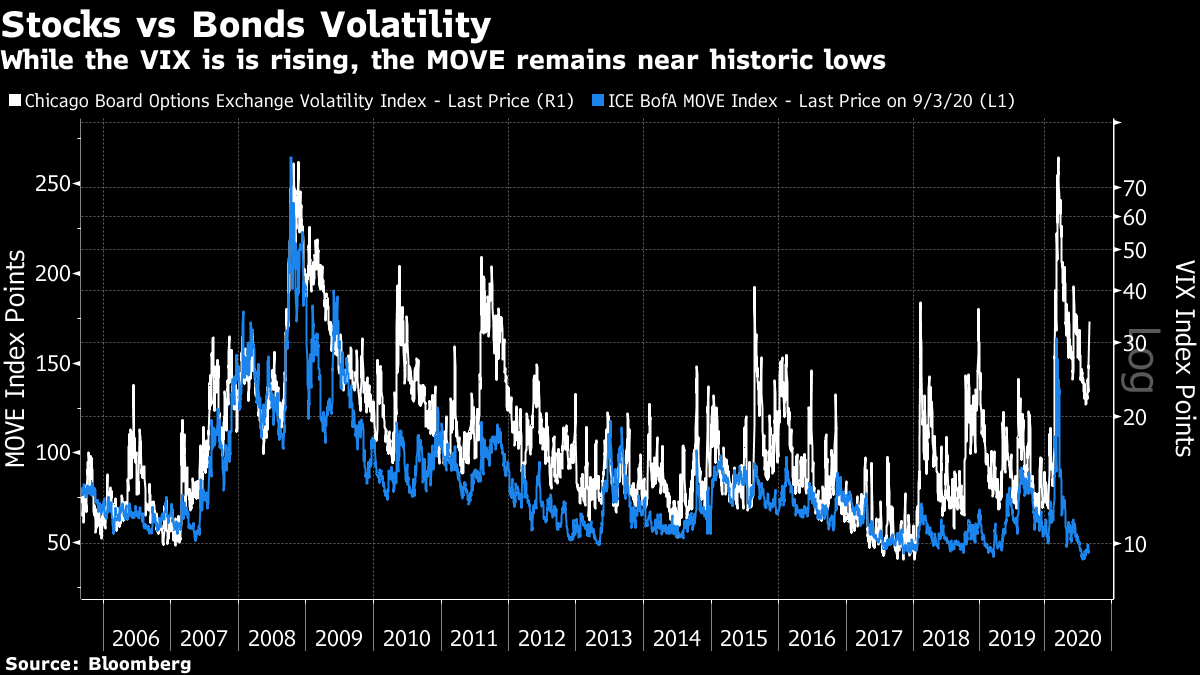
Equally puzzling is the disconnect between stock and bond implied volatility. While stock volatility has surged, bond market volatility remains tame. What’s going on?
Historically, high correlations between SPX and VIX have usually led to market sell-offs. Under a minority of circumstances, they have also signaled market melt-ups. How can we explain these unusual conditions in the option market?
Election jitters
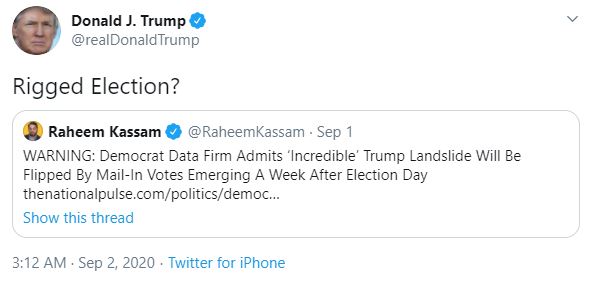
I present two explanations for the option market anomaly, which are not mutually exclusive. The Financial Times pointed out the market is pricing in an exceptionally pronounced volatility surge around the US election in early November in anticipation of electoral chaos.

Axios reported that a Mike Bloomberg backed polling firm is warning of potential electoral chaos on election night.
A top Democratic data and analytics firm told “Axios on HBO” it’s highly likely that President Trump will appear to have won — potentially in a landslide — on election night, even if he ultimately loses when all the votes are counted.
Way more Democrats will vote by mail than Republicans, due to fears of the coronavirus, and it will take days if not weeks to tally these. This means Trump, thanks to Republicans doing almost all of their voting in person, could hold big electoral college and popular vote leads on election night.
This scenario has the potential to spark uncertainty an order of magnitude higher than the 2000 Bush-Gore hanging chad Florida electoral controversy.
Hawkfish CEO Josh Mendelsohn calls the scenario a “red mirage.”
- “We are sounding an alarm and saying that this is a very real possibility, that the data is going to show on election night an incredible victory for Donald Trump,” he said.
- “When every legitimate vote is tallied and we get to that final day, which will be some day after Election Day, it will in fact show that what happened on election night was exactly that, a mirage,” Mendelsohn said. “It looked like Donald Trump was in the lead and he fundamentally was not when every ballot gets counted.”
President Trump is already tweeted to alert his supporters about that possibility. A closely contested election with results that are not trusted by one side could spark protests and counter-protests all over the country. The events in Portland and Kenosha are just a preview. Imagine multiplying them by 10, or 100 as armed protesters from both sides flood the streets.
This is hardly a scenario promoted by the radical fringe. Even The Economist devoted an entire issue to this subject.
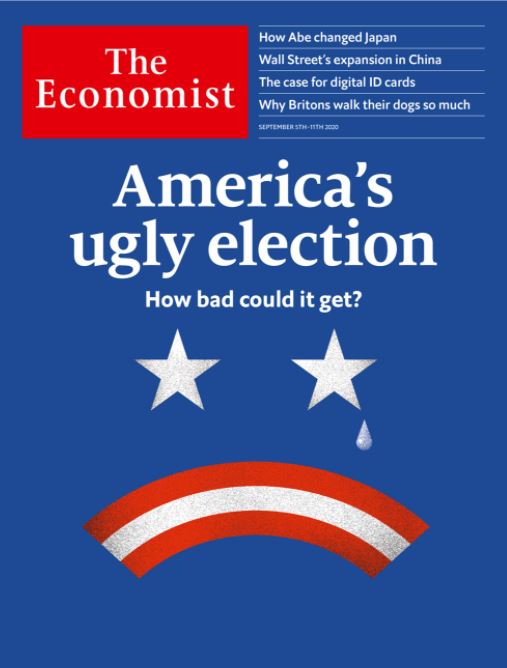
Are civil wars bullish? Is it any wonder why volatility premiums are elevated around the time of the election?
The Softbank NASDAQ ramp
A shorter term explanation for the dual rise in stock prices and implied volatility is the gamma chase by dealers. The perennially bearish website Zero Hedge reported that Nomura’s cross-asset analyst Charlie McElligott found that there has been a very large buyer of technology stock call options, to the tune of over $1 billion in option premiums.
Over the past few weeks, there has been a massive buyer in the market of Technology upside calls and call spreads across a basket of names including ADBE, AMZN, FB, CRM, MSFT, GOOGL, and NFLX. Over $1 billion of premium was spent and upwards of $20 billion in notional through strike – this is arguably some of the largest single stock-flow we’ve seen in years. “The average daily options contracts traded in NDX stocks to rise from ~4mm/day average in April to ~5.5mm/day average in August (a 38% jump in volume).
As the street got trapped being short vol, other names in the basket saw 3-4 standard deviation moves higher as well – on Wednesday FB rallied 8% (a 3 standard deviation move), NFLX rallied 11% (a 4 standard deviation move), and ADBE rallied 9% (a 3 standard deviation move).
The most natural place to hedge being short single name Tech volatility is through buying NDX volatility. As such, there has been a flood of NDX volatility buyers with NDX vols up about 4 vol points in 2 trading days. And if NDX volatility is going up, SPX volatility/VIX will eventually go up too.”
Dealers became net short as this very large buyer came into the market. Consequently, market makers had to buy the underlying shares in order to hedge their position, which sparked a bullish stampede and NASDAQ melt-up. Zero Hedge concluded:
Putting it all together, we find that a combination of market euphoria, free options trading, and most importantly, few market-makers have sparked the fire. It also means that “a few large hedge funds understood this and have added fuel to the fire by pushing implied higher and higher and putting further pressure on the likes of Citadel and Goldman. With this process helping drive names like Apple and Tesla, this also makes sense why Breadth has been so terrible.
The Financial Times subsequently identified the large buyer as Softbank. Softbank spent roughly $4 billion in call option premiums to control $50 billion of equity assets. The purchases appears to have sparked a bullish stampede. SentimenTrader pointed out that the retail small option buyers continued to pile into their bullish bets despite the late week sell-off.

Maybe some reasons for the market swoon last Thursday was the disappearance of Softbank buying, or just buyer exhaustion.
The NASDAQ wobbles
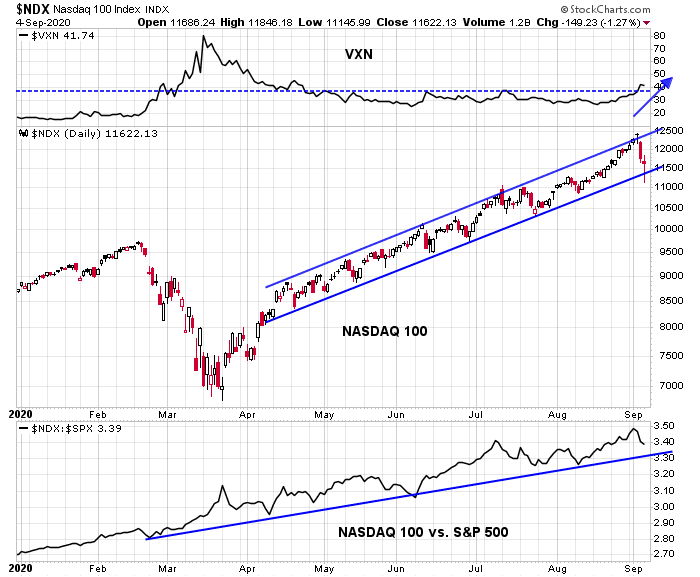
We can observe the footprints of the call option buyers in the price action of the NASDAQ 100 (NDX) and VXN, which is the implied volatility of the NDX. VXN (top panel) had been basing and began to rise in lockstep with NDX. VXN then went on to stage an upside breakout out of its multi-month base, indicating a possible volatility storm ahead. From a technical perspective, NDX remains in a rising channel, and the relative performance of NDX is still in a relative uptrend. Until we see downside breaks in those trend lines, traders should not turn bearish.
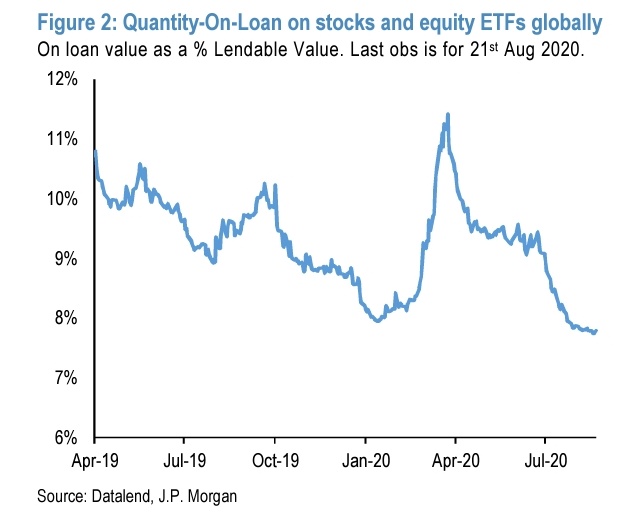
Should we see downside technical breaks, downside risk could be considerable. Analysis from JPMorgan reveals that market participants have completely unwound their equity short positions from March. Short interest is extremely low, and there is little buying support from short covering should stock prices take a tumble.
More volatility ahead
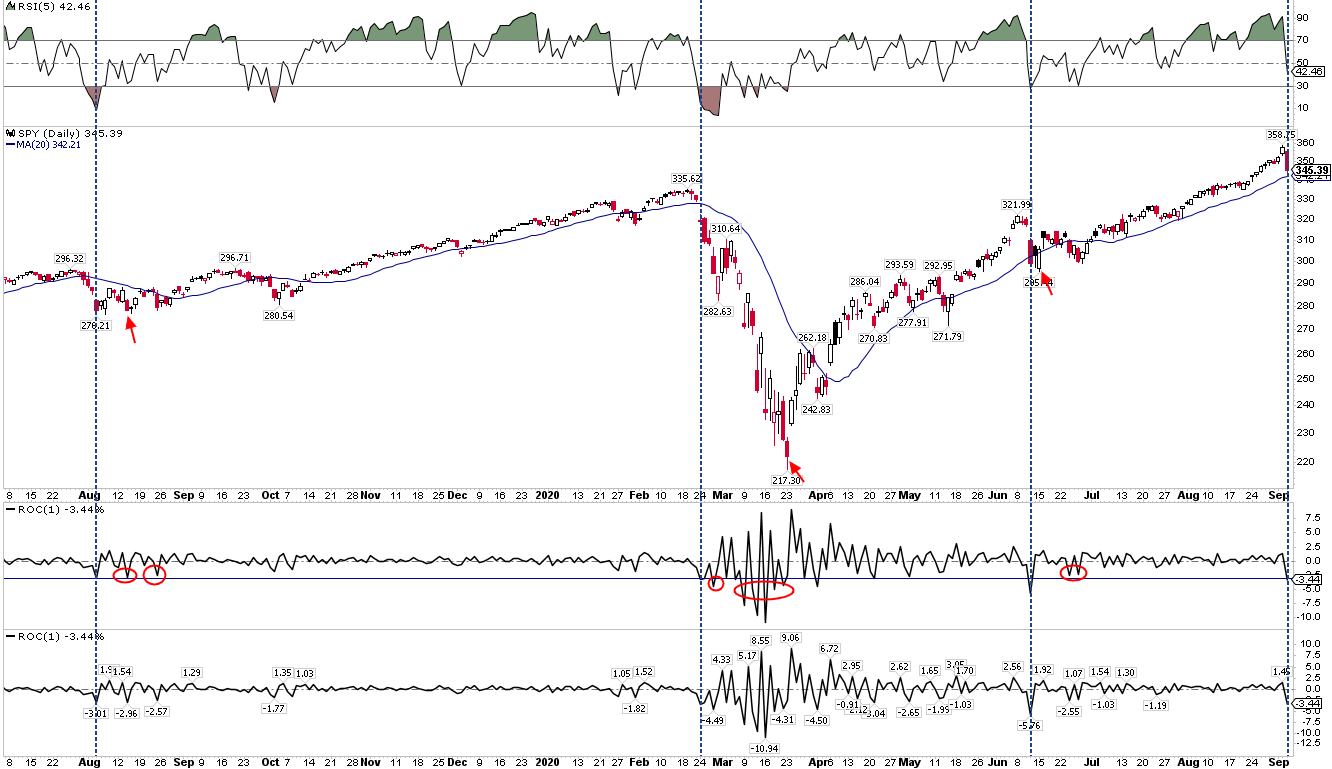
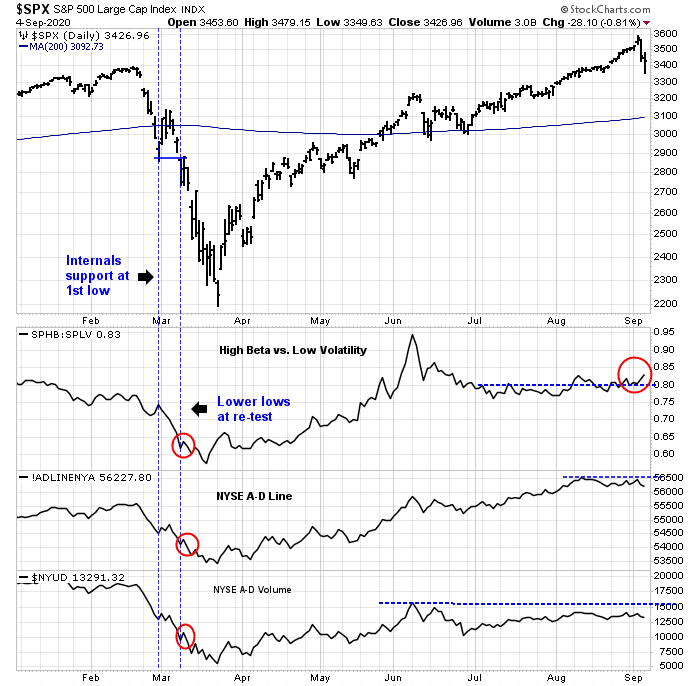
Tactically, where do we go from here? Is this just a brief pullback, or the start of a major correction? The blogger Urban Carmel observed that when the S&P 500 falls -3% or more, such downdrafts tend to occur in clusters, and the first one from a high doesn’t mark the initial low, and such strong down momentum typically followed by a lower close in the day or two. In the last year, there were two bounce and successful re-tests of the lows, and one market plunge.
What’s the likely outcome? Market internals are deceptive. my high beta to low volatility equity risk appetite indicator is flashing a risk-on signal, but it flashed a similar signal at the bottom of the initial market plunge in March. We are likely to see some sort of short-term bounce early next week, as the market is sufficiently oversold to warrant a relief rally. I am watching the behavior of this indicator, as well as breadth metrics such as the Advance-Decline Line and Volume, for signs of either a positive or negative divergence on the re-test before declaring a bullish or bearish verdict.
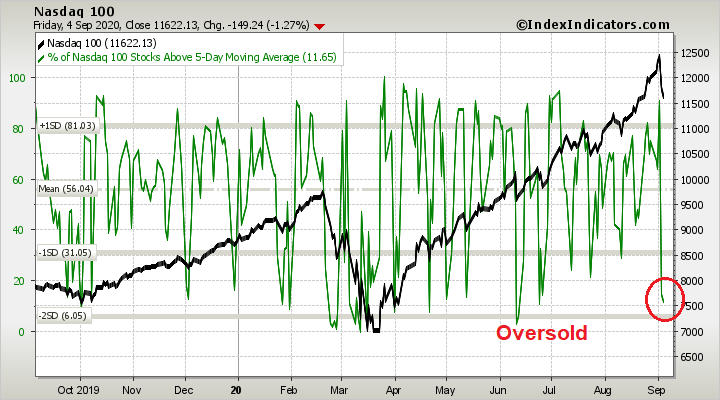
Short-term momentum presents a mixed picture. The percentage of stocks in the NASDAQ 100 above their 5 dma is oversold. As NASDAQ stocks have been the tail that wag the dog market leaders, the market is ripe for a bounce early next week.
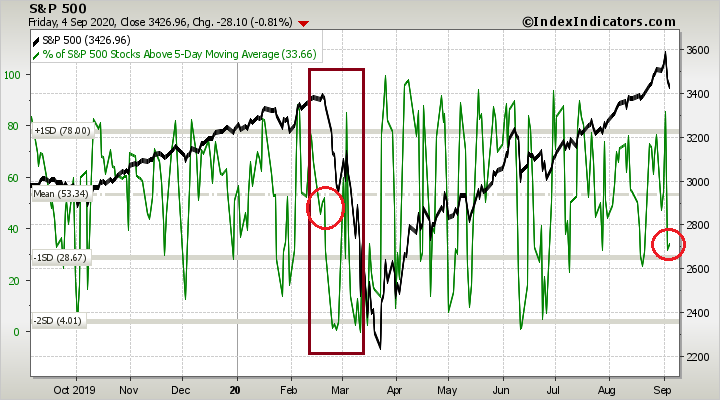
On the other hand, traders have to be aware of the possibility that this is just the start of a major downdraft. The percentage of S&P 500 stocks above their 5 dma is not oversold, and the pattern has eerie parallels to the major market decline in March.
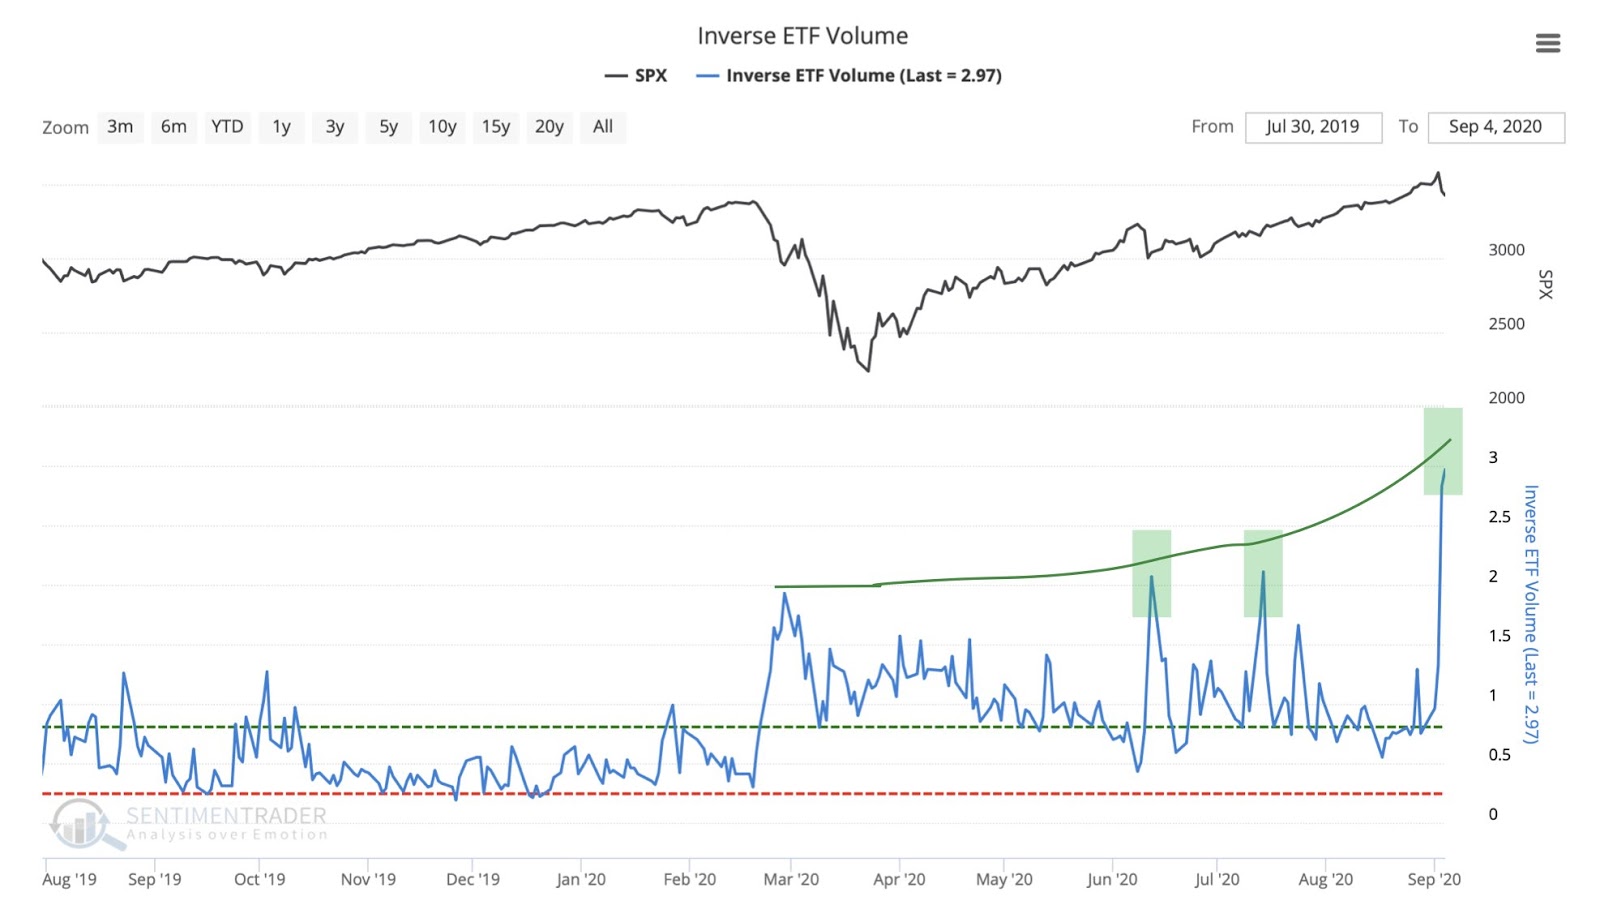
Sentiment is extremely jittery. Retail traders piled into inverse ETFs late last week. While this is contrarian bullish, it’s difficult to believe that the wild speculative frenzy of the past few weeks could be unwound in two days. Be prepared for more volatility.
In conclusion, there are both short and medium term catalysts for a market volatility storm. Traders should expect heightened volatility and risk premium compression between now and Inauguration Day. Hopefully, any electoral chaos should be settled by then.
Disclosure: Long SPXU
Cam
How do Portfolio managers hedge for such downside volatility? One way would be to raise cash, that carries with it its own set of consequences.
Another would be using options. For a Professional money manager, how much does it cost, using options, to protect 1 million $s for a 25% loss?
I am a novice when it comes to using options. It would help lesser mortals like me, if someone could answer my question with actual options, with expiration dates etc. Thanks.
A call option gives the buyer the right (not the obligation) to buy a stock at a certain price up to an expiry date. A put option gives the buyer the right (not the obligation) to sell a stock at a certain price up to an expiry date. Example:
SPY is trading at 342.60
Let’s look at the standard September call option which expires third Friday of the month on the 18th
Sep 344 (exercise price) calls trade at 5.37
Sep 344 puts at 8.40
Sep 341 calls at 7.35
Sep 341 puts at 7.10
A bullish speculative investor could buy the Sep 344 calls hoping the market rises. If he does the leverage on his P&L is significant.
A conservative investor who owns a SPY position could sell the call to get some income, but cap his upside.
A speculative bearish investor could buy a put hoping the market falls, with significant leverage.
A conservative investor who owns SPY could buy the put as downside insurance.
A bullish investor could sell the put hoping to get some income. That’s call a naked put. The P&L position is equivalent to long stock, short call.
To protect $1 million position for a 25% loss, it depends on what the long position is, as the price of the option is a function of its perceived volatility. The price of TSLA options is going to be enormous, compared to something boring like PG. You can play around at the CBOE site and get quotes to get an idea.
http://www.cboe.com/delayedquote/quote-table
“To protect $1 million position for a 25% loss, it depends on what the long position is”
The above question pertains to hedging 1 million $ SPY against 25% loss. Thanks so much.
1. Would professionals look to use September, October or November expiration options as a series or is it better just to use say only November options?
2. Is it better to sell calls or buy puts if one is bearish? What is the difference between the two (sell calls or buy puts), or are they the same?
3. How any options would one need is the question I asked? It is easy to calculate the answer using futures. Since options have a time integral function, I do not know how to calculate the value, if let us say SPY were to correct say 25%, 10, 5, 1 day before option expiration. Thanks for your help.
How *many* options would one need is the question I asked? Because of the time integral function, the value would change @ 10, 5 and 1 day before the expiration (and presumably plateau). But, what would be those values/prices?
Most professionals would actually not hedge. Typical mandates are to beat their benchmark, eg S&P 500, and they’re not focused on absolute return.
Of the ones who would hedge, the usual response is to shift into bonds. Few would use options because it’s not part of their mandate.
Given that background I was a PM with the flexibility to use options I would sell call options here to take advantage of the high volatility and fat premiums. Remember I just have to beat my benchmark and competitors, and focus less on absolute return
OK, thanks.
So, if S&P 500 were to lose 30%, a PM would still beat the market if they had sold call options before the loss? Makes sense.
D.V. Maybe you are thinking back to the times I indicated I was hedging my longs. I was doing that because the money in our 401K only offers certain investment funds for the bulk of the portfolio. I am restricted from moving in and out of the main funds without waiting 60 or 90 days.
So, in order to go to cash what I do is buy a multiple inverse fund that mirrors the funds I am in. I can do this in a brokerage account that is attached to the 401K and is a part of it. That essentially lets me zero out my 401K by having opposite positions.
I hope that helps you understand what I was doing when I was saying I was going to “hedge” my long positions.
I have used variety of tactics to hedge with varying outcomes:
1. Use SPX options instead of SPY. Need fewer contracts.
Portfolio value / SPX value * 100 = no. Of option contracts needed. 1 million/( 3427 * 100) = 3 contracts
Sept at money put option – $71. Premium = 71*3*100 = 21,300 or 2.1% of portfolio value.
Challenge: can’t do it again and again. When to take profits?
2. Going out to October, and capping downside at 2400, cost would be roughly $32,000!!
Same challenges.
2. Using Cam’s example, sell calls against SPY you hold and use the premium to buy suitable puts.
Low cost but give up potential upside.
3. Buy VIX call spreads
4. Trim long holdings
These are all variations of ‘market timing’ ideas.
Cam’s experience is managing OPM. My decisions impacted me directly and immediately.
Usual caveat: not investment advice. No guarantee of results. Just my experiences.
Thanks Ravindra. This helps.
Today, SPX dropped 95 points. Put option gained 42 points. Not a perfect hedge $ for $ due to cost of the put. If SPX continues to drop Vega and gamma start to help more.
Just FYI for fun.
I am not a manager, but below is what I have used before.
1. Stability breeds instability. The best time to hedge is during long run up when everyone is piling in. Put options are cheap., and not many are hedging.
2. When volatility is going up, like now. When this happens it will naturally attract or force people to hedge. Now put/call premium is higher. You can use collar (sell call and buy put) or put spread (higher price buy and lower price sell) to reduce the hedging expense.
As individual trader/investor I don’t have the luxury of OPM (other people’s money) and relative return so I calculate the cost very rigorously. I need to be in positive territory most of the time.
So now I don’t buy hedge, but I sell hedges (Levi Strauss selling jeans) frequently and let time to expiration and market makers be my friend. This way you can make money even while in sleep. Some management is required but it can be automated.This is where I have my reserve capital. Some to buy stocks to hold at reasonable price and some to pay bills and some just sitting there.
Holding good stocks riding secular trends probably beats 99% of the other strategies and the return can be staggering. Most small investors don’t have a system and don’t put in enough efforts and time to be long-term successful. So hedging is a waste of money.
For a tried and true no-brainer strategy, you can buy stocks of mature good companies with a good buyback program. For example TXN, ADI, HD, ADBE, … and many more.
So selling calls and pocketing the premium is a better idea.
So, why did the stock market stop falling on March 23rd 2020? Were there reasons that stopped the correction?
D.V. , you only asking the 64 million dollar question. LOL Here is what I THINK happened. First, enough investors thought the market got oversold enough for a bounce to occur.
Then as it bounced more investors, maybe Robinhood types at first, concluded that it might be a good place to start moving some money back into the market.
Then other investors started looking over the gulf of the pandemic to an economic rebound in 2021 and move more money into the market. Then as some data came in more and more investors looked across that gulf and started moving money in. It also helped that Congress passed the stimulus and the Fed was pumping like craze and that money had to go somewhere.
So, it started with an oversold bounce and fed upon itself because investors became flush with cash and decided to jump on board.
Can we use any of this to identify when it will happen again? Maybe – maybe not.
“Dealers became net short as this very large buyer came into the market. Consequently, market makers had to buy the underlying shares in order to hedge their position, which sparked a bullish stampede and NASDAQ melt-up”.
The last few hours on Friday was interesting in the light of the above. The market rallied to 3450 and closed in the Futures market at 3413. I got stopped out my SPXU position at 8.20, only to see the market turn up right at 8.20 (this is pretty much my luck).
Wally, will probably identify/sympathize with me on this trade set up.
Softbank was probably active in the last hour or so on Friday. As soon as the market closed at 4 PM EST, S&P 500 futures collapsed. Check the graphs.
LOL D.V. I’ve mostly been so confused on where this market is going both short and long term that yes. I can both identify and sympathize with you on your trade.
https://www.cnbc.com/video/2020/09/04/traders-break-down-this-weeks-wild-market-action-via-the-options-pit.html
There are significant clues that we may may be peering into some unprecedented volatility. This video is echoing the same sentiment as Cam. See the part of the video that talks about a 2 day NDX loss of 10%, after a 50% rise.
Cam brought up the theory being pushed by the left that Trump widely wins the vote on election night and Biden comes back from mail-in ballots to over take Trump’s lead.
It seems to me that this theory is an attempt to string out and soften the blow to Biden supporters when they fail to win the election in the end. If the theory they propose even comes close to happening the lawsuits and ballot challenges will last until 2022 and will destroy this country. The House Speaker, and who knows who that might be in January, would take control of the Presidency on January 20th until and if the Presidential balloting is ever settled.
If you believe that God cares about the United State of America I suggest you start prying now that such an election nightmare never happens.
Praying not prying!!! Geez, Wally!
Actually it would be the President Pro Tem of the Senate who would be President if the election results aren’t known. The Speaker of the House would not be known as the House elections would not be known.
Since there are more Republicans than Democrats up for election in the Senate, there would be more Democratic Senators than Republicans not up for election, it would be a Democrat who becomes President.
I thought the Contingent Election procedure dictates the House vote for president and the Senate chooses the VP.
Each state has only 1 vote.
But what if the House members aren’t known?
Even if the President isn’t known, many, if not all, House seats will have been decided.
The vote counting process is the same. If you can’t trust the integrity of the presidential ballots, how can you trust the votes for Senate and House?
Tue enough, Cam.
The election is going to be decided in a handful of States. Does anyone think California, NY, NJ, Il are going to vote republican OR Texas, Ga, Al, and other southern States going to vote Democratic? I doubt that it will take till after Jan. 20 to settle the issue of mail in ballots. There will be controversy and MSM will hyperventilate. In the end, we will move on.
The real question before us is what kind of future do we want? Socialism( or some version of it) or capitalism with major overhauls to provide equal opportunity and access to everyone? I think Americans will shy away from Socialism. This is what I am counting on.
If the options buyer was Softbank, it is likely that they have been buying Sep to Oct calls.
In the past few months, October VIX has been consistently high compared to other expiration months and Oct expiration has nothing to do with election.
http://vixcentral.com/
(check historical prices)
If SB get nervous they could start to unwind their position to create a big downward pressure, but historically speaking SB is a very bullish investor. I have a feeling that they might even try to buy the dip.
SB is long gone. They made their money and are hands off now. The ZH article stems from SB’s June report revealing they are into derivative trading and in fact an investment house now. This is not the old SB any more.
Masa san commit some fisacos in WeWrok and ARM holdings. SB got too much investors’ money and not enough ideas to invest on. So the last resort is to become an investment house and speculate.
They likely induced copycats to do trend following: some big money plus small guys. Most of the calls got cleaned up Thu and Fri by dealers. Same thing happened back in June. I suspected they are already doing the same thing back then. But this time it is too obvious because market is already too high up there. Most of the players are already sitting on the fence. Some systematic algos are likely the last trend followers who got blown up Thu and Fri.
Some of you may be trading the news headlines (which is mostly meaningless by the time you read it) instead of the data which is confirming bullish moves in many ways, you’ll just have to identify them. There are at least 3 ways (and many more), at least these 3 are bullish for now. I have posted charts earlier about market internals, the advances over a threshold while price has not crashed – that is bullish as confirmed by the strategy models. The second is the chart link below, the $VIX model. You can write a one line strategy code that had you executed since mid-March, it would have netted you 43% with a 11% maximum drawdown, with no losses. That strategy has an annualized Sharpe ratio of 6.17 and have these entry dates in common: 3/18/20, 4/23/20, 6/15/20 and it will buy on open on 9/8/20 (don’t just follow this trade, do your own analysis and stop losses). The third method is a relative strength strategy using consumer discretionary to $NDX which also confirmed $NDX is likely to advance. All these could change of course, but nothing from the data last week suggests the bulls can’t go on. If however should the data changed in the coming days, be prepared to have a bearish model that can accommodate and confirm your trades.
Method2 $VIX model https://i.imgur.com/eFOXuRo.png
Method1 market internal model: https://i.imgur.com/0qXyCX5.png
Are civil wars bullish? After recent events I wouldn’t count Jerome out on pumping the market to all time highs. 🙂
If there is a civil war, the last thing I worried about is my portfolio. It is always the innocent that get hurt the most.
Cam, thanks for the article. My question is why short SPX when QQQ big names have been driving the market. Why not short QQQ?
You could short QQQ. It was down 10% from the peak in the recent pull back.
https://www.yahoo.com/finance/news/nasdaq-whale-theory-tech-stock-150545049.html
He said institutions tend to use strategies such as buying a call spread and selling the underlying shares — a technique to profit from a rally, but also limit risk.
“These transactions themselves did not represent meaningful buying pressure,” Eifert wrote on Twitter. The call spread trades did contribute to the curious phenomenon of the S&P 500 Index rising at the same time as VIX Index, he added”.
Does this sound right, why VIX is rising, with the market?
Luckily volatility begins to have influence on the market. Hopefully the pullback will endure more than couple of days.
It appears that the stock market is back in sync with Mr. Hui. It’s about time!
My original plan was to sell into a bounce and move the proceeds back into the long bond (which I had hoped would see a continuation of Friday’s selloff).
That was Plan A.
Plan B->to be honest, I’m unable to come up with one that I like. The fact that I’m sized relatively small (~17%) doesn’t insulate me from significant pain should markets continue to pull back hard (let’s say 10% or more).
Which leads me to my default Plan C->liquidate assets and move to cash.
Indexes are on or close to their 50 dma. I moved another 10% of LT portfolio into S&P index at the close
I have just sell my shorts and buy initial position in long side – for today – expecting bounce for 1-2 days.
sold (sorry for mistake)
The indicies seem to me sleepy, therefore I decided to sell my long position and stay out of any position.