Preface: Explaining our market timing models
We maintain several market timing models, each with differing time horizons. The “Ultimate Market Timing Model” is a long-term market timing model based on the research outlined in our post, Building the ultimate market timing model. This model tends to generate only a handful of signals each decade.
The Trend Asset Allocation Model is an asset allocation model which applies trend following principles based on the inputs of global stock and commodity price. This model has a shorter time horizon and tends to turn over about 4-6 times a year. In essence, it seeks to answer the question, “Is the trend in the global economy expansion (bullish) or contraction (bearish)?”
My inner trader uses a trading model, which is a blend of price momentum (is the Trend Model becoming more bullish, or bearish?) and overbought/oversold extremes (don’t buy if the trend is overbought, and vice versa). Subscribers receive real-time alerts of model changes, and a hypothetical trading record of the those email alerts are updated weekly here. The hypothetical trading record of the trading model of the real-time alerts that began in March 2016 is shown below.

The latest signals of each model are as follows:
- Ultimate market timing model: Sell equities
- Trend Model signal: Neutral
- Trading model: Bearish
Update schedule: I generally update model readings on my site on weekends and tweet mid-week observations at @humblestudent. Subscribers receive real-time alerts of trading model changes, and a hypothetical trading record of the those email alerts is shown here.
Subscribers can access the latest signal in real-time here.
An unusual correlation
An unusual condition has occurred in the last week, as both stock prices and the VIX Index have been rising together. The VIX has been making a saucer bottom, which could be setting up for a volatility surge, and lower stock prices. While past episodes of high correlation have resolved in short or medium term pullbacks, there have been other occasions, such as late 2017, when these signals marked market melt-ups.
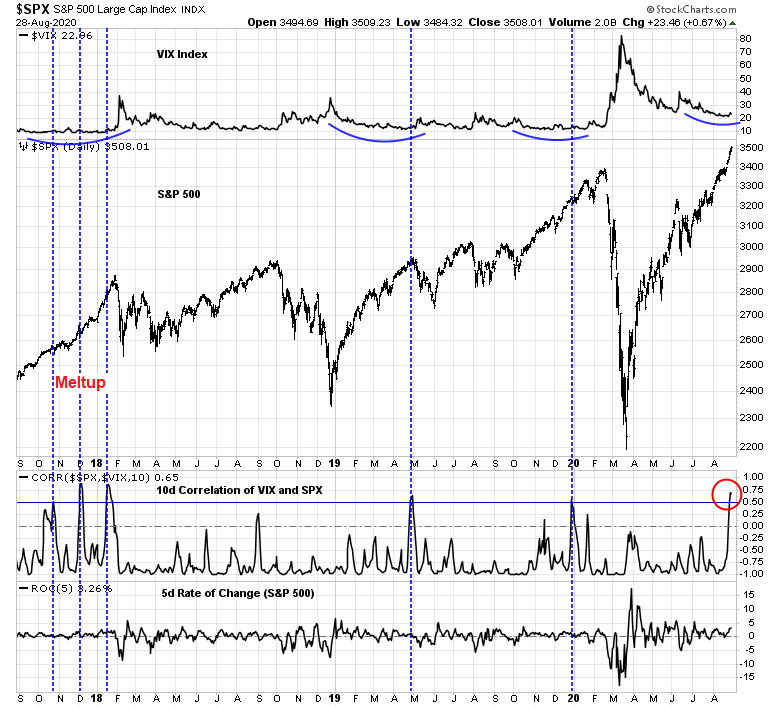
Are we poised for a Volmageddon, or a market melt-up?
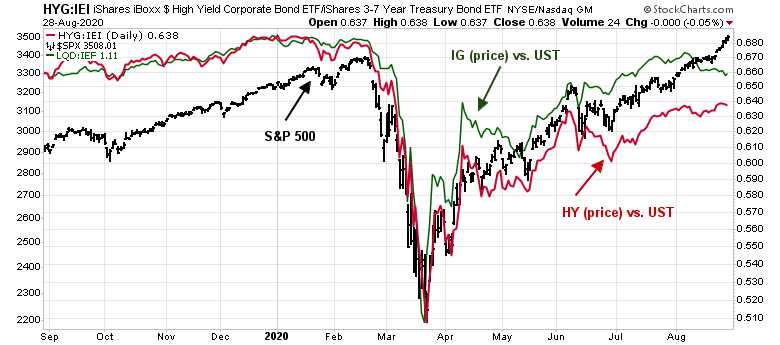
An extended market
Let’s consider the evidence. There are plenty of warnings of an extended market. I have pointed out before how the price performance of high yield (junk) bonds relative to their duration-adjusted Treasury prices have not confirmed the stock market rally (red line). Now investment grade bonds (green line) are flashing a similar negative divergence. Credit market and stock market risk appetites are in disagreement. Usually, the bond market turns out to be right.
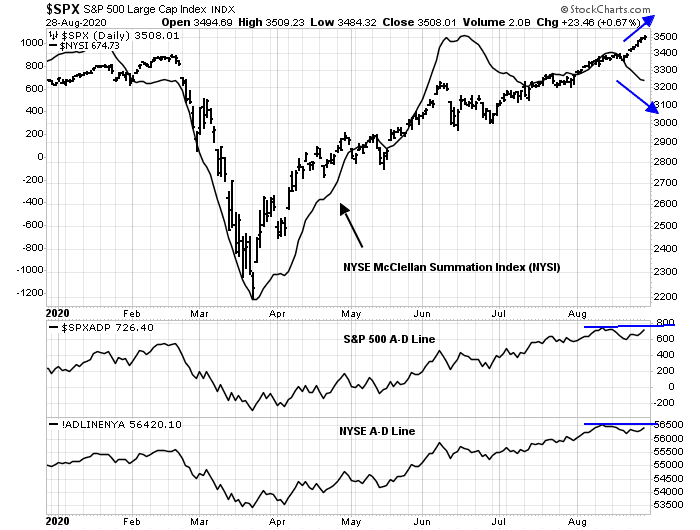
Equity market breadth is also not buying into the market advance, as there are numerous negative divergences.
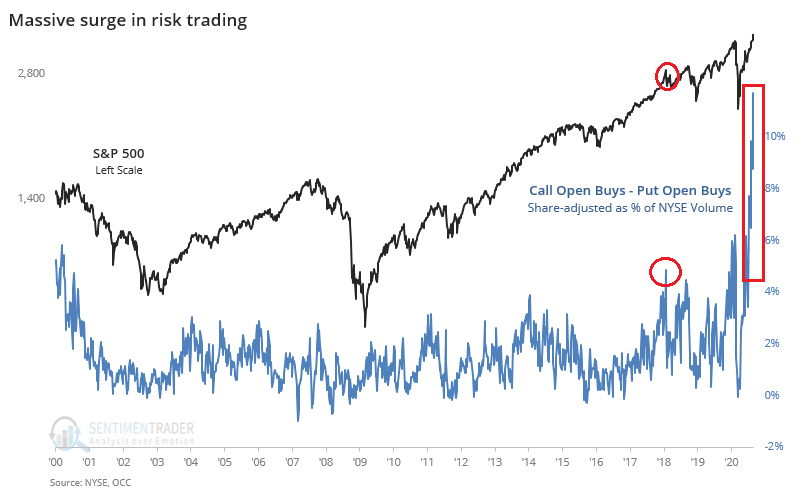
Sentiment is becoming stretched and overly bullish, which is contrarian bearish. SentimenTrader pointed out that call to put volume trading reached all-time highs last week, and conditions far exceeded the levels seen at the 2018 melt-up highs (annotations are mine). He characterized current conditions as a “combustible combo of musical chairs, Russian roulette, and five finger fillet”.
That said, while sentiment models can warn of elevated risk conditions, they don’t necessarily represent actionable sell signals. The Investors Intelligence sentiment survey shows that bears (blue line) have capitulated to late 2017 levels, and the bull-bear spread have similar crowded long readings. However, this did not prevent the market from marching upward until it reached its January 2018 blow-off highs.

Strong momentum
There are signs that the market is undergoing a momentum driven melt-up. The S&P 500 experienced a seven day winning streak, and Steve Deppe found that such winning streaks combined with all-time highs have tended to be bullish.
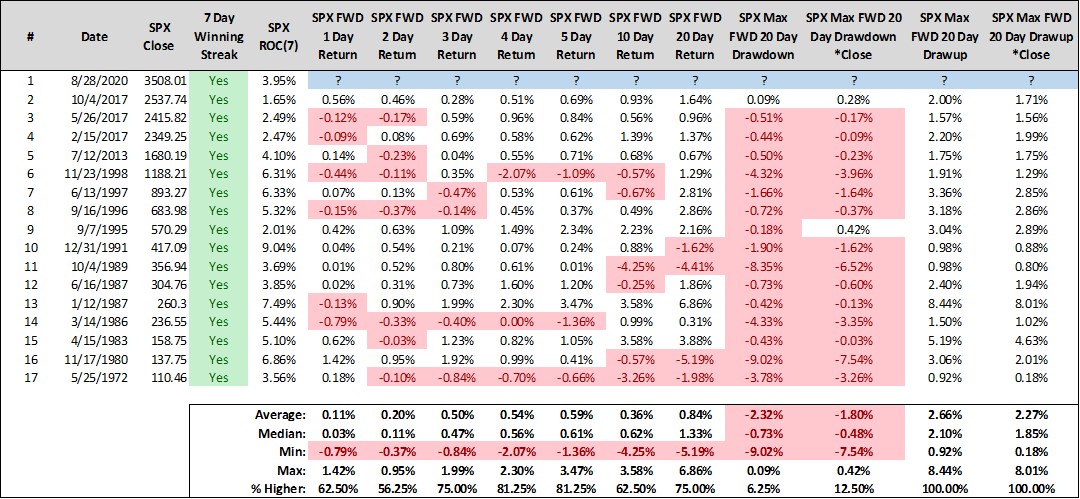
As well, Urban Carmel observed that the market has undergone a five week winning streak. Past winning streaks of six weeks or more have also tended to be bullish, with the exception of 2015.
While absolute price momentum, defined as the market rising which leads to further gains, is evident, stock price momentum, or individual stock rising leading to further gains, is faltering. The stock price momentum factor as measured by different momentum ETFs has been weakening. However, the momentum factor also failed during the late 2017 and early 2018 melt-up, and it was an inexact timing signal. Decelerating price momentum can be regarded as a warning, much like how a ball slows its ascent at the top of its parabolic when thrown into the air.

Conflicting messages from Big Tech
I have made the point before that Big Tech is dominating the behavior of the stock market. The top five stocks comprise 22% of the weight of the S&P 500, and the combination of technology, communication services, and consumer discretionary (AMZN) sectors make up about half of the index. What’s the market message from Big Tech?
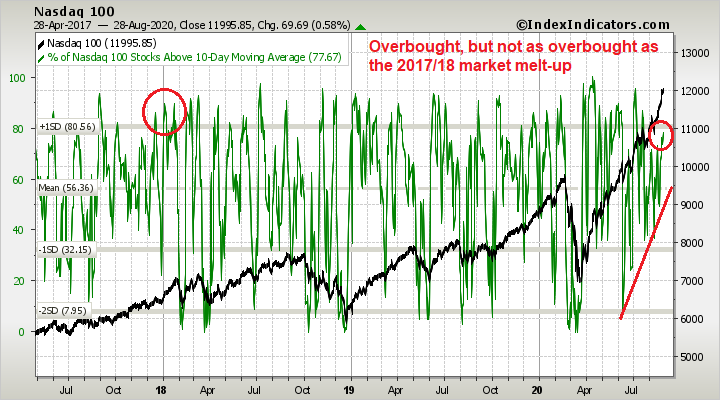
The NASDAQ 100 (NDX) is a good proxy for Big Tech, and it is also experiencing a similar pattern of high correlation with VXN, which is the NASDAQ volatility index. VXN is also forming a rounded base and poised for a volatility surge. While past episodes of high NDX and VXN correlation have been bearish in the past, we also had an experience in early pre-COVID 2020 when the NASDAQ 100 melted up despite high correlation readings.
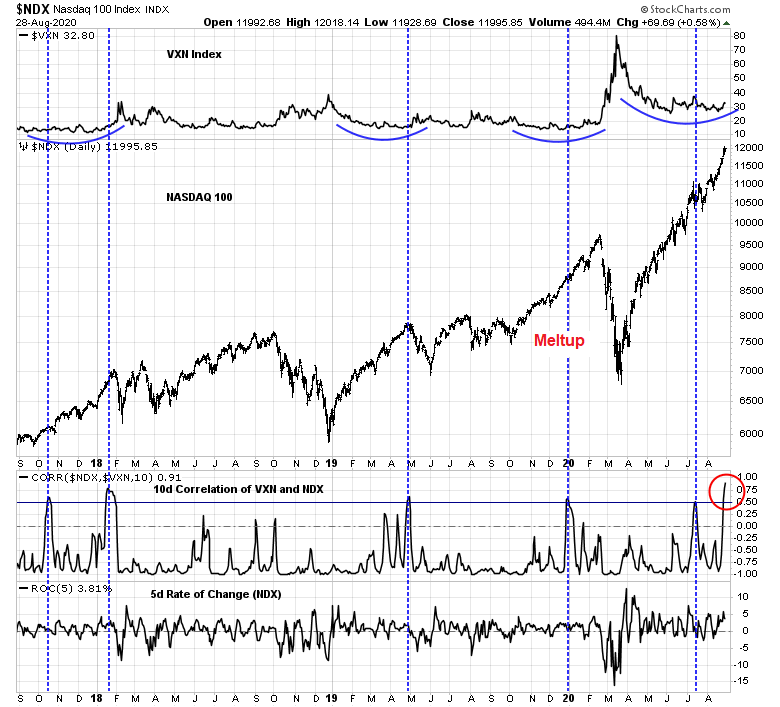
We are seeing some early warnings signs of a downside break. While the NASDAQ 100 is still behaving well, the relative performance of semiconductor stocks are showing some chinks in the Big Tech armor. Semiconductors have been on a tear for over a year, and their relative performance breached an uptrend last week, which I interpret as an early warning that not all is well. I will be watching whether VXN (top panel) can break out of resistance after forming a multi-month base.
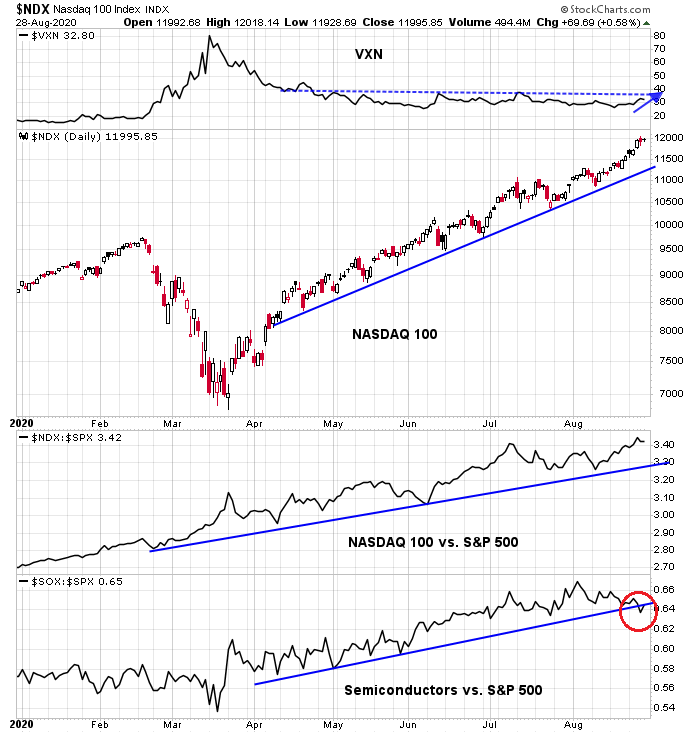
Before the bears get all excited, the relative performance breach was relatively minor, and the absolute and long-term uptrend of the SOX Index remains intact.

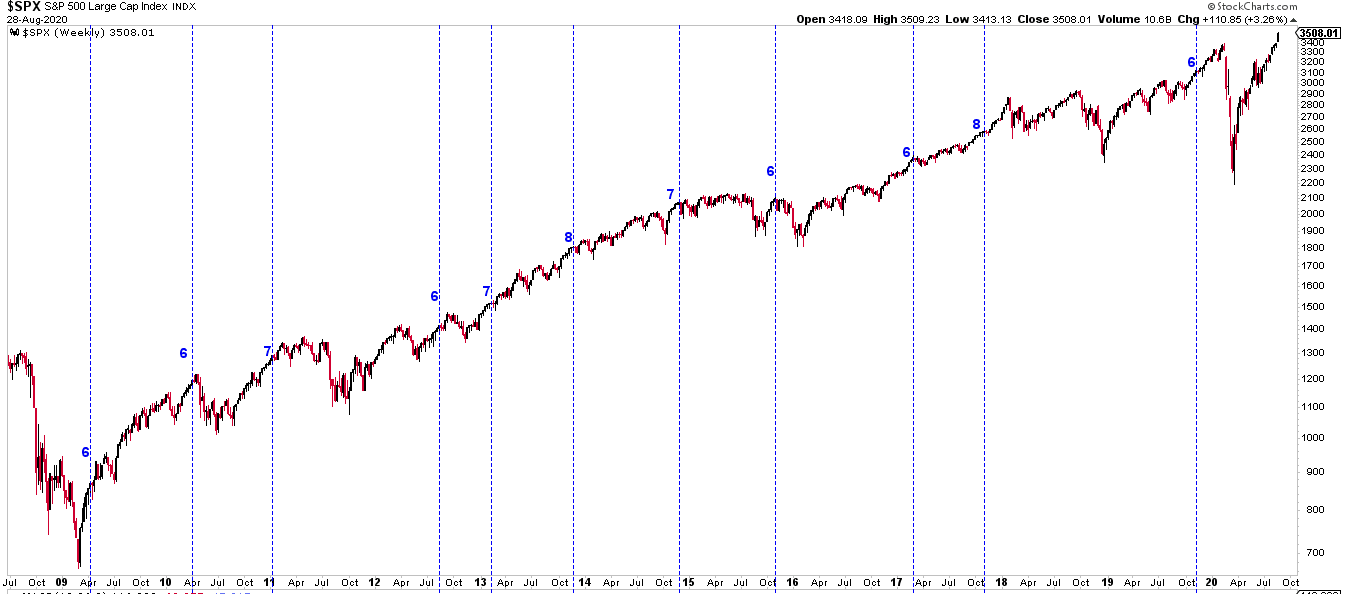
These trend breaks doesn’t necessarily portend an immediate pullback. The NDX is indeed highly extended, but extended markets can rise further. The index has reached 2.7 standard deviations above its 20-month moving average. While this is not unprecedented, the last time this happened was in late 1998 as the market melted up.

The week ahead
So where does that leave us? The stock market is undoubtedly overbought and numerous warnings leave it poised for a decline. On the other hand, strong momentum can carry prices higher into a melt-up, to be followed by an abrupt collapse.
Next week will provide some clues to the Volmageddon vs. market melt-up question. That’s because the market may be overreacting to dovish comments from Fed chair Jay Powell last Thursday, and a post-convention polling bounce by the Republicans in the wake of their convention. While he is still trailing, the odds of a Trump electoral win has been improving at PredictIt.

Equally revealing are the odds of Senate control. The Democrats’ lead has evaporated, and the odds are now even.
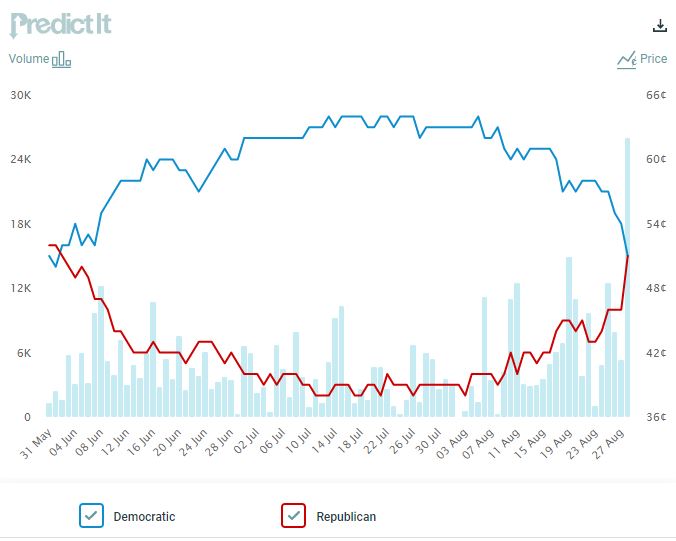
These developments have have been perceived as equity bullish, as Republicans have been thought to be more market friendly than Democrats. However, this may be a blip owing to post-convention bounces, which are common, and we won’t really know how the polling will settle out for another couple of weeks.
In the short run, the all important NASDAQ 100 is overbought, but levels are below the melt-up peak of early 2018. If the market is indeed undergoing a melt-up, it has room to rise further.
If I had to guess, I would estimate a two-third probability of a correction, and one-third probability of a melt-up, but I am keeping an open mind as to the ultimate outcome.
Disclosure: Long SPXU
Recently read about an interesting concept. There are times when all technical analysis fails due to what is termed as ‘Ruling Reason’ and market follows that Ruling Reason ‘. According to this concept, we are in such a period.
Regardless, I believe the risk/reward is asymmetrical. I have been trimming long positions but not going short.
This is also a good time to write OTM call options, I believe.
Interesting. Like, on QQQ? AAPL?
SPY, QQQ. Hold these in my portfolio.
AAPL could be a good candidate after it settles down post split. It has relatively high VOL.
These are definitely not normal economic nor market times.
First of all, Cam, I hope your tests come back negative and you just have a little heartburn or something easily treated.
About the bond market weakness: In normal times we see the economy and stock market come out of a recession after the Fed has radically cut short term rates. The economy and markets recognize this and start to improve. Eventually the improvement over heats and the Fed begins to tighten short term rates which increases corporate, real estate and other costs which will eventually slow the economy. Often the economy was strong enough to absorb the initial rate increases and a series of increases over 6 months or a year are necessary to slow things down. Markets often continue to increase until it is obvious that the Fed has increased rates enough that economic data is starting to stall. In the past the Fed has almost always over done the rate increases and caused another recession.
This started to happen in 2017 as the Fed was seeing economic expansion and started increasing rates. This time, though, the economy was not as strong as they thought and it started to falter early on. The Fed wisely reversed course and lowered rates.
That is how normal economic cycles have been working for the last few decades – until Obama was elected. IMHO Obama initiated initiated tons of regulations and policy that put a huge burden on corporations. In response the Fed launched a series of Quantitative Easing operations to keep the economy from falling into recession. The result was much lower rates, anemic corporate growth and a steady stock market. The slowed growth also helped to keep inflation down surprising my prognosticators.
Now, with the pandemic, we are in a new bold world of finance. The Fed has promised to keep rates low for a long period (months or years is anyone’s guess), and the economy has just begun to improve. However, there is much improvement needed just to get back to normal. But the Fed and Congress have pumped Trillions of dollars into the economy and the markets have looked across the gulf and see the resumption of growth in 2021-22.
Just concerning ourselves with the recent month long blip in 10 year and 30 year Treasury rates, are they going to slow the economy and derail the stock market? In the longer term, the answer is, Yes. But in the current environment I believe the quarter to 1/3rd increase in rates is non-consequential. The Fed has promised to keep rates (short term) low and longer term rates are reacting to continued improving economic data and a large bond supply. I don’t believe the Fed will allow long term rates to rise much higher. They will increase their bond purchases and other easing operations to keep LT rates relatively in check.
What does that mean for the runaway stock market? IMHO it means that although the market is way overbought, any correction is going to be contained to probably just under old highs.
On the other hand, upside from here is probably limited until and unless economic data improves more and there is a viable vaccine about to be announced. Once a vaccine is announced, we may see a more serious correction to bring the market in line with historical P/E ratios.
It appears the US Treasury has started more substantial spending into the economy as can be seen here :
https://fred.stlouisfed.org/series/WDTGAL
I expect this to continue through the election. With over one trillion extra dollars in their account, it shouldn’t be long before economic numbers start to reflect this excess spending, marking a “Christmas in the fall” effect on the economy and (I think they hope) the election.
So if the market is going to correct, it should happen before the stimulus effects of this spending kicks in.
Wes, unless I am mistaken that chart shows the liabilities of the Treasury which means the recent bond auctions added massive liabilities to the Treasury balance sheet as they had to sell a lot more bonds than usual.
Wally,
The chart is the bank account of the US Treasury. The Fed sells bonds and deposits the proceeds into this account.
Wally, maybe this will help.
https://www.youtube.com/watch?v=Zw1-h60-rXA
OK, Wes, thanks. I see what Fred is showing here. Just FYI here is a little different take on what that balance will be used for.
https://www.fxstreet.com/analysis/whats-up-with-the-us-treasurys-cash-balance-202006251154
Wally, If the Treasury just keeps paying bills as usual but does not replace the maturing bonds, the stimulus effect will take place because of the increase in money circulating.
Wes, they replace the maturing bonds when they hold auctions in addition to issuing new bonds at the auction. I just didn’t read the title of the chart of the Treasury General Account correctly.
Thanks for bringing this to our attention.
On Friday the CEW surged >1%. This is infrequent, and cases in the last 18 months have all corresponded with surges in the S&P (or A-D). A minority were immediately followed by a dip. Perhaps we will have a melt-up first.
The alternative opinion is consolidation through sector rotation.
I think the S&P 500 broke out last week.
I am reluctant to put on a short position until I see it conclusively reverse.
Weekend commentary by Michael Santoli (CNBC, ex Barrons)
https://t.co/mgOU26IiQL
Thanks, Ravindra. Before getting scared out of this market we need to keep in mind that usually:
“Technically Speaking: Tops Are Processes, Bottoms Are Events.”
Agreed. It’s just me feeling more comfortable taking some chips off prior to elections. I might miss some upside but I am not good at figuring out the topping process either. Sleeping better at night indicator, I guess.
But wars are good for stocks! LOL
LOL. Not at my age.
https://www.marketwatch.com/story/popular-trading-platforms-td-ameritrade-robinhood-others-face-outages-as-tesla-and-apple-stocks-split-2020-08-31?siteid=bnbh
What’s your take on TLT here, Cam?
Short answer: It’s hard to believe that the Fed will allow long rates to rise too far because it will kill the economy.
Longer answer: I will have a more complete analysis in a few days.
I’m not trying to start a political argument with this. I’m just reporting what JPMorgan’s Kolanovic had to say about investments regarding the election.
“An average of betting odds compiled by RealClear Politics showed former Vice President Joe Biden’s lead shrank to 1.9 points on Sunday, down from a high of 24.6 points on Aug. 1.”
“Certainly a lot can happen in the next ~60 days to change the odds, but we currently believe that momentum in favor of Trump will continue, while most investors are still positioned for a Biden win,” wrote Marko Kolanovic, quantitative strategist at JPMorgan.”
https://www.foxbusiness.com/politics/jpmorgan-investors-should-consider-rising-odd-of-trump-win
He has made some bold and good calls! Thanks for this insight.
Yeah, Kolanovic had a really hot streak a couple years ago calling market moves but that was followed by some not so good calls.
Some scientists (and potential quacks) are making DIY vaccines for Covid-19 and taking it themselves and using on friends and family.
https://dnyuz.com/2020/09/01/these-scientists-are-giving-themselves-d-i-y-coronavirus-vaccines/
very interesting article Wally. One comment mentioned Dr. Stine as a nutty professor; smart but with unconventional personality. I could see the crazy professor in Back to the Future when I read this article.
Another day, another UP day.
It’s always kind of lame to post entries after the fact, but I just never got around to it on Monday. I opened a starter position in RYGBX (Rydex Long Bond) yesterday – the fact that it closed up +1.88% today despite strong moves in the indexes may portend high(er) odds of a pullback heading into the latter half of the week.
“Far more money has been lost by investors preparing for corrections, or trying to anticipate corrections, than has been lost in corrections themselves.” – Peter Lynch
Cam,
Good luck with all your tests!!
Will be closing RYGBX end of day.
Opening a position in AAPL ~129.
Adding @ 127.
Hope you used a mkt order. I show the low at 127.11.
My free quotes are representative. It looks like there were some trades at 127 even.
Haha – that wasn’t me.
Status Filled at $129.1124
Total Price Improvement $6.79
Symbol AAPL
Description APPLE INC COM USD0.00001
Action Buy
Quantity 385 Shares
Status Filled at $130.8876
Total Price Improvement $6.77
Symbol AAPL
Description APPLE INC COM USD0.00001
Action Sell
Quantity 385 Shares
in other words, I had a limit buy @ 127 that never filled! That’s how it goes sometimes…
I am, however, looking to reopen ~127.
Yup. You might try adding a few cents above whole numbers on stock buys and a few cents under whole numbers on stock sells when using limits. Most of the time it won’t matter but sometimes it will.
Closed at 130.85.
Does anyone think that a near-term low was set in TLT last Thursday/Friday?
anyone ‘else’
I don’t know but looking at the 10 yr chart we have a higher high and now a higher low (so far) which is symptomatic of higher rates if it holds.
I’m talking yields not price above.
https://www.marketwatch.com/story/pelosi-criticized-over-visit-to-off-limits-san-francisco-hair-salon-2020-09-01?mod=mw_more_headlines
Privilege for me but not for thee.
It’s been that way since the dawn of civilization.
Pelosi is demanding an apology from the salon for “setting me up” and update from Marketwatch. She used to represent me, so glad got the hell out of there.
Both Spot VIX and volatility products have been steadily up, while stocks have also been up and away.
It is the same conditions as the 2018 Volmageddon, but not sure if the history just repeats since volatility ETFs are now deleveraged and less explosive. What will cause the “explosion”?
It is also possible that the market is trying to prepare for the presidential election volatility regardless of stocks tape. There was similar volatility build-up in 2016 (in 2016 stocks were down, however).
Amazing rally. I think it’s fair to say that buy-and-hold has outperformed almost any other strategy since March 23.
https://www.marketwatch.com/story/how-valuable-is-apple-just-ask-the-ftse-100-11599057978?siteid=bnbh