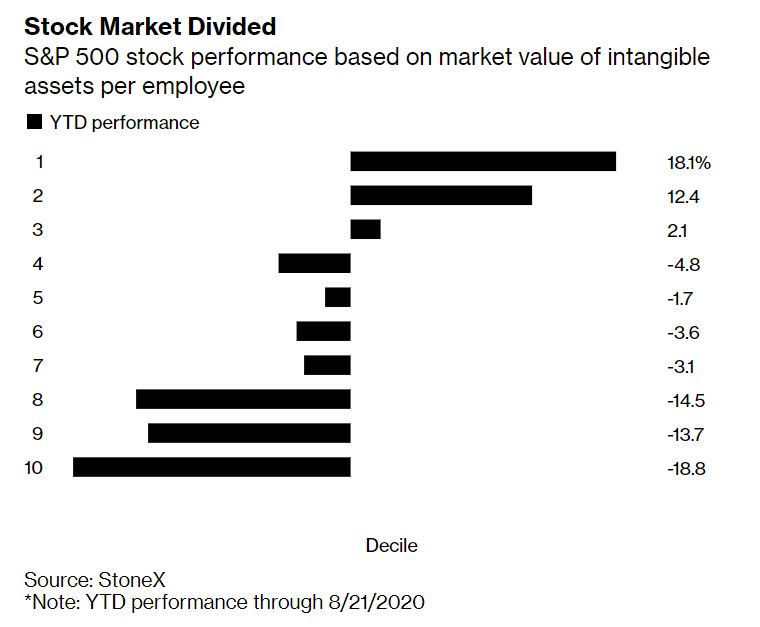
Mid-week market update: One of the defining characteristics of the current bull run is the dominance of US large cap growth stocks. Joe Wiesenthal wrote about the problem of the effect of the “superstar companies” on the economy in a Twitter thread and in a Bloomberg commentary. The “superstar companies” have few employees, and therefore high labor productivity.
But if labor productivity is all that matters, and you don’t need any workers, where is the demand going to come from?
If you think that the key thing is demand, and that demand drives investment, driving productivity, then it’s not about declaring some tech companies winners and declaring everyone else as zombies that should die, it’s about fostering income equality to drive spending.
Something nobody ever seems to point out is how it’s interesting that productivity growth is historically quite low, even though we have an economy that’s dominated by some of the most productive companies in human history. Maybe more ultra-productive companies aren’t the answer?
While Big Tech and large cap growth are still red hot, more cracks are showing up in the growth stock armor. The chart below shows an unexpected divergence in relative performance between large cap and small cap growth (top panel). If we were to benchmark US large and small cap stocks against global stocks, as measured by the MSCI All-Country World Index (ACWI), we can see that large cap growth remains in a relative uptrend against ACWI (middle panel), but the relative performance of small caps and small cap growth have flattened in the past few months.

While these are not immediate bearish signals, they represent “under the hood” warnings of pending trouble in US equities.
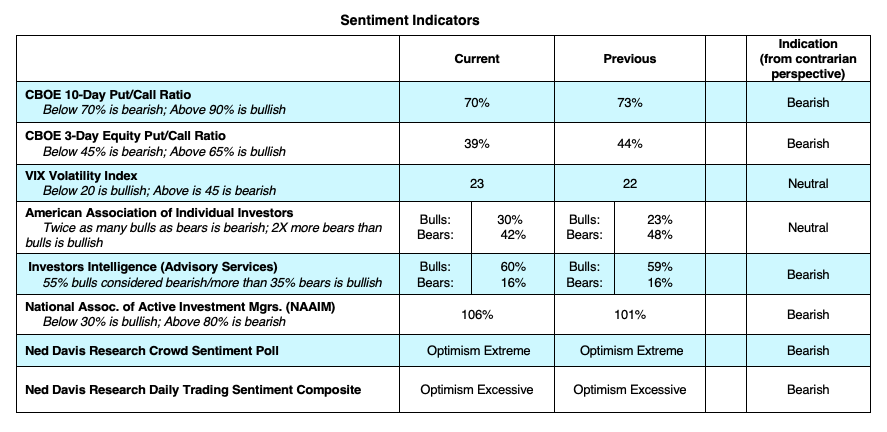
Sentiment warnings
As for the rest of the stock market, there are plenty of warnings from sentiment models. The Citi Panic-Euphoria Model is wildly euphoric, though readings are not as high as they were during the height of the dot-com bubble.

One reader alerted me to Willie Delwiche’s analysis of sentiment, where six out of eight models are bearish, with two in neutral. That’s another sign of extreme bullishness, which is contrarian bearish.
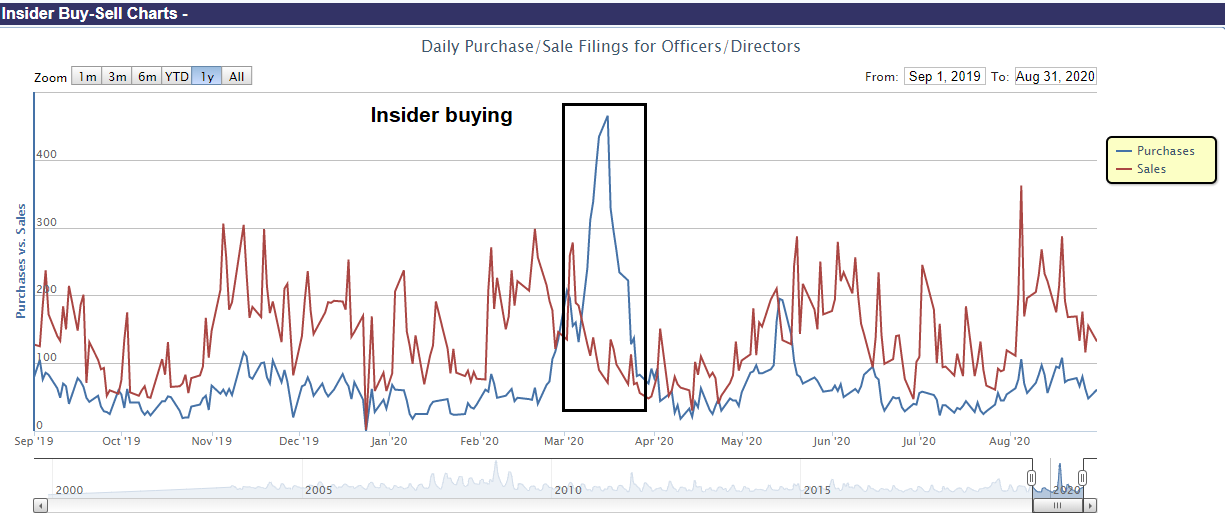
What is the “smart money” doing?
Other signals of market headwinds come from the behavior of the “smart money” crowd. One measure of “smart money” are corporate insiders, who have shown little tendency to step up and buy the shares of their companies. To be sure, insider trading works best mainly as a buy signal, when buying swamps selling as it did in March.
Another savvy investor is billionaire distressed investor Sam Zell, who said in a CNBC interview that “it’s really too early for the normal clearing process” to be buying right now, and “there will be significant opportunities probably in Q4 or first quarter of next year”. Zell’s remarks about the “clearing process” is code that the market is being held up by fiscal and monetary support, and he is not ready to buy until he sees signs of distress.
What’s Warren doing?
Warren Buffett also told a similar story. He stated earlier in the year that while he saw signs of distress during the March COVID Crash, Berkshire Hathaway was unable to react and use its cash horde to make distressed buys because of official intervention.
Nevertheless, we have important signals from Buffett’s recent actions. Some gold bugs got very excited recently when Berkshire bought a position in Barrick Gold, but the position was relatively small and the decision was likely made by one of the Buffett’s lieutenants. More importantly, Berkshire recently disclosed new positions in five Japanese trading companies. Here is what we know about the purchases:
- The value of the acquisition was about $6 billion for about 5% stakes in Itochu Corp., Marubeni Corp., Mitsubishi Corp., Mitsui. and Sumitomo Corp.
- These companies are mainly commodity trading conglomerates.
- Their valuations are historically cheap, weighed down mainly by their commodity exposure, particularly in energy and natural gas.
- They offer strong cash flows and dividends.
- Berkshire Hathaway quoted Buffett in a statement, indicating that it was Buffett and Munger who made the investment decision: “I am delighted to have Berkshire Hathaway participate in the future of Japan and the five companies we have chosen for investment”.
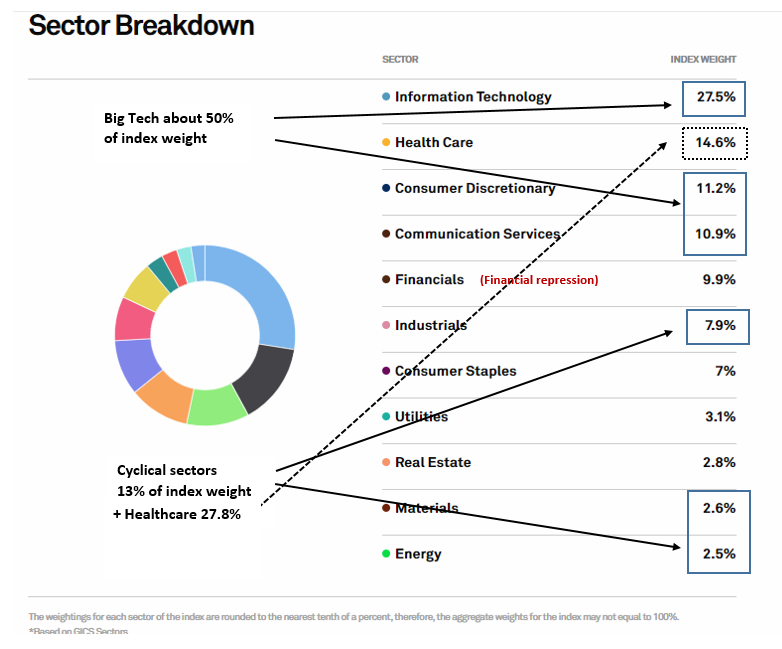
I interpret these statements to a decision to gain exposures into commodity business in a way that minimizes the cyclicality of the sector. I also recently pointed out the beaten up nature of energy stocks (see Here’s a way to energize your portfolio). Callum Thomas observed that the energy sector is now the smallest weight in the S&P 500 index, which is another signal of wash-out sentiment.

In conclusion, sentiment models are at crowded long extremes, and smart investors are not ready to buy yet. While US large cap growth is still dominant, cracks are appearing in its leadership, and smart investors like Warren Buffett are focusing on positions in the unloved commodity sector.
As a reminder, Big Tech comprises nearly 50% of S&P 500 weight, while the cyclical sectors are only 13% of the index. If and when we see a rotation from growth the value, financial stocks, which can be considered value stocks, are unlikely to participate significantly as long as the Fed suppresses interest rates and interest margins. While history doesn’t repeat, but rhymes, a leadership failure of US large cap growth will rhyme with the 2000 dot-com bubble top owing to the sheer differential in growth and value index weights.
Analysis from BCA Research shows that the S&P Growth to Value ratio is the highest it’s been, ever. Moreover, rotations from growth to value have coincided with recessions and bear markets.
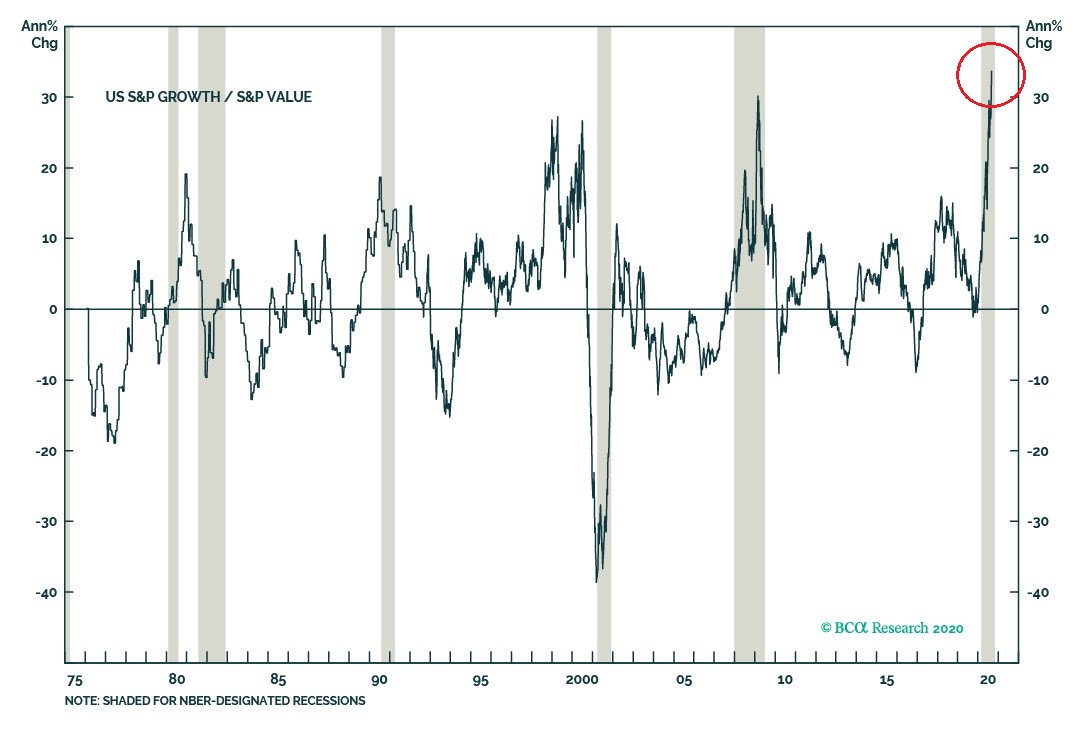
We are just waiting for the bearish trigger.
Disclosure: Long SPXU
I have a new market theory. As long as I stay 85% in cash the market will continue to make new highs. As soon as I decide to commit more funds the high will be in.
Will you please keep us up to date with this important metric? : )
I had a brief look at the new Japanese horses in the Buffett stable. The fundamentals look good – as stand alone, but particularly for value compared to the US market.
I also like the fact that the tickers for Itochu and Marabeni are 8001 and 8002. It’s almost like someone went down a list and randomly ticked, OK $5b here..
Are REITs value stocks too? Will REITs be part of the rotation too?
Warren Buffett bought more Store Capital Corp.
Re Buffett’s purchases- there’s a great line in ‘Yellowstone’ where Kevin Costner’s character looks at his son and says, ‘Leverage is knowing if someone had all the money in the world…this is what they’d buy.’
For what it’s worth, a profitable short AAPL strategy (yes, there is such a thing) had a short signal on 8/28/20 but the trade is still unprofitable at -5.6%. The strategy is based on market internals and has a sharpe ratio of about 1 so it is not worth trading, but previous 3 trades had an average return of 23% with a similar maximum drawdown. A cautious note for the bears is that the same strategy has not triggered a short signal in either the $NDX or $SPX. Sentimentrader had tweeted that when AAPL had gapped up and quickly lost it, $SPX had done poorly the next month or two.
Picture and list of trades for the short AAPL strategy. Not worth trading. https://i.imgur.com/ivLYwiW.png
I can’t believe I’m saying this, but these articles on ZeroHedge are a must read, methinks!
https://www.zerohedge.com/markets/epic-battle-raging-beneath-market-surface-between-dealers-and-hedge-funds
https://www.zerohedge.com/markets/classic-feedback-loop-why-everyone-chasing-gamma-crash
Excerpts:
https://imgbox.com/6qFKbo7r
https://imgbox.com/DYb6defn
“…Putting it all together, we find that a combination of market euphoria, free options trading, and most importantly, few market-makers have sparked the fire. It also means that “a few large hedge funds understood this and have added fuel to the fire by pushing implied higher and higher and putting further pressure on the likes of Citadel and Goldman. With this process helping drive names like Apple and Tesla, this also makes sense why Breadth has been so terrible.”
The punchline, for all those who have been looking at the market action in recent weeks in stunned silence, well you are not alone, because as the PM concludes, “while most of the market is fading lower we are seeing a battle between a few big hedge funds and banks who are getting shorter and shorter gamma.”
Perhaps today’s snap-back lower in Tesla and Apple stock, which both saw their market cap plunge by more than $100 billion in just the past 24 hours, is the start of an unprecedented gamma avalanche as the epic battle waging below the market surface in vol land between hedge funds and dealers reaches its conclusion…”
Maybe get puts on Goldman.
I stopped trading options because the premium is nuts.
Even on spreads…and when the spreads are in the money, the premiums are so high still that the spread hardly budges…maybe that is a sign, dunno
VIX has been rising for the last five days.
Historically, we have seen significant pull backs after labor day, once trading desks are fully staffed, especially after “Bosses” returns from their summer vacations in the Hamptons, or so is the lore. There is some truth to this, regardless, especially in those years, when we have had a huge summer rally.
AAPL and TESLA stock splits are likely to be a waning influence, all said.
If oil is a generational trade, how come Mr. Buffett not buying with both hands? He is known to make such statement trades.
Some of the oil Super majors appear to fall into the Buffett type stocks?
He’s afraid of electric cars. One big breakthrough in battery tech and oil isn’t going anywhere.
What’s going on, Wally – did you start adding to your 15% exposure last night?
LOL. No, RX, still sitting pat. The decline today isn’t my doing. Might open a short today if the decline gets out of hand.
Let us know, so we can bet the other way.
Been mostly in cash since 2015…yeah, being too early is the same as being wrong!
Conspiracy alert…They will push it till the election…the Fed will not do anything disruptive until after the election…maybe not after either, but not before.
How much pre-election jitters will the market get?
Disclosure, I will stay mostly in cash until the bear is gone, so until there has been a major prolonged decline and I suspect things will look different, but I have real estate hedges
“Is This a Top or Just a Routine Correction?” ~ James DePorre
https://realmoney.thestreet.com/investing/stocks/is-this-a-top-or-just-a-routine-correction–15417329?
Do you think that correction/pullback will last more than one day?
Taking a swing at TSLA and AAPL here.
May take a swing at SPY/DIA into the close.
Keeping it small – this is not the time to be aggressively long.
Will be adding Rydex versions of SPY/DIA/QQQ at the close. Using position size for risk control.
Jobs report tomorrow.
US indexes continue to sell off after the close.
Plan A is to add to existing positions if we open in the hole. Stop-loss no more than ~-1% from opening levels.
Plan B is to close positions on a throwback rally.
Longer term, I think we’re headed down from here. Why the swing trade? Momentum does not easily die, and I think it’s worth playing for a bounce.
Wouldn’t BRK’s purchase of these commodity trading firms be a bet on higher inflation?
TSLA off near the open.
Added to AAPL.
Wrong call on market direction today.
Unlike early June, I’m backstopped by position size – and also unlike early June, I’m not interested in holding through an extended decline.
I’m going to do my best to exit existing positions on interim strength.
That was a mean downdraft!
I’ve had more time to think over the next move, and I plan to stay put. Due to proper sizing – as of right now, only 16.7% of the portfolio is invested. Somewhat uncomfortable nonetheless on a day like this, but (a) positions were opened on weakness (ie, yesterday’s decline) and (b) I still think bulls will pull off one more rally before an extended decline.
Of course, I was wrong yesterday and I could be wrong again today.
The magnitude of yesterday’s decline means this isn’t likely to just rally back to new highs in a week. We may get a relief rally later today but next strong support is at S&P 3300. We wiped out a weeks worth of gains yesterday and my again today.
Of course, what do I know? LOL
BTW, I hope Cam’s tests were negative on Wednesday. Cam, any comment?
I forgot to study for the test, but everything went well.
I would have been stopped out of my short on Wednesday, but lucky I was at the doctor and couldn’t react.
Great news! Remember, it’s better to be lucky that good (at trading).
Market breadth study earlier this morning on the weekly chart of $SPX showed that there may have been enough market strength for justifying covering the shorts, but that signal has evaporated – but it could still return by closing today. Past signals since 3/23/20 have lead to short term gains, some lasting weeks (see cyan lower dot indicators). https://i.imgur.com/fpGde7K.png
Studies of market breadths in both $SPX and AAPL have short covering signals returned by 14:00 Friday (currently), suggesting most of the shorts are over and the market may trade sideways before heading higher in the next week or two. Similar signals in the past weeks have lead to short term weekly gains -assuming the market closes near the levels they are trading now. This past two days look like a run of the mill overbought sell off, last seen on 6/12/20. This may also be a rehearsal for what is likely to come – the testing of the highs on the upper Bollinger band. https://i.imgur.com/0qXyCX5.png
They were saying yesterday that the selloff was sparked by Fauci and others saying there would be no vaccine approval in October. It also seems that the FANG stock weakness early Wednesday may have provided a clue to the selloff
I think, as has been said by many here, that we will see news and rumors about the candidates roil the market up and down until November.
If we sell off again this afternoon, I may add another 10% of my long term funds to the market. If we rally instead, I’ll hold off for now.
Good thinking, Wally. Refer to my own decisions (after thinking things through) above.
RX, I’ve been looking for a correction to add a little. Normal corrections have sort of had a 3 day decline that often signals and end or pause. This is day 2 but if you look at the chart of FNGU you could call this day 3 of a lower close from the open.
Anyway, that would only bring me just up to 25% or so in the market and leave room add more if we sink further in Sept./October and perceive a bottom later.
The NAZ touched its 50 dma this morning at the low. FYI, I did NOT add to my market exposure today.
The trading account actually ended up +1.5% for the day (not just on existing positions, but using the entire portfolio balance as the basis). That’s good intel – I don’t think we’ve seen the end of the runup from March 23.
Based on closing numbers for the DJIA/SPX/QQQ – I’m looking at a -0.55% loss for exising positions only.
Closed positions in the long bond a day early on Wednesday…but had I waited until today would have given back all gains.
https://heisenbergreport.com/2020/09/04/charlie-mcelligott-and-the-reservoir-dogs-standoff/
dealers’ hedging needs in the wake of massive single-name call buying in tech drives a “mechanical negative convexity/short gamma-driven grab into market upside”.
I think Cam wrote about the volatility control strategy funds entering a positive feedback loop in March as spiking volatility begat more and more selling.
Could this drive a big downside unwind?