Now that stock prices have recovered from their March lows to all-time highs, it’s time to admit that I was wrong about my excess cautiousness. I present a new framework for analyzing the stock market. While the new framework is useful for explaining why the major US market indices have reached fresh highs, it does not necessarily have bullish implications.

My previous excessive cautiousness was based on two factors, valuation and a weak economic outlook. The market is trading at a forward P/E ratio of 22, which is extremely high by historical standards. Moreover, it was difficult to believe that the economy and stock prices could recover that strongly in the face of the second worst economic downturn since the Great Depression.

While there has been much discussion over the letter shapes of the recovery, whether it’s a V, W, L or some other shape. The reality is a K-shaped bifurcated rebound. This bifurcation is occurring in two separate and distinct dimensions, the stock market and the path of economic growth.
The K-shaped recovery analytical framework has important implications for how investors should view the market’s future outlook.
A bifurcated stock market
I highlighted analysis last week (see A Potemkin Village market?) that Big Tech has become dominant in the weight of the index. The combination of technology, communication services, and consumer discretionary, which is dominated by Amazon, comprise about 50% of S&P 500 index weight. The adage that the stock market isn’t the economy is especially true in this case. Large cap growth stocks were becoming the stock market. Where Big Tech went, the rest of the market followed.

I also identified a nascent rotation out of large cap growth into cyclical sectors (see Sector and factor review: Not your father’s cycle). From a technical perspective, rotation in a bull phase is normally healthy, but the current market weighting of the index makes such rotations problematical. Cyclical sectors only make up 13% of index weight. If you include healthcare, which assumes the successful deployment of vaccines and therapeutic drugs, the combined index weight is only 27.8%. A rotation out of the Big Tech sectors with half the index weight into smaller sectors with 13% is not possible without the funds moving elsewhere, such as foreign markets or other asset classes.
I would also add that financial stocks, which represent a major sector, are unlikely to participate in a market recovery. That’s because the Federal Reserve is engaged in financial repression to hold down interest rates, which has a detrimental effect on banking margins.
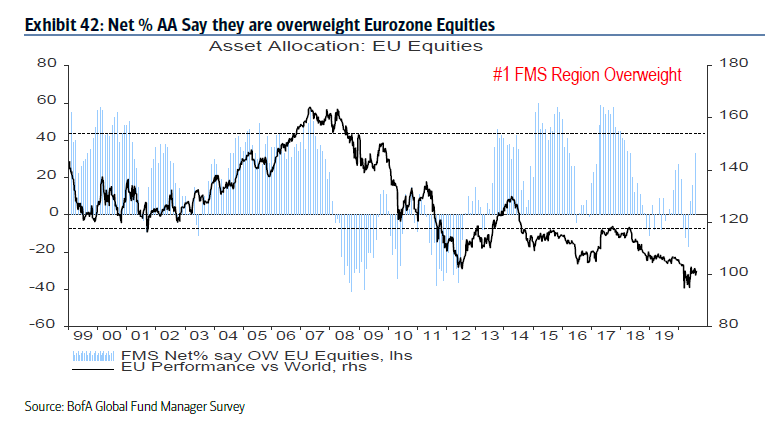
The cyclical rotation theme was confirmed by the latest BoA Global Fund Manager Survey. Global managers were buying cyclical, value, and eurozone stocks while selling growth and US stocks.

We can also observe a similar rotational effect in regional allocations. In response the COVID Crash, managers had piled into US equities and made the region the top overweight because US large cap growth stocks were the last refuge of growth in what was a growth starved world. The latest survey shows that eurozone stocks had taken over the top spot in equity weighting as managers shifted from US growth to eurozone stocks, which are more cyclical in nature.
However, a chart of the relative performance of different regions to the MSCI All-Country World Index (ACWI) shows that most regions have been trading sideways since early July. If there is a rotation from US Big Tech into cyclical growth, that play may be petering out.
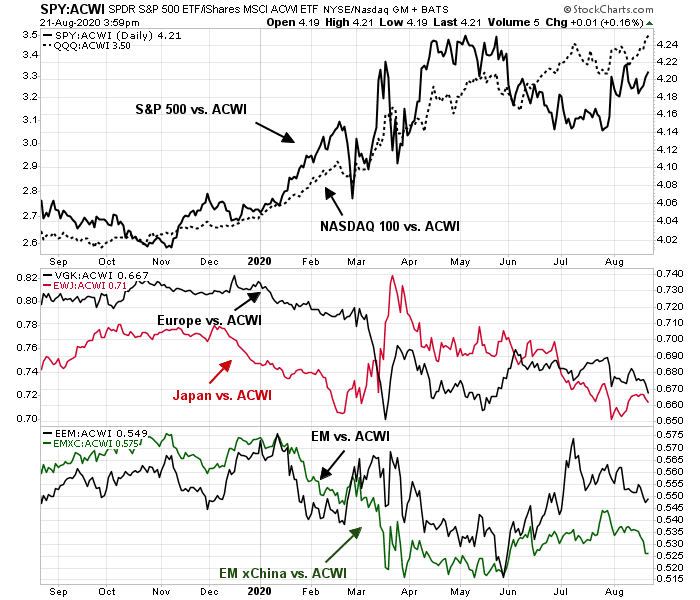
That’s the challenge for US equity bulls. If there is a rotation into cyclical stocks in anticipation of a global economic recovery, there isn’t sufficient liquidity in the market to accommodate the rotation. Funds will move offshore or into other asset classes, and that will depress US stock prices.
For American equity investors, the NASDAQ 100 (NDX) is effectively the only liquid game in town. The troublesome part of this game is the NDX losing momentum, as evidenced by a series of negative RSI divergences even as the index pushed to fresh highs.

A bifurcated economic recovery
From a top-down economic perspective, the economy hit a brick wall and came to a sudden stop with the COVID Crash. At the height of the downturn, 6.7% of the population had filed for unemployment, which dwarfs the ~2% level during past recessionary peaks. Viewed in that context, it was hard to believe the economy could recover that quickly after such an unprecedented shock.

What was missing from that 10,000 foot top-down analysis was most of the job losses were in low paying service industries. The defining characteristic of this crisis is the inequality of the experiences it’s inflicting on the population. The bottom 40% of households by income account for 22% of consumption, so the drop in spending does not affect the economy as severely if the job losses were distributed uniformly across the board.

The trajectory of the housing industry is a good example of the highly bifurcated nature of the economic recovery. The teal line depicts homebuilder traffic of prospective customers, which is at record levels. On the other hand, the white line shows mortgage delinquencies, which have also soared. In normal times, these two data series should not be moving together. These conditions represent a “best of times, worst of time” snapshot of widening inequality. People with secure and good paying jobs are buying houses, and they may be expanding their housing demand because of the work-from-home effect. In fact, the latest July NAR report of existing home sales shows that the proportion of second home buyers rose to 15%, highest since March 2019 and at pre-pandemic levels. On the other hand, the lower income and economically stressed parts of American society are losing their homes to foreclosures and evictions.

The K-shaped bifurcated recovery can also be seen in this Bloomberg article contrasting the earnings reports of Walmart, which is focused on affordable prices and caters to a lower income demographic, and Target, whose customer base is more affluent.
Walmart Inc. said Tuesday that government stimulus checks provided a boost in its second quarter, but the benefit faded by July. In contrast, [Target CEO] Cornell said that although relief checks helped goose demand, Target’s shoppers kept buying well into July even as the stimulus’ impact waned. “The stimulus was a factor, but even as it waned we saw strong comparable-sales growth in June and July,” he said. “And we are off to a very solid start in August.”
Policy response and asset price implications
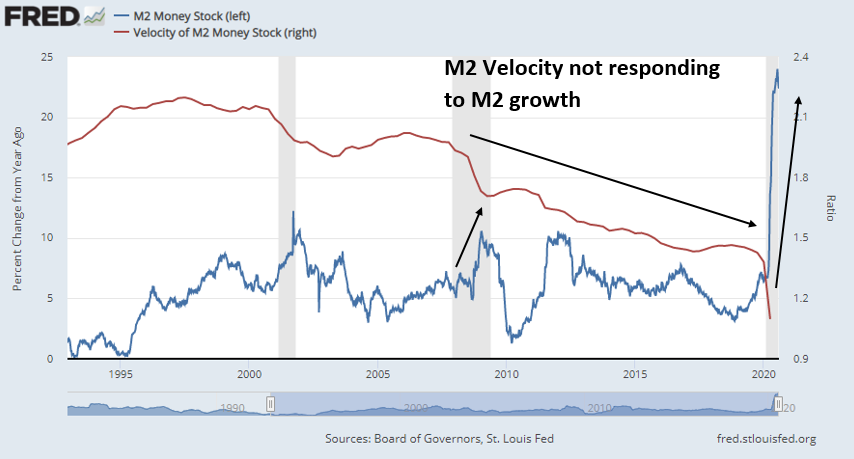
The Federal Reserve and major global central bankers have responded to the COVID Crash with enormous quantitative easing (QE) liquidity injections. Money supply growth has surged as a consequence. While the flood of liquidity has stabilized financial markets, it is unclear how much money is actually finding its way into the Main Street economy. We saw a similar surge in M2 growth in the wake of the GFC, but monetary velocity has been slowly declining in the last decade. As the monetary equation PQ = MV implies, a falling monetary velocity (V) in the face of rising money supply growth (M) is not helpful to stimulating economic growth.
Central bankers call this dilemma a broken transmission mechanism. Callum Thomas at Topdown Charts observed that even as global central bankers have pushed down interest rates, lenders have responded to the crisis by tightening lending standards.

However, the latest round of QE is not like the GFC version of QE. In the wake of the GFC, the Fed injected reserves into the banking system by buying bonds. Such market operations experienced difficulty pushing the new liquidity into the Main Street economy. As a consequence, monetary velocity slowed, growth was relatively sluggish despite the size of the monetary stimulus, and there were few inflationary pressures.
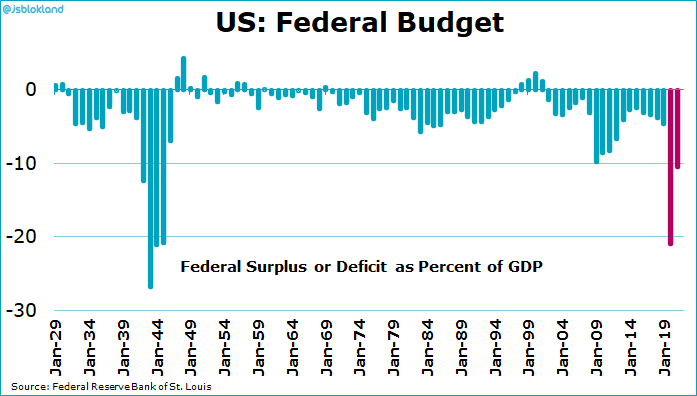
Fast forward to 2020. The latest version of global QE is accompanied by fiscal stimulus. The US, federal budget deficits is at levels last seen in World War II.
The bond market has interpreted the combination of fiscal and monetary stimulus as potentially inflationary. Inflation expectations, as measured by the 10-year breakeven rates, were tame during the last crisis, but they have risen and diverged from nominal rates in this crisis.

This is what financial repression looks like. The Fed and other central banks are deliberately holding down rates to below market levels even as fiscal authorities spend wildly. For another perspective, the 10-year Treasury yield has historically tracked the Citigroup Economic Surprise Index (ESI), which measures whether economic releases are beating or missing expectations. The recovery since the March low has seen ESI skyrocket, but bond yields remain tame. This is another picture of financial repression.

Longer term, these policies should be bullish for gold and other inflation hedge vehicles. In the short-term, however, gold sentiment has become excessively bullish and the metal may need a period of consolidation or correction. As well, the bond market should provide reasonable returns, as the Fed’s medium term policy is to hold down rates for a very, very long time.
As for the currency market, I am not especially bearish on the USD outlook under these circumstances. While USD positioning is at a crowded short, it is unclear what catalysts can drive additional dollar weakness. Yield differentials against major currencies are already relatively low. These high level of expectations of dollar weakness leaves the market in a jittery and highly news sensitive. Examples include the reaction of USD strength to last week’s July FOMC minutes of a rejection of yield curve control, and the unexpected weakness in eurozone PMIs.

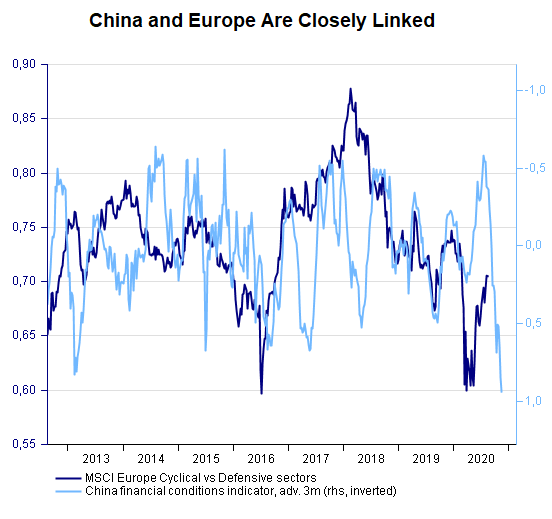
As well, Sebastian Dypbukt Källman at Nordea Markets pointed out that China and Europe are closely linked. “Chinese financial conditions often influence the direction of European equities. The micro tightening that happened after China’s rapid macro comeback suggests less smooth sailing for European cyclicals in coming months.”
Stock market implications
The equity market implications are a bit trickier. Much depends on the behavior of large cap growth stocks. I have two scenarios in mind.
The first scenario is the development of a large cap growth stocks market mania. All bubbles begin with some reasonable assumptions that eventually get out of hand. In response to the pandemic, a handful of companies have profited handsomely. One example is Amazon, which benefited from the WFH theme in two ways. Both demand for its retail services and its Amazon Web Services division rose, as internet-based customers’ demand for support their WFH services soared.
In a bubble, no one knows how far prices can rise. The Russell 1000 Growth Index P/E is 34.1, which is high, but below the levels seen at the dot-com bubble peak. We will only know in hindsight. Needless to say, market bubbles don’t deflate in an orderly manner, but with a crash.

The second scenario would see the market converge to Main Street fundamentals. In this case, much will depend on the path of the pandemic, and whether the cyclical rebound theme is durable. The latest update of Google G-7 mobility reports indicate that the recovery in mobility trends is decelerating, which calls into question of the sustainability of a cyclical rebound.

Similarly, the latest update from Indeed of US job postings shows that they are rolling over. While high paying jobs are showing some softness, it is the low wage job titles that appear the weakest.

In the end, much depends on the path of the pandemic in the coming months. Reuters reported that Trond Grande of Norway’s sovereign wealth fund, the largest sovereign wealth fund in the world, is expecting some near term market turbulence.
The pandemic is not under control “in any shape or form” and remains the biggest issue for investors, said deputy CEO Trond Grande, after presenting the half-year results of the world’s largest sovereign wealth fund.
The fund lost $153 billion between January and March as markets plunged, its worst quarter ever, but earned back $131 billion from April to the end of June amid a rebound, its best quarter on record.
“We could be in for some turbulence this fall as things unfold and whether or not the coronavirus pandemic recedes, or gains some force,” Grande told Reuters.
“We have already seen some sort of V-shaped recovery in the financial markets. I think there is a slight disconnect between the real economy and the financial markets,” he said, noting that government support for economies could only be sustained for so long.
If the S&P 500 were to converge to Main Street fundamentals, how far could it fall? Here is one rule of thumb that may be useful. The ratio of equal weighted consumer discretionary to consumer staples stocks has underperformed the market and it is not buying into the rally to new highs. This ratio is often used as a metric of equity risk appetite. While it is lagging the S&P 500, it has been tracking the Value Line Geometric Index (XVG) almost perfectly.

If we were to chart the S&P 500 and XVG over a 10 year time frame, we can observe periods of convergence and divergence. XVG represents the average listed stocks and therefore more representative of the Main Street economy. A convergence of the S&P 500 and XVG today would put the S&P 500 at just under 2400, which roughly amounts to a re-test of the March lows. Bear in mind, however, that any hypothetical convergence only represents a fair value target estimate, and the S&P 500 could overshoot to the downside. In addition, XVG fundamentals could either improve or deteriorate, which would move the target either up or down.

In the worst case, a downside target of 1650-2000 is within the realm of possibility. Past major market bottoms have occurred with a forward P/E ratio of 10. Currently, the bottom-up aggregated 2021 estimate is about $165. If we apply a 10 to 12 times multiple, we arrive at a range of 1650 to 2000.

If I had to choose, the second convergence scenario is the more likely outcome. It is also consistent with my past observation of the unusual and simultaneous buy and sell signals from the Wilshire 5000’s MACD (buy) and negative RSI divergence (sell). In the past, RSI divergence sell signals have taken 1-6 months before the market topped out. The last time this happened, the market topped out two months after the signal.

In summary, I present a new framework for analyzing the stock market in light of the push to new highs. While the new framework is useful for explaining why the S&P 500 and NASDAQ Composite have rallied, it does not necessarily have bullish implications.
That’s because both the market and economy are undergoing K-shaped and two-paced rebounds. These bifurcated recoveries are creating imbalances that will have to be resolved at some point in the future. One possibility is the formation of a NASDAQ bubble, which would end in a disorderly market crash. The other scenario postulates an orderly convergence between Wall Street and Main Street fundamentals, where I penciled in a re-test of the March lows as a downside objective.
Tactically, investors should watch the NASDAQ 100 and global regional indices for signs of changes in market leadership. Monitoring these indicators will give an idea of how the market is evolving within these two disparate scenarios.
At my company, sales in equipment have increased due to the 0% financing available and generous terms for the duration of the loan, including equipment buybacks.
Residential housing sales in my locale have increased substantially since the “lock down ended”. One of my acquaintances in the mortgage industry said business hasn’t been this good since the last housing bubble. He’s been up working from 6 – midnight since May. The low interest rates have created high demand for refinances and increased demand for home sales.
My company just finished its best half year on record, and my largest client, a well known tech company, is killing it right now both in sales and capital purchases. Housing is holding up well, people are buying bigger houses, and our contractor during a recent small remodel we did told us he has so many jobs lined up he’s raising his prices. This is a snapshot of the west side of the Silicon Valley during the biggest downturn since the Great Depression.
On the east side, where many service workers live, it’s an opposite story. Our housekeeper was incredibly thankful we continued to pay her. Unemployment is high and COVID is more rampant because of denser housing and more contact within and out of the community. The NY Times has written extensively about it. https://www.nytimes.com/2020/08/01/business/economy/housing-overcrowding-coronavirus.html
We are indeed living in the best of times and the worst of times.
Your housekeeper is very lucky. Good news, I see more cleaning crews around my neighborhood. I guess people are just tired of cleaning their homes
There have always been a huge discrepancy between how tech (high wage) jobs and service (low wage) jobs fared under the last 10 years of recovery, and I am having a hard time grasping how this COVID-19 time can be so different. If I could guess wildly, we are finally entering in a real debt bubble as I was also able to finance my company (small one)’s debt with almost 0% rate.
Lessons from the past.
Those who don’t learn from their mistakes are apt to repeat them.
Hi Cam,
This is more an intellectual discussion and I would appreciate your and any other readers input. We have had this giant mega rally from the lows which has been missed. In retrospect fundamentals and technicals diverged all the way up till now. So what do we do in order for us not to commit the same mistake again? I guess one way would be to follow the trend in a mechanical way if any market rises X% from the bottom go long. So if that is the case what is X% ?
The other issue that comes up is if a mania arises in any market for instances the growth stocks or the Nasdaq one would want to participate in the trend but not be the last person standing when the music stops. So ride the trend with a trailing stop X% below the price. If that is the case what should X% be?
Hard to exactly quantify x% but I am inclined to watch NDX for signs of a trend break instead
I agree with Cam.
(a) After +56%/+71% moves in SPY/QQQ I would be looking to reduce risk and less inclined to push my luck.
(b) Another way to look at it – if I had been left behind during the current rally, then attempting to catch the tail end amounts to compounding my original error. In other words, risk has shifted to the downside.
(c) Sure, it’s possible (even likely) the current rally has much further to go – but in my opinion any further sustainable upside will require a ‘reset’ in sentiment or price.
I propose monitoring:
1. ITB and SMH: leading indicators of econ activities.
2. TSLA: ultimate concept stock representing pinnacle of speculation.
TSLA price action is confirmation of ITB and SMH actions. If ITB and SMH go down, TSLA will not survive, normally. But if TSLA does not suffer, then we will know the bubble is still around.
Cam
Are long term Investments (stocks) a sell here, based on what you have show here? Yes, you have no idea about my portfolio, or risk tolerance etc.
The Trend Model is still in neutral. The long term model will turn bullish once the Trend Model turns bullish
Thanks.
Ken
Earlier in the year, circa March, you had opined about raising significant cash in portfolios. Are you still of the same opinion, i.e. keep selling and move into cash?
D.V. I’m one of the above portfolio mangers who has run to Europe as a saner and possibly safer market. This analysis by Cam is enlightening as to why the American markets may outperform. The big question is, does one opt for a decent understandable return or a possible bubble better one.
I once heard definition of a bubble is something a portfolio manger gets fired for not owning.
Thanks, Ken.
Ken
Cam is indicating one last thrust up, based on NDX, but is long term bearish. After reading multiple articles from Cam, he is not pounding the table for a continuing US bull market, but has been saying that we may be picking “pennies in front of a steam roller”.
It’s striking how poor breadth was this week. Poor breadth, like frothy sentiment, is not precise for timing but doesn’t inspire confidence either.
Trust your lying eyes – the Nasdaq isn’t losing momentum.
The same was said of GLD right about 12 days ago. It only took one of two days before the trend changed. The same for NDX on 2/20/20.
In case someone is following the stats, buying TQQQ at NDX all time high (ATH) on Friday as a long trade as suggested could work, but you’d need to stay with it and possibly endure through a large drawdowns of 10.94% to 14.51%. Those are the two other instances of post-March 2020- low and new NDX ATH buy on Fridays of 6/5/20 and then 7/10/20. Those trades exited after about 20 tradings days with 20.9% and 6.0% profits respectively. Unfortunately with a typical stoploss or trailing stops, you would have ended up with 2 losses. With a high stoploss or trailing stop however, you could end up with a high volatility event such as Feb 2020 and lose 25%.
Cam, I’m surprised you haven’t included the upcoming U.S. election in your analysis. With the election being so important it seems like markets could just maintain the status quo as we approach. It feels like investors (institutional and individual) are in a wait and see mode.
Both Brexit and the 2016 election caused concern in the approach and an strong rally afterward. It seems like the opposite would be a likely outcome this time around.
If Trump wins (or if it becomes clear that he will win) markets will probably sell of because he no longer needs to be stimulative or backing of free money since he’s won and doesn’t need to cater to that vote. Conversely, if Biden wins, everyone knows he’ll likely be oriented to free cash for the little guy and it could be a “sell the news” type event.
1. If I understand it correctly, options are: a. Hold on and possibly participate in a ‘possible bubble’ before it crashes, OR,participate in a convergence that leads to a possible retest of the lows. In either case, end point is the same. Not particularly appealing options or different from prior analysis.
2. Continuing narrowing of breadth is problematic.
3. I believe it’s time to trim/take chips off the table. Asymmetrical risk/reward.