Preface: Explaining our market timing models
We maintain several market timing models, each with differing time horizons. The “Ultimate Market Timing Model” is a long-term market timing model based on the research outlined in our post, Building the ultimate market timing model. This model tends to generate only a handful of signals each decade.
The Trend Model is an asset allocation model which applies trend following principles based on the inputs of global stock and commodity price. This model has a shorter time horizon and tends to turn over about 4-6 times a year. In essence, it seeks to answer the question, “Is the trend in the global economy expansion (bullish) or contraction (bearish)?”
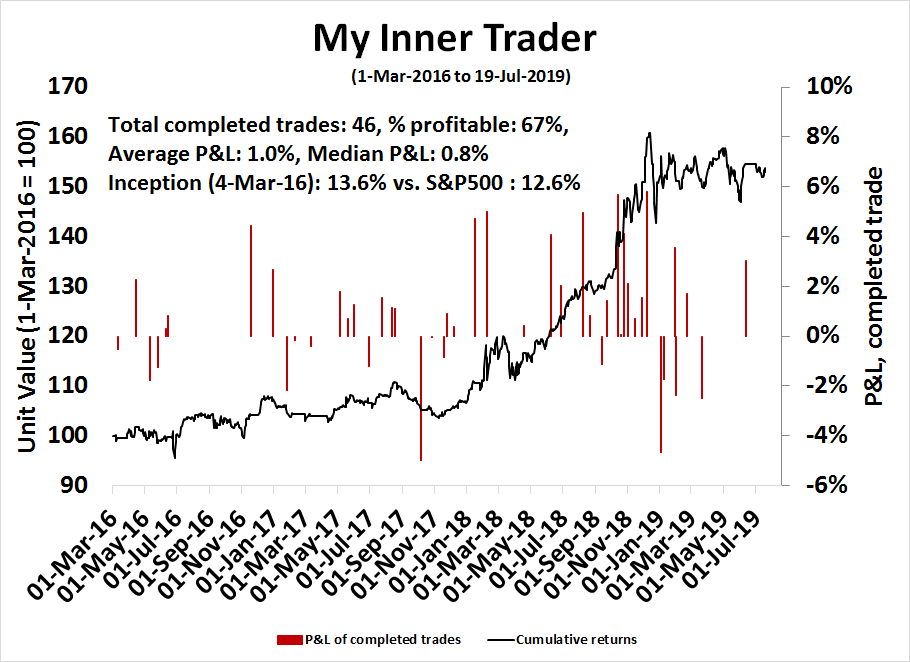
My inner trader uses a trading model, which is a blend of price momentum (is the Trend Model becoming more bullish, or bearish?) and overbought/oversold extremes (don’t buy if the trend is overbought, and vice versa). Subscribers receive real-time alerts of model changes, and a hypothetical trading record of the those email alerts are updated weekly here. The hypothetical trading record of the trading model of the real-time alerts that began in March 2016 is shown below.
The latest signals of each model are as follows:
- Ultimate market timing model: Buy equities
- Trend Model signal: Neutral
- Trading model: Bearish
Update schedule: I generally update model readings on my site on weekends and tweet mid-week observations at @humblestudent. Subscribers receive real-time alerts of trading model changes, and a hypothetical trading record of the those email alerts is shown here.
A well-telegraphed rate cut
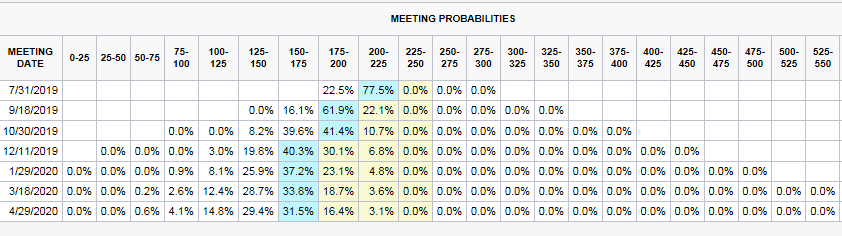
As we look forward to the FOMC meeting on July 30-31, the market is discounting a 100% chance of a rate cut, with the probability of a half point cut at 22.5%.
Analysis from Ned Davis Research reveals that an initial rate cut and no recession has historically lit a rocket under stock prices.
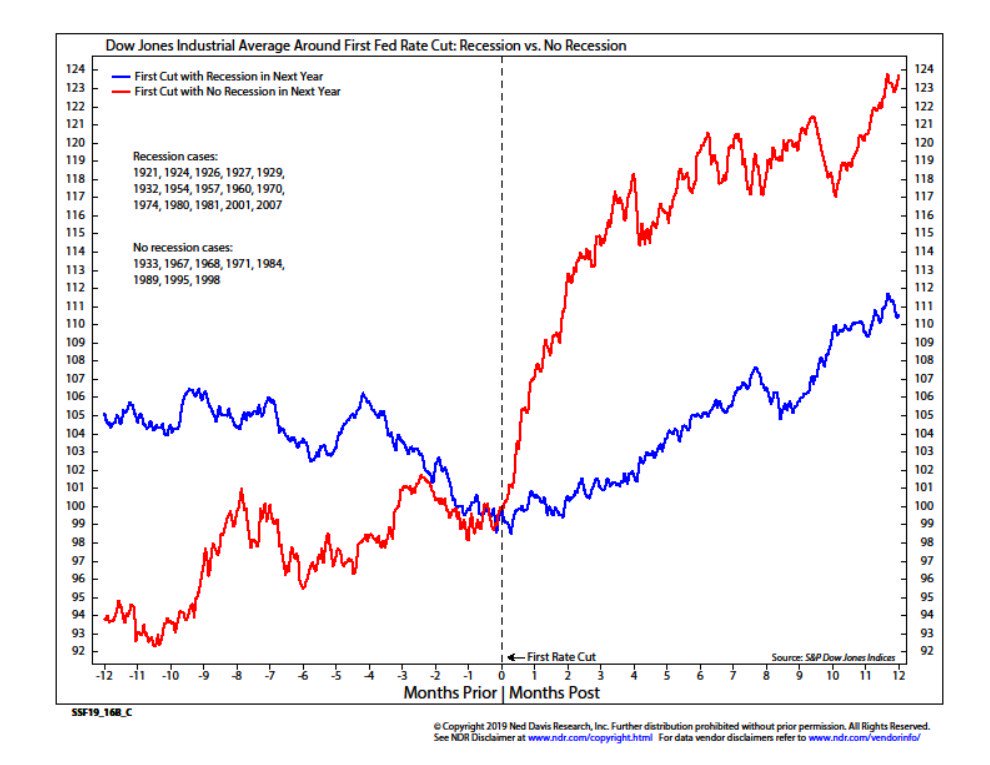
What will happen this time? Should investors be piling into equities in anticipation of a market surge?
Many reasons to cut
The Fed has good reasons to cut rates. Trade tensions are rising again. Bloomberg reported that Trump is threatening tariffs again after he arrived at an uneasy truce agreement in Osaka:
“We have a long way to go as far as tariffs where China is concerned, if we want. We have another $325 billion we can put a tariff on, if we want,” Trump said. “So, we’re talking to China about a deal, but I wish they didn’t break the deal that we had.”
China said Wednesday that further levies would complicate the negotiations.
“If the U.S. imposes new tariffs, this would create a new obstacle for U.S. and China trade negotiations, would make the road to coming to an agreement longer,” Foreign Ministry spokesman Geng Shuang told reporters in Beijing. “China still hopes to resolve U.S.-China trade frictions through consultation and dialogue.”
Trump and Xi called a tariff ceasefire and agreed to resume trade talks after meeting at the Group-of-20 summit in Japan in late-June, breaking a six-week stalemate. The U.S. president said he’d hold off on a threat to impose tariffs on an additional $300 billion in Chinese imports, and that Xi had agreed to buy large amounts of U.S. farm goods in exchange.
No such deal to increase agricultural purchases was made, Chinese officials familiar with the discussions said earlier. There hasn’t been any large-scale buys since the meeting in late June.
Not only are US-China trade tensions rising, a mini-trade war has erupted between Japan and South Korea. Japan is doing to Samsung what the US is doing to Huawei by restricted the exports of three key semiconductor components to Korea. In addition, the US has brewing trade disputes with other major trading partners like the EU and Japan.
The canaries in the trade coalmine are struggling. Singapore’s exports, which are often seen as a proxy for global trade, cratered 31.9% year-over-year in June.

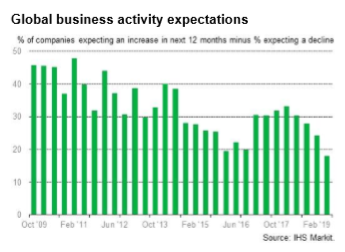
The latest FOMC minutes contained numerous references to the words “uncertain” and “uncertainty”, which is weighing on the business confidence and the investment outlook. IHS Markit reported that global business confidence is tanking. IHS Markit chief economist Chris Williamson noted that confidence in the US and China had fallen badly. “Optimism about the year ahead has sunk especially sharply in the US and China amid escalating trade tensions: sentiment in the US is down to its lowest since 2016 and in China to the lowest since 2009”.
The latest earnings report from cyclical bellwether and railway operator CSX provided another example (via Business Insider):
“The present economic backdrop is one of the most puzzling I have experienced in my career,” James Foote, CSX’s chief executive, told investors and analysts on a conference call. “Both global and US economic conditions have been unusual this year, to say the least, and have impacted our volumes.”
CFO Mark Wallace went even further with his economic warnings, urging a resolution to the ongoing disputes between the US and countries including China, Mexico, Europe and more.
“What would help in the back half would be a resolution or clarity on trade and tariffs,” he said, ” but that is obviously beyond our control.”
In addition, the Atlanta Fed’s Q2 GDP nowcast stands at 1.6%, and the New York Fed’s nowcast is 1.5%. That is a far cry from the Q1 GDP growth rate of 3.2%. As the economy undergoes a soft patch, the risk of a trade war induced recession is rising.
How far will the Fed ease?
It therefore makes perfect sense for the Fed to put through an insurance cut in this backdrop of soft growth and uncertainty. Recent speeches from Fed officials have confirmed a rate cut will be enacted at the July FOMC meeting. The bigger question is how far will the Fed ease?
Recent speeches and interviews Fed speakers provide some clues of the limits of the Fed`s easing cycle. St. Louis Fed president James Bullard stated that he is in favor of cuts, but thought that a 50 basis point cut in July was going too far. In addition, the WSJ reported that Chicago Fed president Charles Evans called for precautionary cuts of 50 basis points this year:
“The economy is solid. I don’t want to be talking down the state of the economy,” but there are rising uncertainties and inflation has been persistently below the official goal, Mr. Evans told CNBC.
The Fed needs to take action to push up inflation over the 2% target to affirm that the goal is truly symmetrical and can tolerate an overshoot in the wake of a persistent shortfall in inflation relative to the goal, he said.
“In order to get inflation up to two-and-a-quarter percent over the next three years I need 50 basis points more of accommodation. And in fact, maybe that’s not quite enough,” Mr. Evans said.
“From a risk-management standpoint, it makes sense that you might think that we are little bit more restrictive [with monetary policy] than we need to be, and we need to be more accommodative” to compensate for that, he said.
The market is discounting a 75 basis points in cuts by year-end. If an uber-dove like Bullard is not convinced about a 50 basis point cut in July, and Evans is not convinced that the Fed needs more than 50 basis points, how likely is the FOMC consensus far enough along to meet expectations of further easing in 2019?
There was an unmistakable sign that the Fed is getting ready to cut by 25 basis points at the July meeting. New York Fed president John Williams, who is a key member of the FOMC, made a speech last Thursday calling for a “go big or go home” style of monetary policy response to precautionary rate cuts:
The first: don’t keep your powder dry—that is, move more quickly to add monetary stimulus than you otherwise might. When the ZLB is nowhere in view, one can afford to move slowly and take a “wait and see” approach to gain additional clarity about potentially adverse economic developments. But not when interest rates are in the vicinity of the ZLB. In that case, you want to do the opposite, and vaccinate against further ills. When you only have so much stimulus at your disposal, it pays to act quickly to lower rates at the first sign of economic distress.
This brings me to my second conclusion, which is to keep interest rates lower for longer. The expectation of lower interest rates in the future lowers yields on bonds and thereby fosters more favorable financial conditions overall. This will allow the stimulus to pick up steam, support economic growth over the medium term, and allow inflation to rise.
The market reacted quickly and read those remarks to mean that the Fed was getting ready to cut by 50 basis points at the July meeting. By the end of the day, the New York fed issued a clarification that Williams’ speech was an academic based on 20 years of research, and it “was not about potential policy actions at the upcoming FOMC meeting”. This was an important signal that the Board believes that a 50 basis point cut was a quarter-point too far.
My base case scenario calls for a hawkish cut of 25 basis points at the July FOMC meeting, and hold out the possibility of another 25 basis points by December. Investors may need to be prepared to be disappointed by the Fed’s guidance in the wake of the July meeting.
The moral of this story is, there are limits to what monetary policy can do. Watch how the yield curve evolves in the wake of the FOMC meeting. Will it steepen, or flatten? What happens to bond yields further out in the curve even as short rates fall?
A technical warning
Marketwatch reported that technician Milton Berg recently issued a warning for the stock market based on his work on the bond market, as well as his proprietary equity market indicators. Berg is known to have worked with hedge fund giants like George Soros and Stanley Druckenmiller. He called the top in 1987, and went into the Crash 20% long. He also nailed the recent Christmas Eve bottom of 2018. In the interview, Berg revealed that he went short the market on July 2.
Berg told digital financial media group Real Vision in an interview that there’s one big reason he’s out of the market for now: “We have a list of more than 100 indicators that we match to previous market peaks and of all these 100 only two are inconsistent with levels seen at market peaks.”
Here is the kicker. Both stock and bond market indicators are emitting warning signals. He turned bullish at the December 24 bottom as price momentum indicators screamed bullish, and those buy signals remain valid today. However, he said that he is uncomfortable with the rally because the stock market is behaving like a “bear market rally” because of the lack of participation of small caps and the broader global markets. He further pondered if the bull market that began in 1982 was attributable to falling bond yields. The 10-year Treasury has fallen from 15% in 1982 to under 2% in 2019, which provided a boost to stock prices. However, bond yields may be nearing a secular turn, which will cause problems for stock investors longer term.
Still, Berg says there’s is one thing that doesn’t quite add up for that view that stocks are nearing a peak. Thirty-year U.S. bonds on a 6- and 12-month basis are doing far better than they’ve ever done at a final market top, he notes.
Berg has also turned bearish on the bond market, where investors have been piling in on fears of a recession. State Street Global Advisors recently reported that bond exchange-traded funds drew a record $25 billion in June, beating by a huge margin a prior record in October 2014.
He says the bond conundrum may also send another message to investors. That the final leg of this stock market rally coincides with a bond market rally, which will signal a peak for stocks.
Policy uncertainty ahead
Notwithstanding any technical concerns about stocks, much of the equity market uncertainty revolves around Trump’s political strategy going into the 2020 election. Will he try for a quick deal with China by papering over the differences to kick start the American economy, or will he decide to continue bashing China as part of election strategy?
Politico reported Trump advisor Larry Kudlow conceded the US and China may never conclude a trade deal:
The United States and China may never be able to reach a trade deal because of the difficulty in resolving the relatively few remaining issues on the table, a top U.S. official said Tuesday.
During an interview at CNBC’s Capital Exchange event in Washington, White House chief economic adviser Larry Kudlow said he was an optimist by nature and still believed a deal was possible. But he used a football analogy involving his favorite team to illustrate the potential for the Trump administration to fall short.
“It’s like being on the seven-yard line at a football game,” Kudlow said. “And as a long suffering New York Giants fan, they could be on the seven and they never get the ball to the end zone.”
“When you get down to the last 10 percent, seven-yard line, it’s tough,” he added, referring to the negotiations.
A Bloomberg article offered the viewpoint of Bank of Canada Governor Stephen Poloz, who believes that rate cuts are no panacea. There are limits to what central bankers can do in the face of trade tension induced uncertainty.
An escalation in trade tensions looks to be on the minds of bond investors, but stocks are shrugging off this possibility, according to Canada’s central bank chief.
“To put a fine point on it, the bond market pushes yields down and the stock market goes back as if nothing bad’s going to happen,” he said. “And yet the underlying shock would be clearly very bad for economic growth, would be bad for the level of productivity, would be quite harmful to profitability.”
More disconcerting news came from the US Treasury, when it put Ireland, Italy, and Germany on its watch list of currency manipulators. This is a signal that Trump may be seeking to start a currency war in addition to a trade war as his rhetoric about USD strength is becoming increasingly belligerent.
Treasury found that nine major trading partners continue to warrant placement on Treasury’s “Monitoring List” of major trading partners that merit close attention to their currency practices: China, Germany, Ireland, Italy, Japan, Korea, Malaysia, Singapore, and Vietnam.
A Bloomberg article which highlighted recent comments by Treasury Secretary Mnuchin have put the market on edge as to the possibility of currency intervention.
Foreign-exchange strategists say the risk of a U.S. move to weaken the dollar has risen after Treasury Secretary Steven Mnuchin said there’s no change in the nation’s currency policy “as of now.”
“This is something we could consider in the future but as of now there’s no change to the dollar policy,” he said in an interview Thursday following a Group-of-Seven finance ministers’ meeting in Chantilly, France.
In the eyes of Shaun Osborne at Scotiabank and Juan Prada at Barclays, the remarks left the door open to action in the foreign-exchange market. The possibility has drawn the attention of Wall Street analysts as President Donald Trump has intensified his criticism of the Fed and other countries’ currency practices. He hinted at intervention in a tweet July 3, saying Europe and China are playing a “big currency manipulation game,” and said the U.S. should “MATCH, or continue being the dummies.”
Earnings, earnings, earnings!
For equity investors, this begs the question of how much the Fed can do to boost stock prices in the absence of greater certainty about the global trade environment. It is unclear whether precautionary rate cuts will achieve the soft landing that the Fed is seeking. We are now seeing panicked calls like the one from Jim Bianco for deep and rapid rate cuts in order to avoid an earnings recession.
The bottom line is that stock prices depend on two factors, the P/E ratio, and the E in the P/E. If the Fed cuts rates, a lower discount rate boosts the P/E multiple, which is bullish for stock prices.
Investors will also have to monitor the E in the forward P/E ratio. The history of estimates and stock prices shows that they move more or less in lockstep. Current conditions indicate that estimate revisions are flattening out, which could indicate some sloppiness ahead for the market. In addition, elevated forward P/E valuation compared to its own history leaves little room for error, should the earnings outlook disappoint.
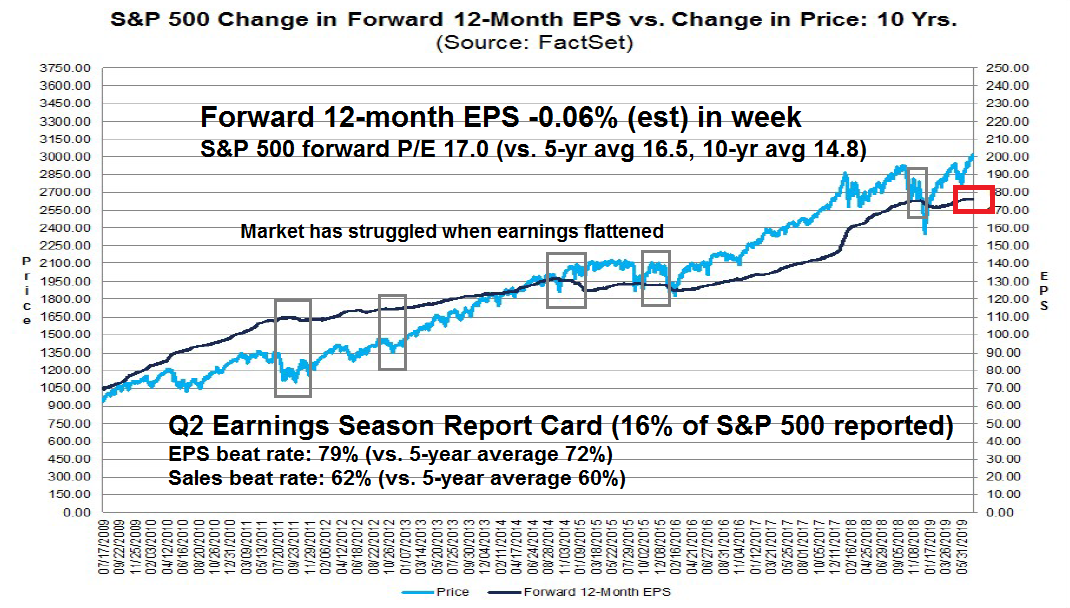
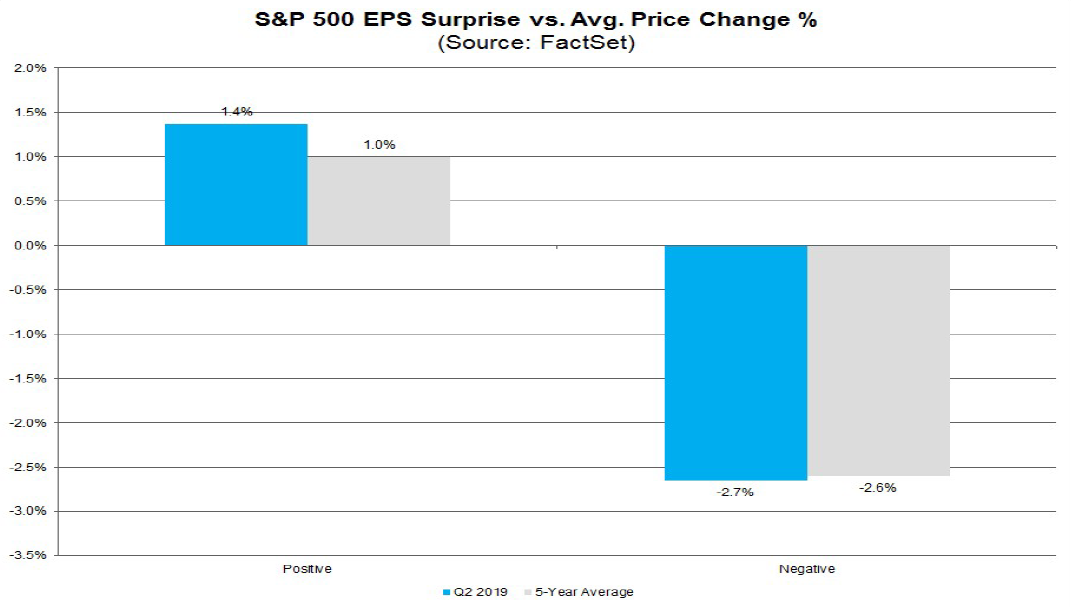
That said, it is still very early in the earnings season. So far, the EPS and sales beat rates are slightly ahead of their historical averages. The market’s reaction to beats and misses are also in line with historical experience.
The rate of earnings disappointment may rise. CNBC highlighted research from Well Fargo which indicated that most of the companies with the greatest exposure to China have not reported yet:
Ahead of a big week for technology earnings, the Wells Fargo Investment Institute’s Scott Wren predicts the trade war blame game is going to intensify.
Since S&P 500 companies began reporting second quarter earnings, more than a third of them have cited tariffs or the U.S.-China trade war as a headwind to profits.
Wren predicts the number will start rising sharply in the coming days as more U.S. companies with direct exposure to Asia report numbers.
“The 800-pound gorilla in the room and the easiest target out there is trade uncertainty,” the firm’s senior global equity strategist told CNBC’s “Trading Nation ” on Friday.
“You could think of a number of sectors where companies whose earnings are not great at least on a year-over-year comparison basis are going to use that scapegoat.”
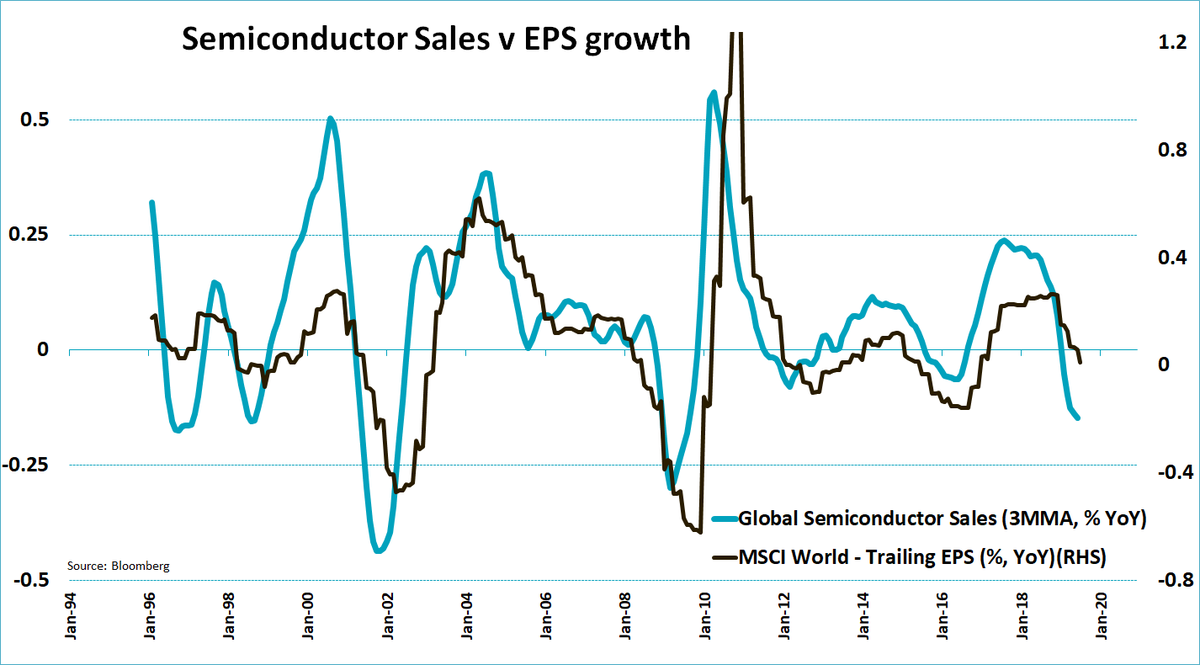
Other contemporaneous indicators of the global cycle, like semiconductor sales, are pointing to some softness in global earnings.
The copper to gold ratio, which is a de-trended global cyclical indicator, is also signaling a risk-off environment.

In short, how the market reacts to Q2 earnings will be a crucial test for both bulls and bears. The downbeat guidance from cyclical companies like Alcoa and CSX is particularly disturbing for the growth outlook.
To be sure, these results are highly preliminary, and I want to keep an open mind. In the absence of any macro related shocks, these results suggest that stock prices are likely to either consolidate sideways in a choppy manner, or correct in the next few weeks.
Stay tuned.
The week ahead
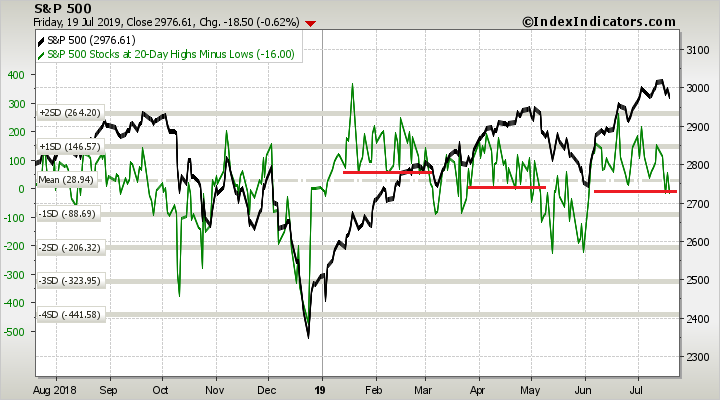
The SPX ended the first major week of Q2 earnings season in the red, and resting on uptrend support. The stochastic has recycled downwards, which a likely pullback signal. Should trend support break early next week, the next major support can be found at about 2950, with additional support at the first Fibonacci retracement level of 2910.

Medium term (1-2 week) breadth indicators are also perched on a key support level. Past downside breaks have typically resolved with deeper corrective action.
Market internals favor the bears. The analysis of market cap leadership shows that mid and small caps have broken key relative support levels. The only leadership are the NASDAQ stocks, and narrow leadership is another warning sign of an unsustainable advance.
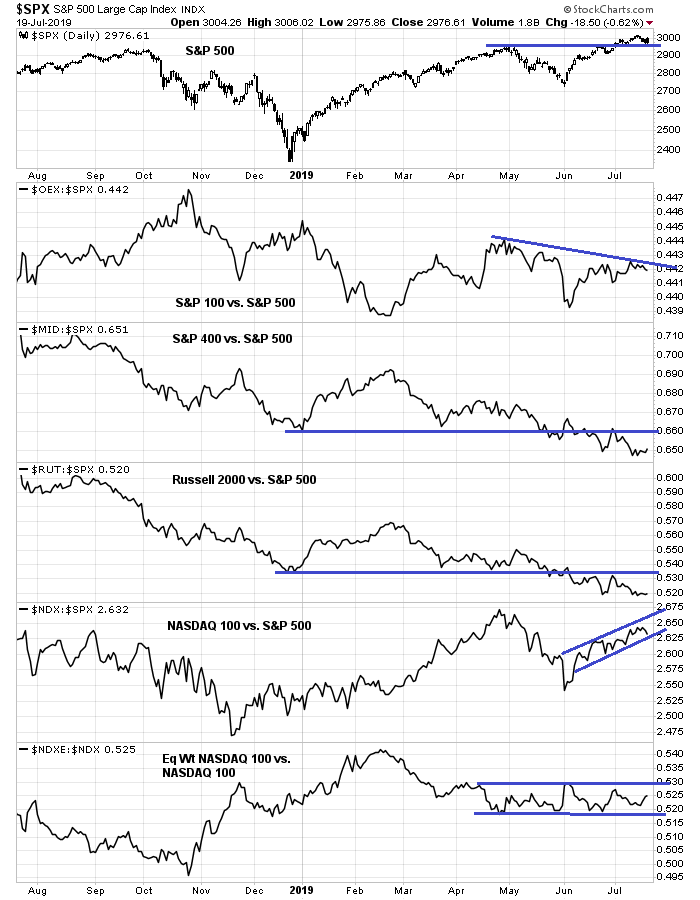
The analysis of NASDAQ 100 reveals another ominous divergence. Even as the NASDAQ 100 broke out to fresh all-time highs, and the NDX led the market upwards, the new high to new low spread was narrowing, and new lows managed to exceed new highs last week.

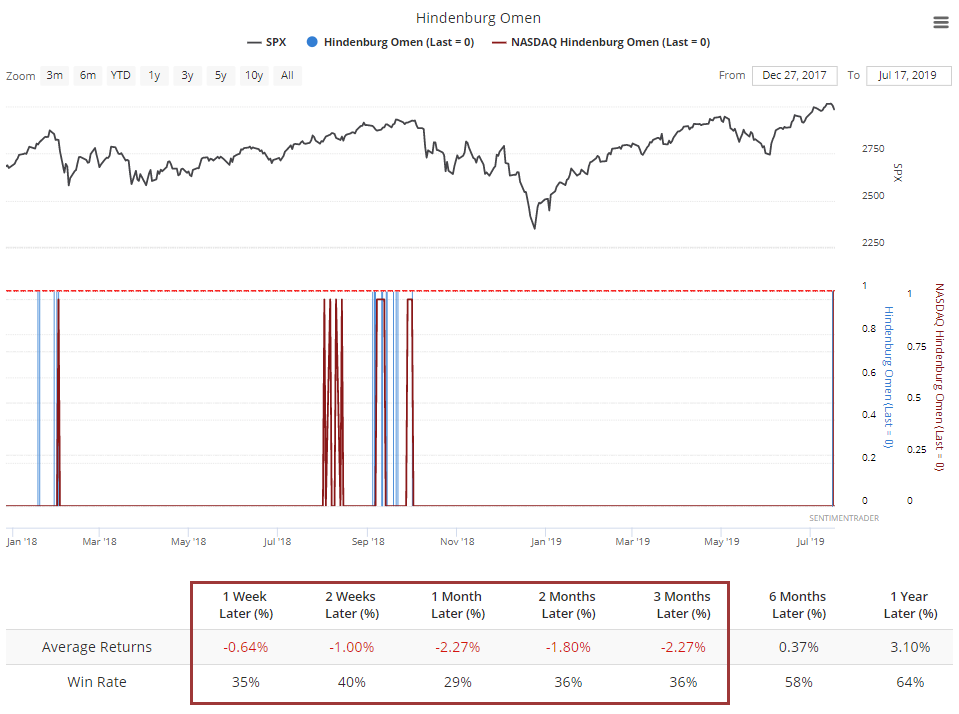
SentimenTrader pointed out that the market flashed a Hindenburg Omen last week. While the naming of the Hindenburg Omen represents a high degree of hyperbole, and it does not always forecast a market crash, the Omen is an indicator of a high degree of divergence in market internals. There are too many stocks making highs and lows at the same time. The historical record shows that such signals has resolved themselves with subpar short-term returns, though a crash is unlikely.
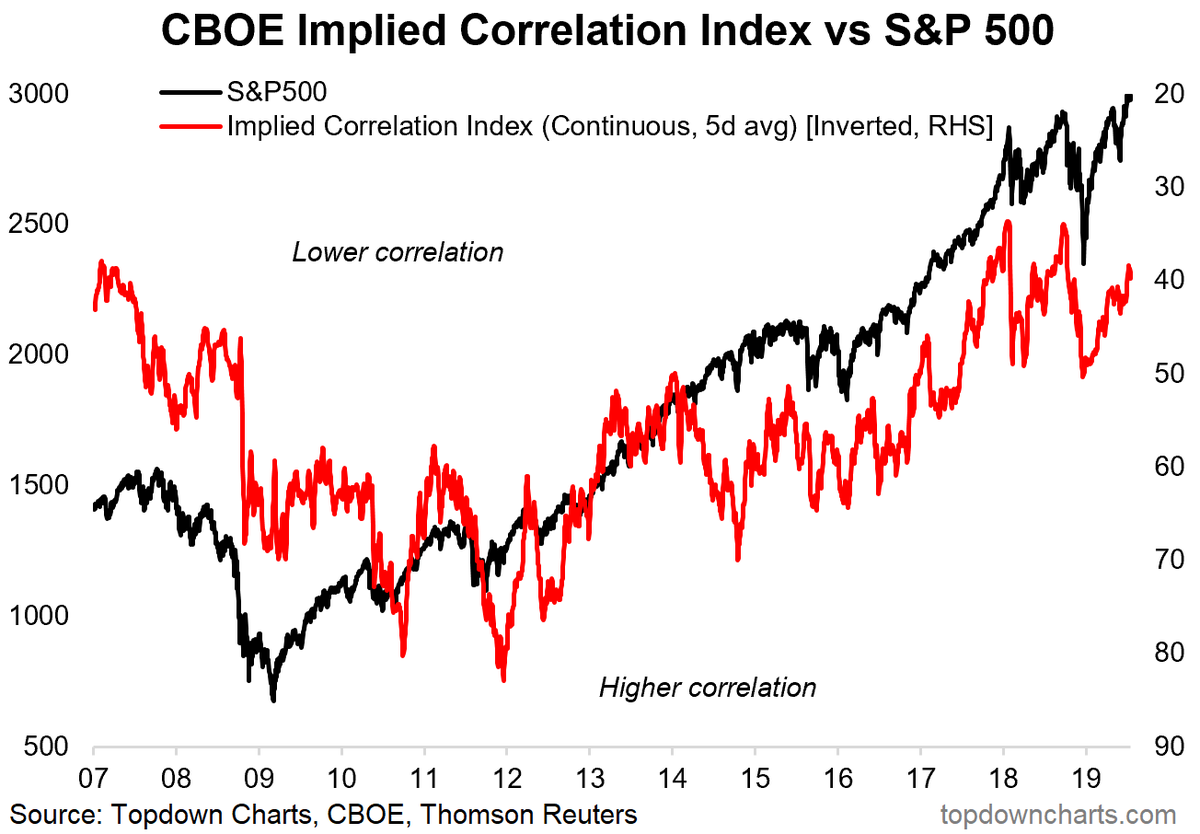
Another way of thinking about the divergence between new highs and lows is implied correlation. Callum Thomas pointed out that the stock market has encountered difficulty advancing when the CBOE Implied Correlation Index (right, inverted scale) is low.
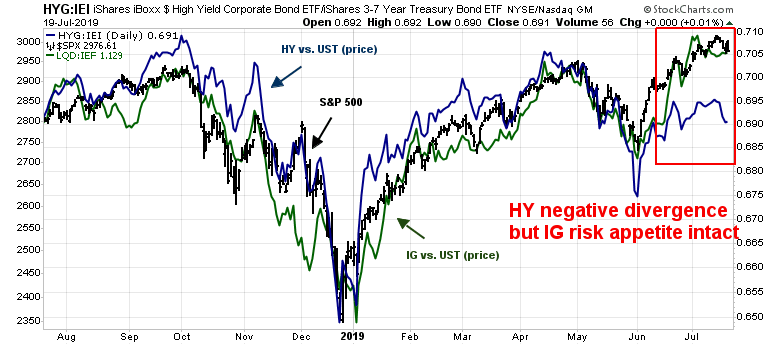
Similar levels of internal divergences can also be found in the credit markets. While high yield, or junk, bonds are flashing a negative divergence with stock prices, investment grade credits have so far confirmed the equity market advance.
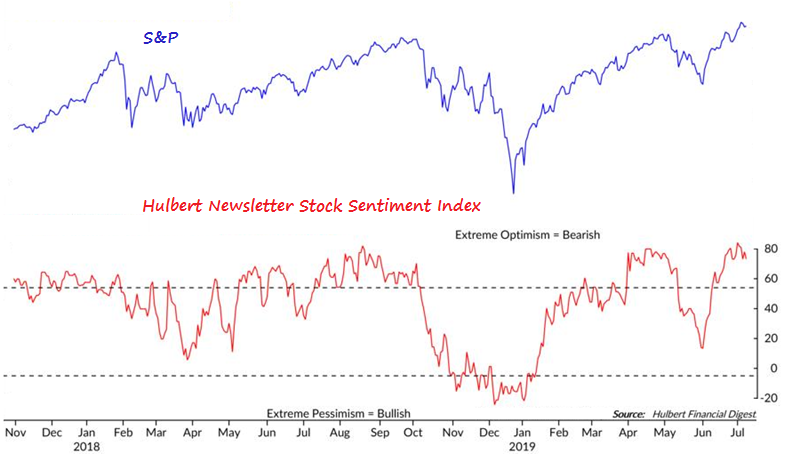
In addition, Mark Hulbert’s Hulbert Newsletter Stock Sentiment Index is flashing a crowded long reading, which is contrarian bearish.
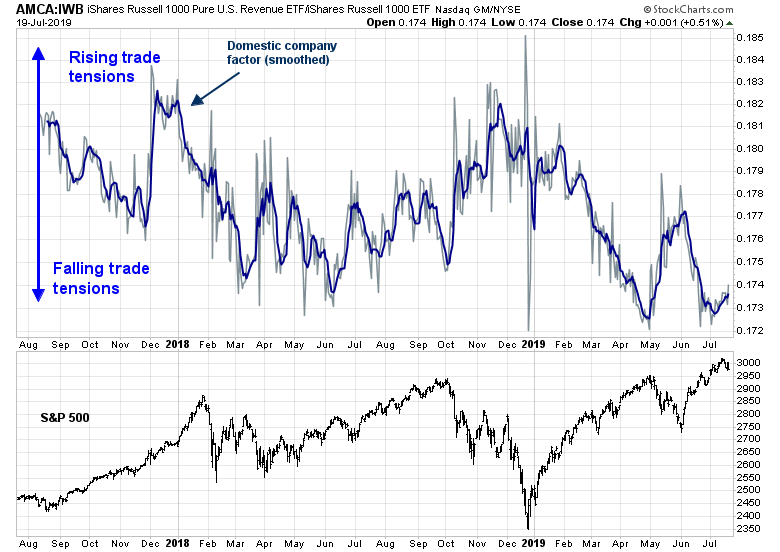
Equally disconcerting is the performance of our trade war factor, which is showing signs of complacency. The shares of companies with foreign sales exposure are outperforming even as negotiations are at a standstill.
The nascent inverse head and shoulders formation of the US Dollar Index is also worrisome. While good technicians know that a head and shoulders pattern is not considered valid until the neckline breaks, a USD rally is likely to exacerbate trade tensions, and raise the odds of a currency war.

My inner investor remains neutrally positioned at the asset allocation targets specified by investment policy. My inner trader is still short. He may add to his position next week should market internals deteriorate further.
Disclosure: Long SPXU
Cam…I was unfamiliar with Berg’s work, so looked into him. He also said we were entering a 30 yr bear market
on 5/12/16, spx @ 2100, and then went bullish in nov, 2018, just before mini crash of 12/2018. Not sure his work carries that much weight.
The devil often lies in the details. The one thing that doesn’t quite add up (which I take to mean the two indicators out of 100 that remain inconsistent with levels seen at prior market tops) – that has me thinking Berg is front-running his model. Maybe it’s nothing – or maybe it’s everything.
For those of you who follow Jason Goepfert’s sentiment work, here’s an interesting take from Jeff Miller.
https://www.dashofinsight.com/weighing-the-week-ahead-are-you-part-of-the-dumb-money/
Miller makes sense and I read his missive every week. But he is not focused because he comes from academia.
On the long term superior returns of some of these investing gurus (Buffet, Soros, and a long list), these types of returns will not be matched in the future. Many of the gurus acted on insider info (illegal) and employed tax schemes (quasi-illegal) to boost the numbers. Buffet in his early days also did some immoral things to the employees of the acquired companies. I don’t put too much weight on these guy’s thinking. A search on James Simmons will tell you what he is thinking today. The game has changed, so he is not much involved in investing anymore. Actually today’s small investors should beat big investors by a wide margin with both hands down.
The trend is already very clear for equity investors, mainly because of demographics. Demographics has ballooned the balanced sheets of CBs, resulting in permanent lower IRs and lower GDP growths. Cheap money encourages more corporate buybacks. Companies like TXN, HD, and others have a very good buyback program. Overall every company with a decent capital structure will be winners.
I would agree that their types of returns will not be matched anytime soon – but only in the sense that it’s not possible to duplicate the conditions under which those returns were earned.
Each generation tends to underestimate the ingenuity and ambition of the next. Tomorrow’s investors will find a way to earn their own outsized returns – we just don’t yet know how they’ll do it.
Cam, may I interpret your current tape-read of the market being?
– cautious on the short term horizon; and
– add long on market weakness for medium/longer term gain
That sounds about right