Mid-week market update: Even as the bears were all lined up to push prices down last Friday, the bulls managed to make a goal-line stand and retain control of the tape. The index is tracing out a triangle pattern and testing resistance, while exhibiting negative RSI divergences.
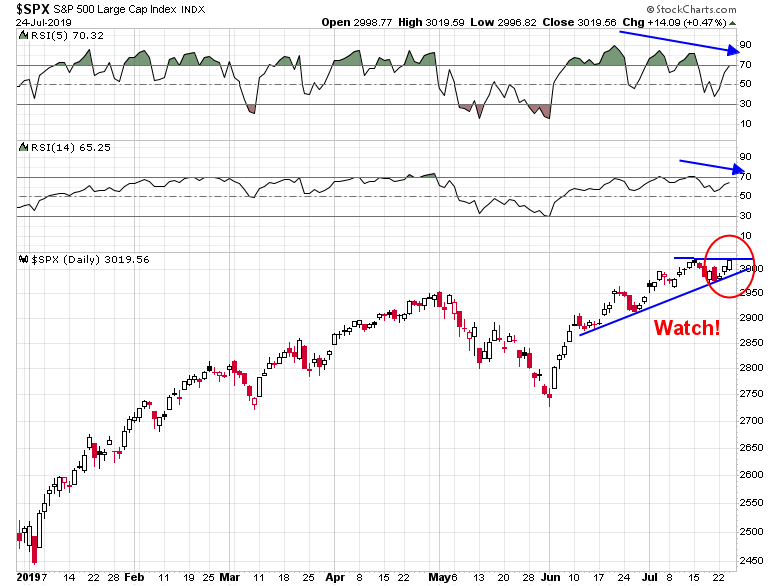
In addition, other cautionary signs can be found elsewhere. While I would not necessarily discount an upside breakout to further fresh highs, current conditions argue for limited upside potential.
USD strength warning
One of the warnings come from the inverse head and shoulders breakout of the USD Index, and conversely, the head and shoulders breakdown of the EURUSD exchange rate.

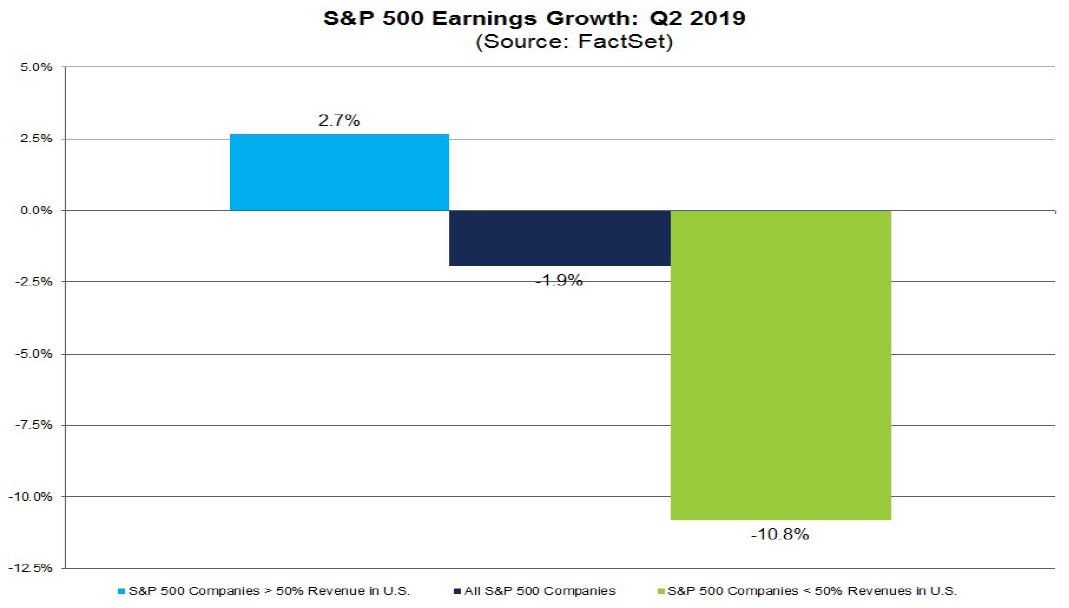
The upside break in the USD is significant for two reasons. John Butters at FactSet pointed out that the best earnings growth is coming from companies with the greatest foreign exposure. A strong greenback will create sales and earnings headwinds for large cap multi-nationals.
As well, an upside technical breakout in the USD will exacerbate the risks of a currency war. Trump’s desire for a weak dollar is well-known, and this development will heighten the risk of heightened tensions.
The Robert Mueller hearings before Congress may be a trigger for a change in volatility regime. In the past, Trump has responded to threats with responses on two familiar topics, trade and border security. The last example was his surprise initiative to impose a blanket 5% tariff on all Mexican imports unless Mexico cooperated on restricting illegal crossings.
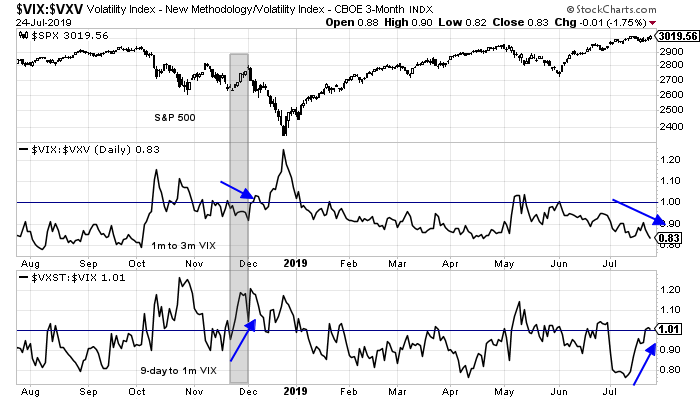
Nervous internals
Even as the SPX hears its all-time highs, internals show signs of disquiet. Short-term volatility term structure, defined as the ratio of the 9-day VIX (VXST) to the one-month VIX (VIX) has inverted, indicating nervousness. On the other hand, the 1-month to 3-month VIX (VXV) remains upward sloping, indicating complacency. A similar divergence occurred in November 2018 when the two diverged, and it was resolved with a December market sell-off.
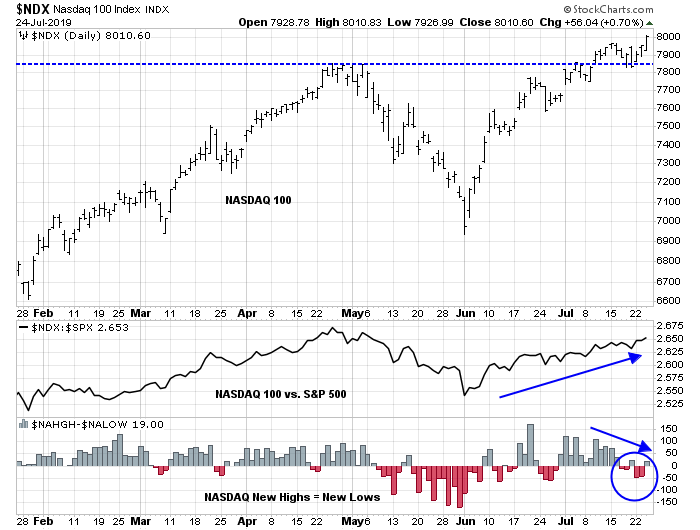
NASDAQ stocks remain the market leaders, but NASDAQ 100 volatility has fallen dramatically, and it is now below the level of low volatility stocks as a sign of complacency. The bottom panel shows the spread between NDX and SPX volatility (purple line). The market topped out the last two times the spread fell to this level.

Market breadth is also flashing yellow flags. Even as the NASDAQ 100 rose on Monday and Tuesday, there were more lows than highs on both those days – which is another negative divergence to be wary of.
In addition, NYSI is falling while new lows are expanding, which is a sure sign that the bulls are struggling.

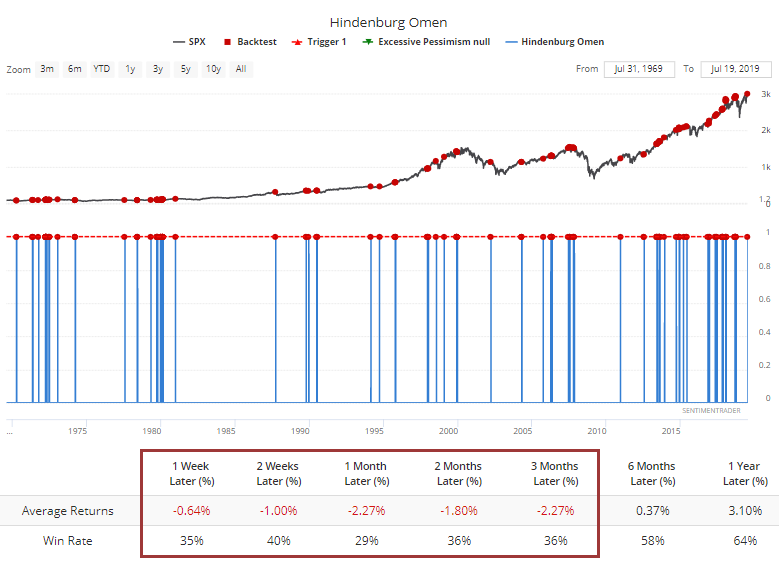
Jason Goepfert at SentimenTrader observed that the Hindenburg Omen, which measures internal breadth divergence, has been triggered on both the NYSE and NASDAQ:
When we see these kinds of conditions, with coincident signals on both exchanges for the first time in months, it has been exceptionally hard for the indexes to keep rising.
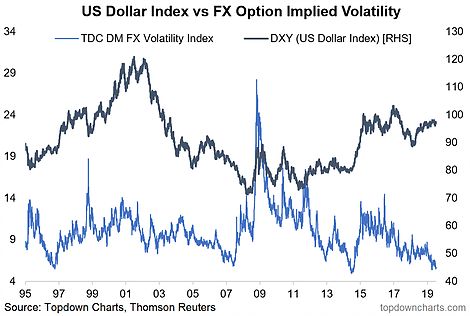
Callum Thomas of Topdown Charts observed that USD volatility is near record lows. Such conditions are similar to a Hindenburg Omen like bull/bear bifurcation, which could be a signal for a sharp reversal.
Historically this type of trading often precedes either a turning point, a large/violent move, or both.
The market psychology and macro realities that create this type of market is basically exactly what we see right now: significant division between bulls and bears, and competing/conflicting macro data and central banking outlook.
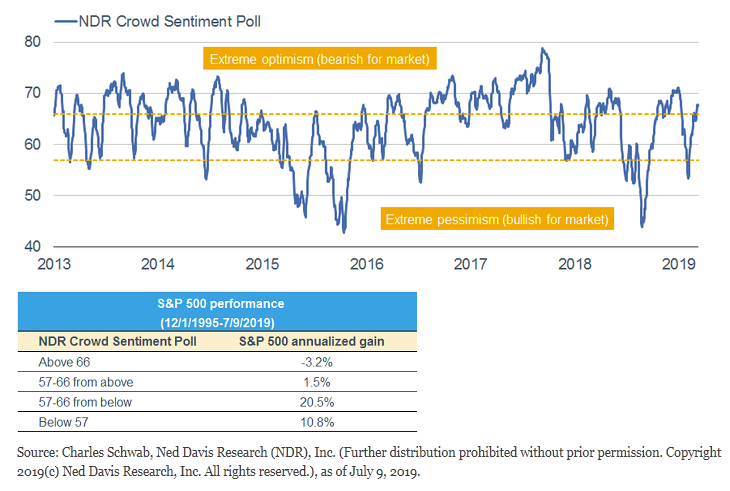
Liz Ann Sonders at Charles Schwab also pointed out that NDR Crowd Sentiment is becoming very stretched, which is also contrarian bearish.
I could go on, but you get the idea. None of these factors, when considered in isolation, are necessarily actionable sell signals. However, the combination of all these cautionary flags indicate that the risk/reward ratio is tilted to the downside.
A tactical call
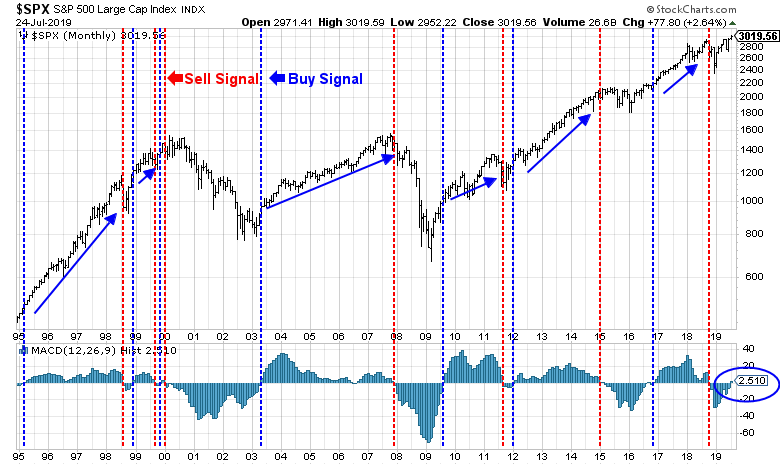
Just to make it clear, this is a tactical call and I am not making the case for a bear market. The market remains on the cusp of a long-term MACD buy signal, but much depends on how the SPX closes at month-end, and whether the buy signal is confirmed by other major indices.
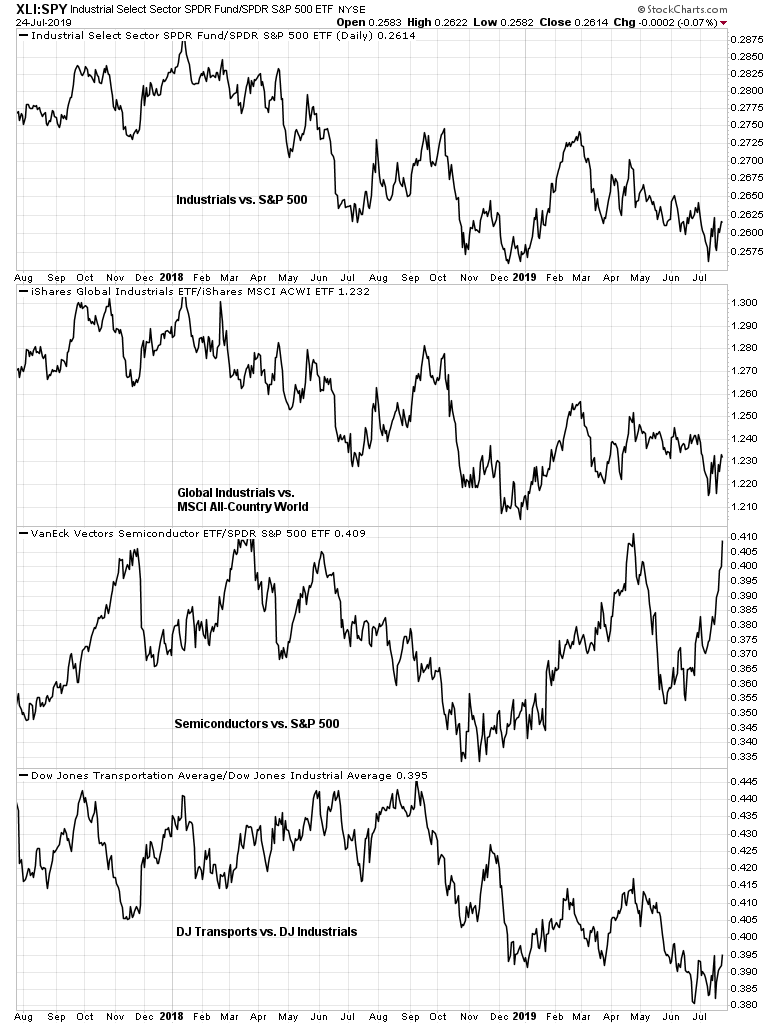
As well, cyclical stocks have caught a bid, which is constructive for the growth expectations.
My inner investor is neither bullish nor bearish. His asset allocation is roughly at the levels dictated by investment policy goals.
My inner trader remains short the market. He will cover his short if the market decisively breaks up to new highs, and add to his short position should it break down through support.
Disclosure: Long SPXU
Cam-
Is it possible that with so many short-term contrarian signals flashing + so much media attention being directed at them that the true contrarian move has been obscured – fading the record ytd outflows from equity funds + defensive positioning of BAML fund managers?
Global fund managers surveyed by BAML, not BAML fund managers.
Value your analysis more than any other. Still, sounds like you are moving toward the fridge, where you keep the humble pie.
EURUSD has come down to support at 1.112 – 1.113 level while daily RSI reaches oversold level. EURUSD “should” bounce from here in the short term.
https://www.tradingview.com/x/7STpgrvd/
.
Weekly EURUSD shows RSI bullish divergence. Until that’s broken, the longer term trend “should” be up.
https://www.tradingview.com/x/U5lJO4c5/
Cam,
SentimenTrader put this out one today:
https://twitter.com/sentimentrader/status/1154508764575219714
Are the stats highlighted accurate?
“John Butters at FactSet pointed out that the best earnings growth is coming from companies with the greatest foreign exposure”.
Does the graph show the opposite?
I apologize. I misread the chart.
I stand corrected.