Preface: Explaining our market timing models
We maintain several market timing models, each with differing time horizons. The “Ultimate Market Timing Model” is a long-term market timing model based on the research outlined in our post, Building the ultimate market timing model. This model tends to generate only a handful of signals each decade.
The Trend Model is an asset allocation model which applies trend following principles based on the inputs of global stock and commodity price. This model has a shorter time horizon and tends to turn over about 4-6 times a year. In essence, it seeks to answer the question, “Is the trend in the global economy expansion (bullish) or contraction (bearish)?”
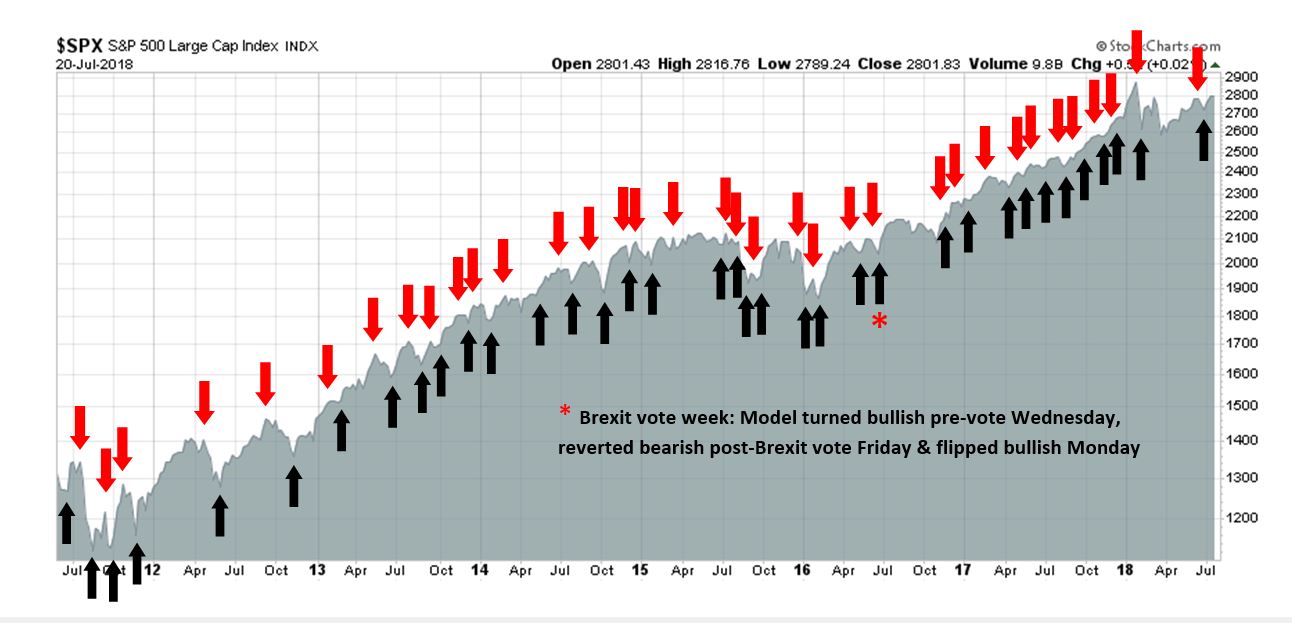
My inner trader uses the trading component of the Trend Model to look for changes in the direction of the main Trend Model signal. A bullish Trend Model signal that gets less bullish is a trading “sell” signal. Conversely, a bearish Trend Model signal that gets less bearish is a trading “buy” signal. The history of actual out-of-sample (not backtested) signals of the trading model are shown by the arrows in the chart below. The turnover rate of the trading model is high, and it has varied between 150% to 200% per month.
Subscribers receive real-time alerts of model changes, and a hypothetical trading record of the those email alerts are updated weekly here.
The latest signals of each model are as follows:
- Ultimate market timing model: Buy equities
- Trend Model signal: Neutral
- Trading model: Bullish
Update schedule: I generally update model readings on my site on weekends and tweet mid-week observations at @humblestudent. Subscribers receive real-time alerts of trading model changes, and a hypothetical trading record of the those email alerts is shown here.
The Zen of Bull and Bear
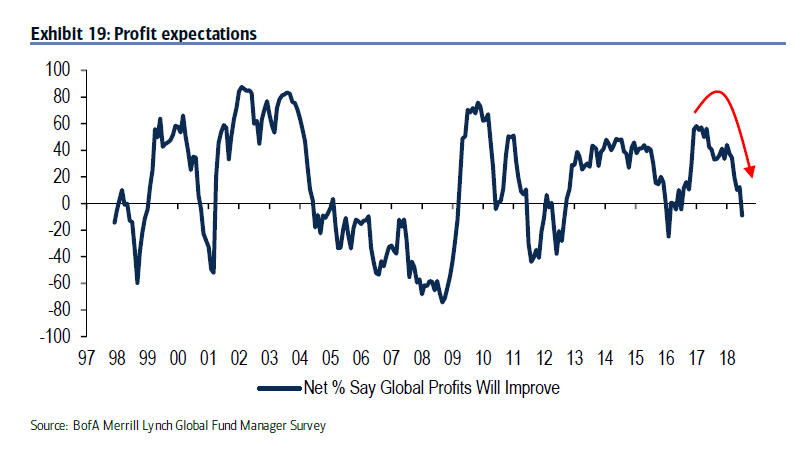
The latest BAML Fund Manager Survey shows that institutional managers have turned decidedly cautious on the outlook for the global economy. Profit expectations are tanking, positioning has turned more defensive, as global equity weights are being trimmed, and bond weights are rising, though managers remain underweight the asset class.
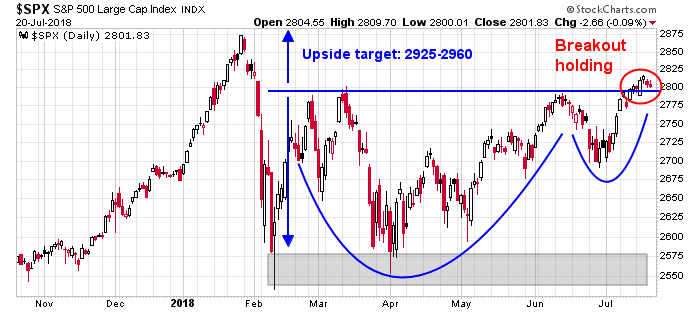
At the same time, the SPX has staged an upside breakout from a cup and handle formation, with an upside target of 2925-2960. The bullish surge is supported by a recovery in both European and China-related markets.
Who is right, the bulls or the bears? How about both? The difference may be just a question of different time horizons.
A case of institutional cautiousness
I am certainly sympathetic to the latest round of institutional cautiousness. Accounts that take weeks or months to trade in and out of positions should be de-risking their portfolios. While I am not suggesting the clients should “sell everything”, they should be adjusting their risk profile to a neutral position, especially if their equity betas are above their targets.
There are numerous signs that the American economy is in the late stages and an expansion, and a recession could begin as soon as H2 2019. A number of my long leading indicators, which are designed to spot a recession a year in advance, are flashing warning signals. My long leading indicators are classified into three categories: household, corporate, and monetary indicators.
Among the household indicators, the disappointment in housing starts is a warning sign. I would add the caveat that this is a noisy series, but a downturn in this highly cyclical industry has occurred ahead of past recessions.

That said, real retail sales remain healthy, indicating that the household sector is still in good shape. This is not a time to panic about an imminent recession.
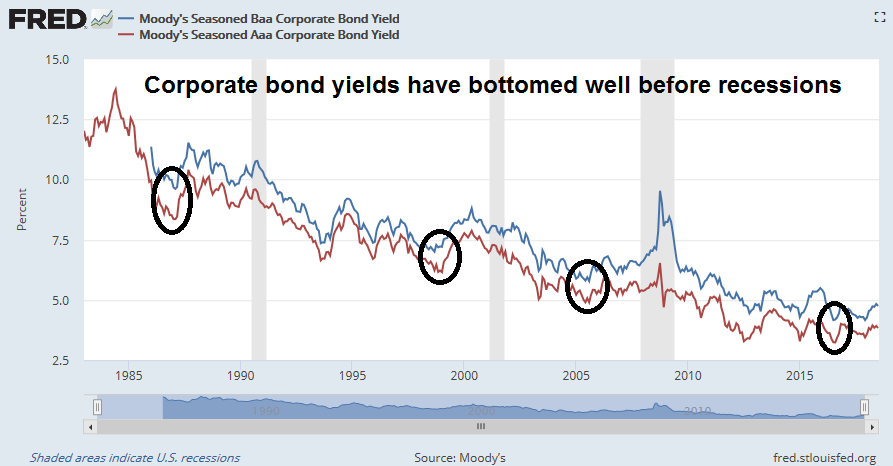
Among the corporate indicators, corporate bond yields have tended to bottom well ahead of past recessions. This indicator tends to be very early, therefore a bottom in yields should not be interpreted as a reason to panic, just a sign of a late cycle expansion.
Other elements of the corporate sector are not signaling caution. So far, corporate profits, another long leading indicator, are not rolling over. In addition, there are no signs of a credit squeeze, which is a pre-condition for a recession.
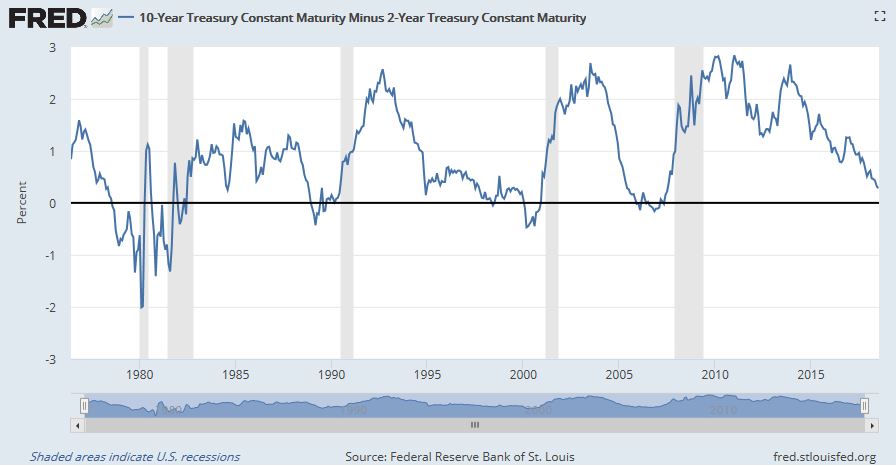
The monetary long leading indicators are the most problematical. The yield curve, whether measured as the 2-10 spread or the 10-30 spread, is flattening. In the past, an inverted yield curve has been an uncanny predictor of recessions. As usual, the Fed has trotted out a series of excuses why the yield curve is displaying a false signal (see (Don’t fear) the yield curve). Moreover, there has been growing disagreement between the regional Fed Presidents, who have voice concerns about the flattening yield curve, and the Fed governors, who have found reasons to ignore its signal. Historically, it is the latter group that has held the greatest power in determining monetary policy. At the current rate of raising the Fed Funds target by 0.25% every three months, the yield curve is likely to invert late this year, indicating a recession in late 2019.
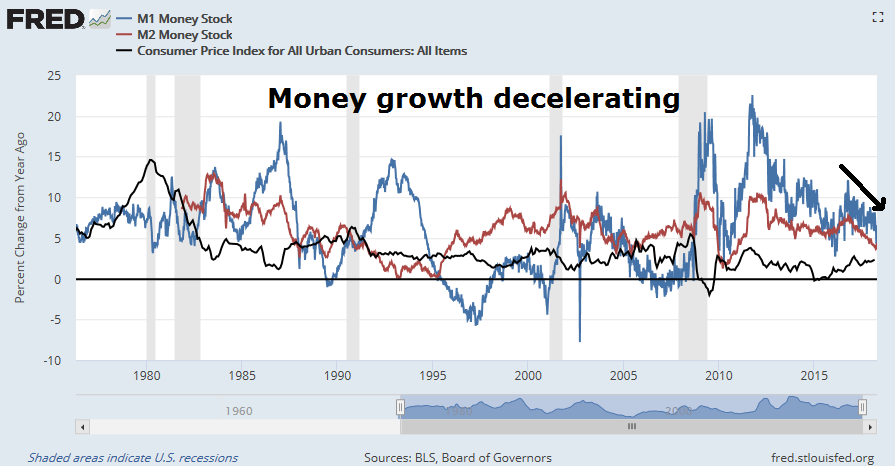
Even if we were to discount the predictive power of the yield curve because of the Fed`s QE program that affected the long end of the curve, real money supply growth, measured as either M1 or M2, has turned negative ahead of past recessions. The Fed`s policy of normalizing monetary policy has seen money supply growth decelerate. While the data is very noisy, both real M1 and real M2 growth are decelerating rapidly and are on the verge of turning negative.
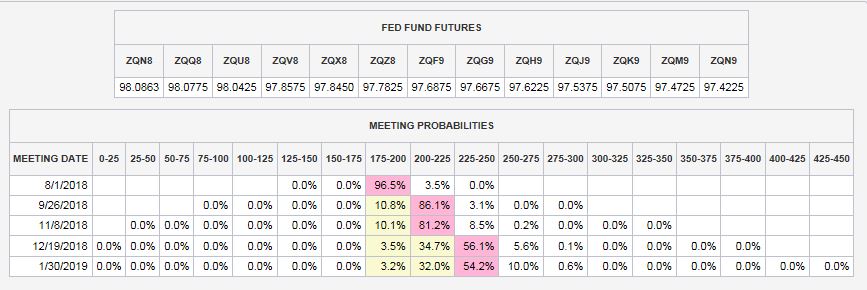
While I am not in the habit of anticipating model readings, there are signs that economic momentum is slowing, and the current path of monetary policy is setting the economy up for a recession to begin in H2 2019. The CME`s latest market derived expectations show one quarter point rate hike in September, followed by a second in December. Such a policy path is likely to invert the yield curve and drive real money supply growth negative some time this year.
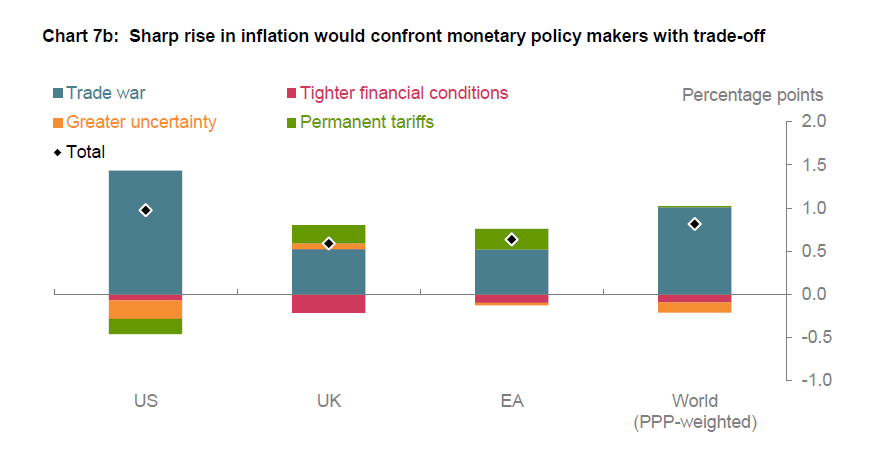
Notwithstanding the market’s expectations, the path of policy normalization appears to be set on a pre-determined path, especially when viewed in the context that the current real Fed Fund rate remains negative indicating a highly accommodative policy. Moreover, the Fed has made it clear that it is uncertain about how to adjust policy in the event of a trade war, and it will take a wait and see approach before reacting. A recent BOE study that modeled the effects of a full-blown global trade war found that inflation would spike, which would put policy makers in the uncomfortable position of deciding whether to ease in the face of rising inflation, however transitory it may seem.
Similarly, Bloomberg recently highlighted a study indicating problematical inflationary pressure facing the Fed in the event of a trade war:
A multi-colored graphic that’s made the rounds at the Federal Reserve hints at what Chairman Jerome Powell could face if President Donald Trump succeeds in throwing globalization into reverse: Higher prices for many goods and potentially faster inflation.
Plugged as possibly the chart of the century by economist and originator Mark Perry, it shows that prices of goods subject to foreign competition — think toys and television sets — have tumbled over the past two decades as trade barriers have come down around the world. Prices of so-called non-tradeables — hospital stays and college tuition, to name two — have surged.
“We would have fewer choices, potentially less quality, less productivity and higher prices if we reverse globalization,” said Timothy Adams, president of the Washington-based Institute of International Finance, who’s discussed the chart and its implications with Fed policy makers.
Just as globalization has been a headwind holding back inflation, its unraveling could end up being a tailwind in the years ahead, pushing costs higher as countries and companies retreat from the international marketplace. That would be on top of the one-time effect that Trump’s tariffs will have on prices of selected imports, putting pressure on the Fed to raise interest rates at a faster pace than the gradual path it has currently mapped out.

Under these circumstances, it would be eminently sensible for investors with long time horizons to begin de-risking their portfolios now.
One last hurrah
On the other hand, I have been in the tactical “last hurrah rally” camp for several weeks. While the long-term forecast calls for caution, the near-term outlook looks bright.
As we enter Q2 earnings season, the outlook from FactSet is upbeat. Q2 guidance is the second most bullish since FactSet began monitoring earnings guidance. Both the sales and EPS beat rates are well above their historical averages, indicating positive fundamental momentum.
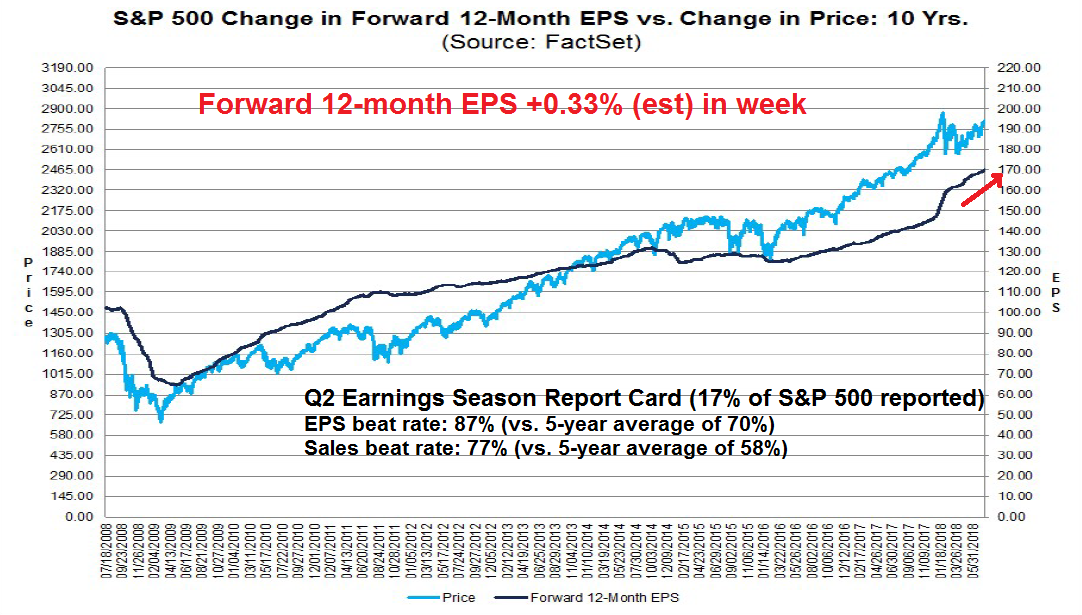
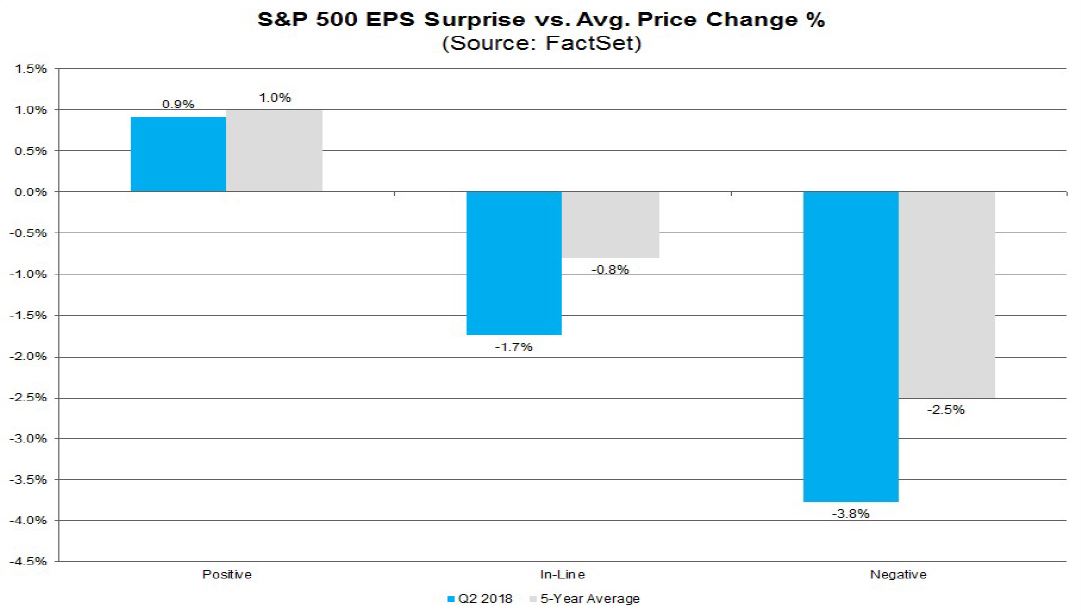
In addition, stock prices are behaving as expected. The market is rewarding earnings beats and punishing misses. There had been some concern among analysts that the market reaction may be skewed if companies raised concerns about rising tariffs and trade friction, regardless of past results. So far, that does not appear to be the case.
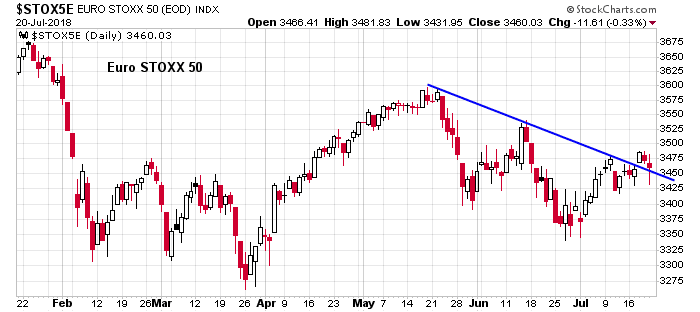
From a technical perspective, the upside breakout of the SPX from its cup and handle formation confirms that the bulls have taken control of the tape. As well, the upside breakout in US equities is supported by strength in Europe, as evidenced by the upside violation of the downtrend by the Euro STOXX 50.
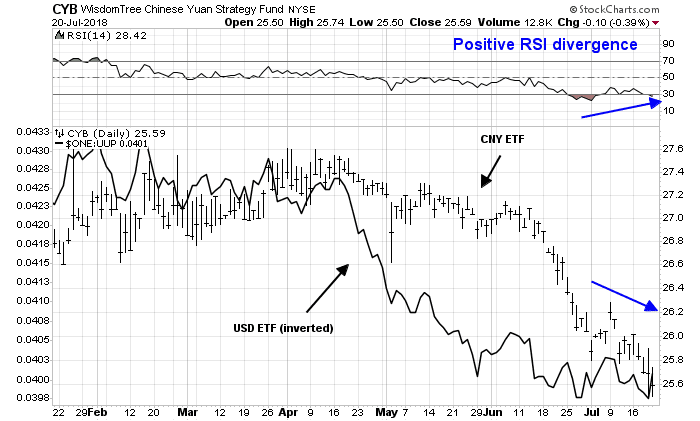
Over in Asia, China and Chinese related equities are bottoming after exhibiting positive RSI divergences. They appear to be poised for relief rallies.

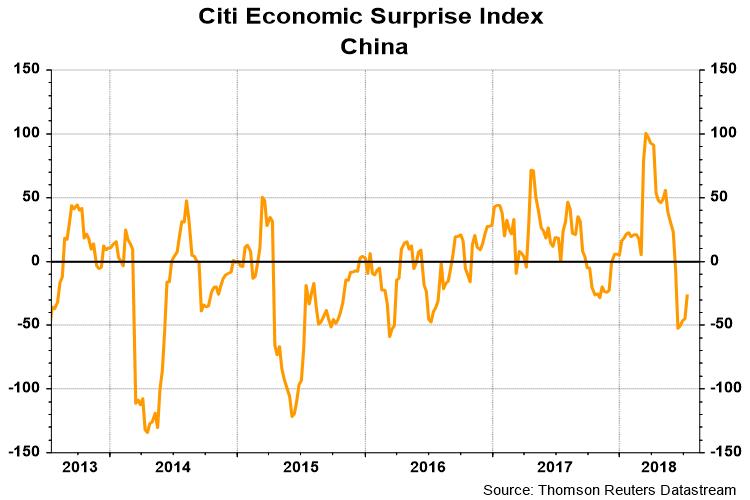
The technical price recoveries in these regions are also supported by recoveries in the regional Economic Surprise Indices (ESI), which measure whether high frequency economic releases are beating or missing expectations. Here is ESI Europe.
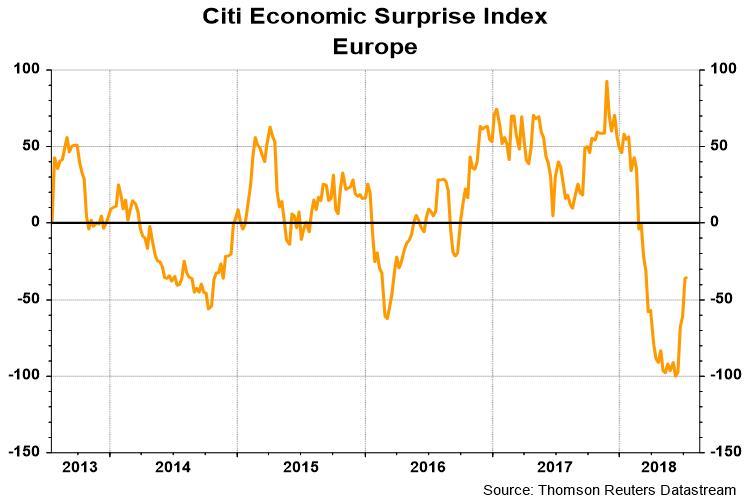
ESI China is also making a nascent recovery.
In conclusion, this market is something for everyone if the scenario that I outlined becomes reality. Traders can take advantage of a momentum driven rally which is likely to take the major indices around the world to fresh highs. At the same time, long-term investors can take advantage of any market strength as an opportunity to de-risk.
The week ahead
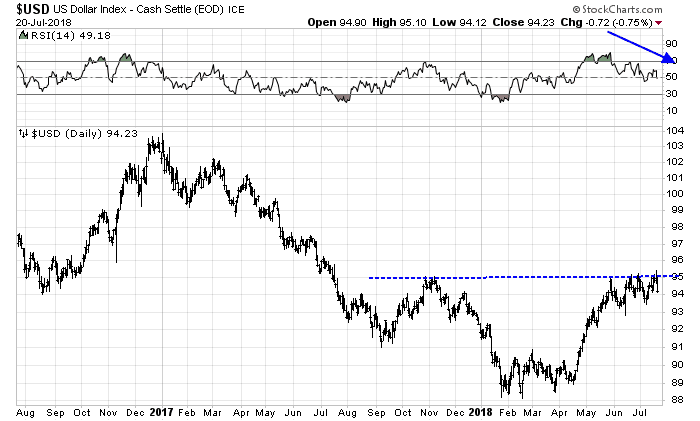
Looking to the week ahead, the key risk to the bullish narrative is an upside breakout in the USD Index. The USD Index is once again testing a key resistance level while exhibiting a negative divergence. However bearish the technical indicators, this does not preclude further USD strength, which is likely to induce a risk-off episode, particularly in emerging market stocks and bonds.
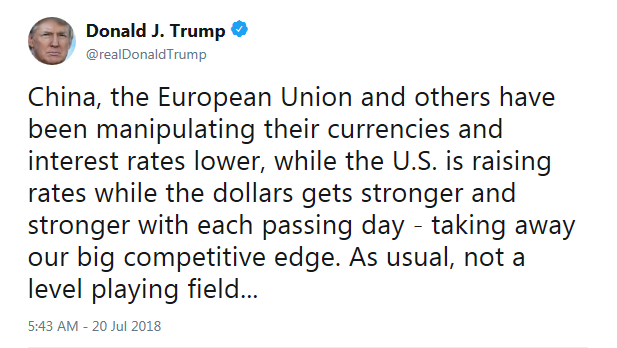
In addition, the market has shown a high degree of concern about weakness in the Chinese yuan (CNY), and it has viewa falling CNYUSD exchange rate as the trade war turning into a currency war. I agree with Ed Yardeni`s assessment that such an interpretation is erroneous. If the currency of country B fall against the currency of country A, but the currencies of countries C, D, and E also rise against the currency of country A, then country B is probably not manipulating its exchange rate. The problem lies with the policies of country A.
While the Fed continues to gradually normalize monetary policy, the People’s Bank of China cut reserve requirements sharply in recent weeks. That undoubtedly contributed to the 6.2% plunge in the yuan from its mid-April peak.
If Trump does raise the ante by slapping a 10% tariff on $200 billion of imports from China, a stronger dollar relative to the yuan might very well offset most of the inflationary consequences for the US. To add insult to injury, Trump could revive his attacks on China as a “currency manipulator.” However, in my opinion, it is US trade policies, not Chinese intervention, that is weakening the yuan.
Trump knows that a weak yuan could cause the Chinese some real pain, by increasing the yuan cost of buying dollar-priced commodities, especially oil. China’s PPI inflation rate, which was 4.7% on a y/y basis in June, could go higher and put upward pressure on the CPI inflation rate, which was 1.9% last month.
Nevertheless, I have learned that when the animal spirits start a stampede, it is wise not to stand in front of the herd.
Equity bulls were helped when the PBOC intervened to stop the CNY slide Friday, and a presidential tweet served to soften the greenback. While the technical conditions point to further USD weakness, the behavior of the dollar remains a wildcard for the markets. Could labeling China a currency manipulator be next?
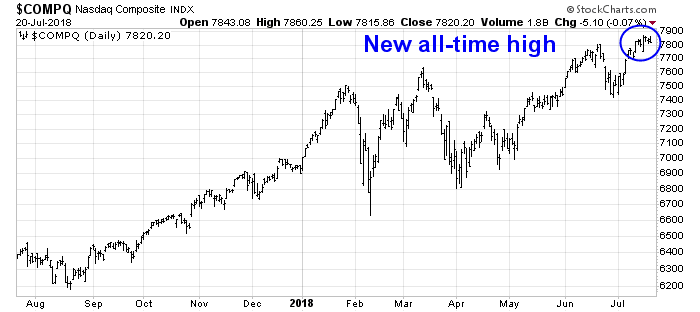
In the meantime, the SPX pulled back from its upside breakout at 2800, but the breakout is holding. Also helpful to the bull case is the all-time high seen in the NASDAQ Composite last week.
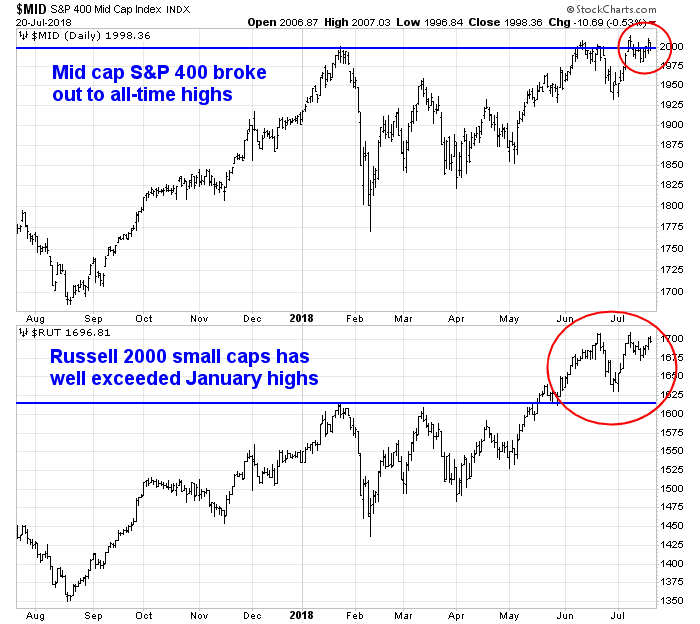
As well, I would also point out that mid and small cap stocks have broken out past their January highs, which addresses the complaints I have read that the market advance was accomplished with narrow participation.
The upcoming week will be a test of character for the bulls. If the market were to follow the script from late 2017 and melt-up, then breadth conditions are tactically sufficiently oversold for stock prices to rise.
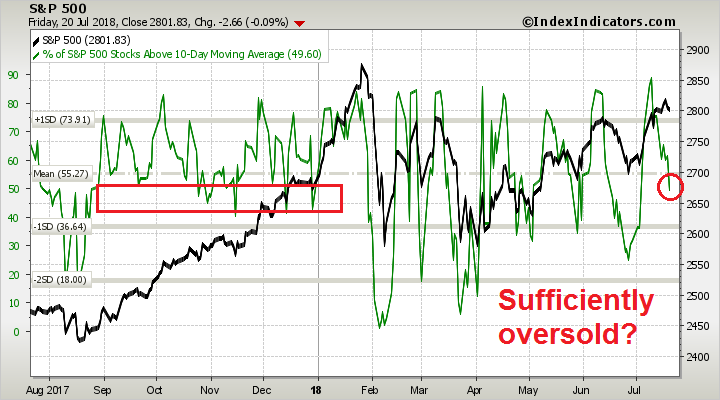
Otherwise, expect further consolidation and sideways action next week.
Programming Note
Publications will be lighter than usual as I will be in South Africa on safari and visiting friends in the Cape Town area. I will be publishing my usual weekend updates, though mid-week commentaries may not be forthcoming as internet access may be spotty. That said, even though I will be on safari, the accommodations can hardly be described as “roughing it”.

My inner investor remains constructive on equities. My inner trader would normally be piling in on the long side, but in view of his trip and possible uncertain internet connection, he is keeping his long commitment relatively light.
Disclosure: Long SPXL
be aware of lion and others, they are not pets
Jamie Dimon of JP Morgan says Trump policies might “stun” the business world. The situation we are in is unprecedented. We might not experience a slow unfolding of rising rates gradually undermining a strong economy until we see a recession and bear market in stocks in 2019 or 2020. In my mind, operating in a manner that uses tried and true methods of stock market investing in this environment is a triumph of hope over reality.
The best thing about the environment is that it has been and will be much more volatile. That means one can get the same dollar return with less money in play and at risk. That’s a great reason to take money off the table until predictability is higher.