Preface: Explaining our market timing models
We maintain several market timing models, each with differing time horizons. The “Ultimate Market Timing Model” is a long-term market timing model based on the research outlined in our post, Building the ultimate market timing model. This model tends to generate only a handful of signals each decade.
The Trend Model is an asset allocation model which applies trend following principles based on the inputs of global stock and commodity price. This model has a shorter time horizon and tends to turn over about 4-6 times a year. In essence, it seeks to answer the question, “Is the trend in the global economy expansion (bullish) or contraction (bearish)?”
My inner trader uses the trading component of the Trend Model to look for changes in the direction of the main Trend Model signal. A bullish Trend Model signal that gets less bullish is a trading “sell” signal. Conversely, a bearish Trend Model signal that gets less bearish is a trading “buy” signal. The history of actual out-of-sample (not backtested) signals of the trading model are shown by the arrows in the chart below. Past trading of the trading model has shown turnover rates of about 200% per month.
The latest signals of each model are as follows:
- Ultimate market timing model: Buy equities
- Trend Model signal: Neutral
- Trading model: Bearish
Update schedule: I generally update model readings on my site on weekends and tweet mid-week observations at @humblestudent. Subscribers will also receive email notices of any changes in my trading portfolio.
Risk of a policy error is rising
Tim Duy, writing at Bloomberg View, recently observed that the stock market has been behaving roughly as expected during past Fed rate hike cycles. As long as growth is holding up, stock prices should continue to rise, regardless of any perceived valuation excesses:
The general rule is that if the economy continues to grow, then it is more likely than not that stock prices rise, even if the Fed tightens monetary policy. Many analysts, however, continue to resist this historical lesson, largely on the basis of traditional valuation metrics. These metrics, such as PE ratios, have been long elevated, leading to the difficulty explaining market behavior that my Bloomberg View colleague Barry Ritholtz has observed.
But if not market valuations what should be the focus on investors? My view is that they should be watching for signs that, at a minimum, earnings growth will falter or, probably more importantly, that the economy is set to tip into recession. I tend to think it is more likely that the economy takes the equity market down with it than the opposite.
Duy thinks that risks are low and we are not near the tipping point yet:
To be sure, it is impossible to know that the future holds. The chaotic environment in Washington, for example, could erupt into a crisis than threatens the economy. A more likely scenario is that the time will come — as it always has — when the Fed tightens policy too much and reverses itself too slowly. That is the most likely event that brings down the economy and equity markets. We just aren’t near that point yet.
I beg to differ. There are early signs that the American economy is starting to stall. These indications, if viewed from a standalone basis, are not cause for concern. But combined with the Fed`s resolve to normalize monetary policy, current conditions could become the basis for a monetary policy error that tips the economy into recession.
Weakness in housing
The most worrisome sign comes from the highly cyclical consumer durable industry, housing. I have been writing for several months that the housing sector appears to be rolling over. Simply put, the housing canary in the cyclical coalmine is struggling, and investors should pay attention to its message.
Housing starts and permits appear to have peaked and they are starting to roll over. This is one of my long leading indicators that are designed to spot recessions a year in advance in my Recession Watch list.
NAR reported July new home sales last week, which missed Street expectations and confirmed the signs of weakness shown by housing starts.
While no indicator is perfect, real private fixed residential investment has also tended to peak and exhibit negative YoY growth before recessions. Current readings are suggestive of a peak, much like the housing starts and new home sales data. However, YoY growth has not fallen below zero yet, though it is decelerating quickly.
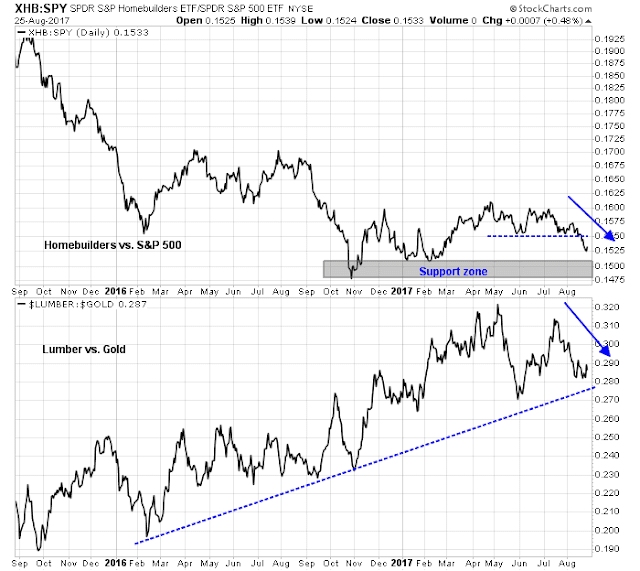
Real time market based indicators are flashing cautionary signals, though they are not in the recessionary levels yet. The market relative performance of homebuilders (top panel) is declining and it has violated an initial relative support line. There is a further relative support zone below which, if broken, would be a red flag for the housing sector. As well, the lumber to gold ratio (bottom panel), which was identified as a useful inter-market cyclical indicator by Bilello and Gayed in their paper, Lumber: Worth its weight in Gold, is showing signs of relative weakness. The ratio remains in a longer term relative uptrend. A violation of the uptrend would be another sign of trouble for the housing industry.
Other signs of economic weakness
In addition to housing, there are other preliminary signs of economic weakness. Calculated Risk reported that the Chemical Activity Barometer (CAB) is showing some softness. CAB has historically led industrial production, which is a key component of economic growth.
As well, Calculated Risk reported that the Philly Fed’s Coincident State Activity is weak, which confirms the signs of growth deceleration from other indicators.
Bloomberg also highlighted analysis from Wall Street analysts warning of a downturn:
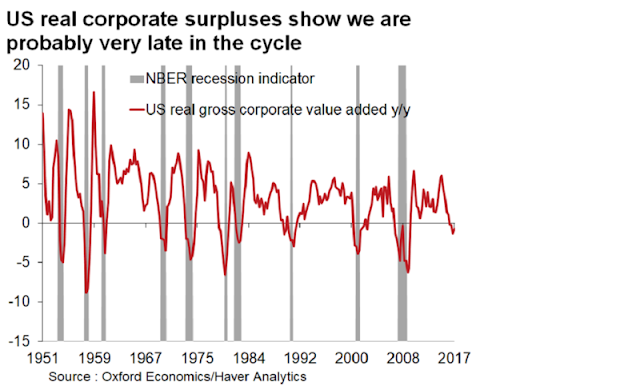
Oxford Economics Ltd. macro strategist Gaurav Saroliya points to another red flag for U.S. equity bulls. The gross value-added of non-financial companies after inflation — a measure of the value of goods after adjusting for the costs of production — is now negative on a year-on-year basis.
“The cycle of real corporate profits has turned enough to be a potential source of concern in the next four quarters,” he said in an interview. “That, along with the most expensive equity valuations among major markets, should worry investors in U.S. stocks.”
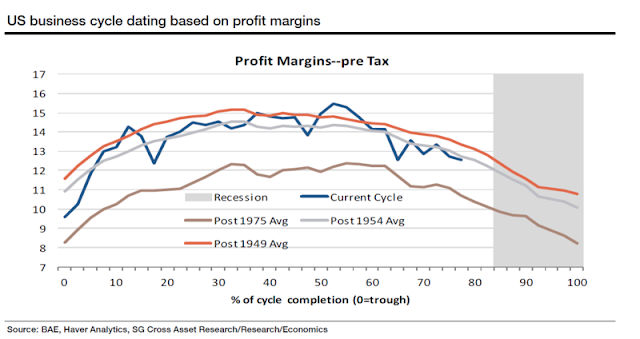
The thinking goes that a classic late-cycle expansion — an economy with full employment and slowing momentum — tends to see a decline in corporate profit margins. The U.S. is in the mature stage of the cycle — 80 percent of completion since the last trough — based on margin patterns going back to the 1950s, according to Societe Generale SA.
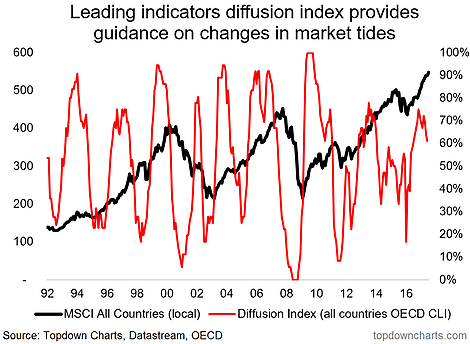
The growth slowdown is not restricted to the US, but it is global in scope. Callum Thomas of Topdown Charts pointed out that global diffusion index of growth are starting to roll over as well.
None of these indicators, by themselves, represent a cause for concern or the basis of a recession call. These are just the typical signs of a late cycle expansion. However, should the Fed make the typical policy mistake of tightening into a late cycle expansion, a recession is more or less a sure bet.
A determined Federal Reserve
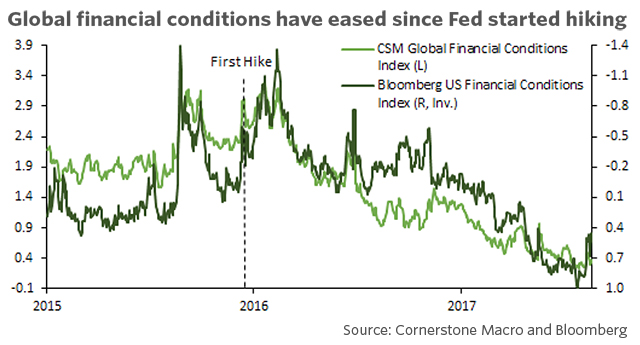
From the Fed’s perspective, this is the perfect time to take the foot off the accelerator and begin tapping the brakes of monetary policy. As Bill Dudley of the New York Fed has repeatedly pointed out, financial conditions have eased since the Fed began to raise rates. Therefore there are ample reasons to continue on the normalization path.
As for the question of the below target inflation rate, the Fed continues to operate in a Phillips Curve framework. While there may be some research from the Philly Fed indicating that the Phillips Curve is dead, there is also supportive evidence from the San Francisco Fed which concluded that the lack of wage growth is attributable to demographics. Janet Yellen was trained as a labor economist and she shows few signs of abandoning the Phillips Curve as a policy guidance tool without overwhelming evidence. Tim Duy concluded that the Fed has good reason to expect wage growth in the near future.
Current market expectations show that the odds of a December hike at below 50%. Expect the Fed to surprise the market with a more hawkish stance, which will eventually prove to be bearish for most asset classes.
Who will be the next Fed chair?
Left unsaid in all the discussion at Jackson Hole is who will be the Fed chair after Yellen’s term expires in February. Will Trump re-appoint Janet Yellen to another term, or will he replace her with someone else?
Bloomberg reported that Gary Cohn appears to be the front runner to be the next Fed chair. Other reports indicate that Cohn has the job, if he wants it. However, there are a few of reasons why a Cohn nomination to head the Fed could spook the markets.
First, it is unclear whether he wants the job, as Bloomberg reported that the pragmatic Cohn may chafe at the academic style at the Federal Reserve. Moreover, it is unclear what his views on monetary policy, and he may be out of his depth. As a reminder, the last Fed chair who was not a trained economist was William Miller, who was appointed to his position by Jimmy Carter for the period from March 1978 to August 1979. Miller was overly dovish during that era of high inflation, and his performance during his brief tenure as Fed chair was less than impressive.
More importantly, investors can kiss any hope of tax reform goodbye should Cohn move to the Fed. Axios reported that Cohn believes that tax reform is dead if it doesn’t get done this year, which is an ambitious target date in light of the myriad of competing interests that need to be resolved:
Cohn has told associates that if tax reform doesn’t get done this year, it’s probably never going to happen. Sources who know Cohn speculate that he’ll leave the White House the instant he concludes tax reform is dead.
While the Axios report is dated July 2, a more recent report indicates that the year-end deadline for tax reform is still live. In an FT interview, Cohn indicated that he is pushing hard for the passage of a tax reform bill by December with the following wishlist:
- Simplify the tax code by preserving only three individual deductions: mortgage interest, charitable giving, and retirement contributions;
- Repeal the estate tax;
- Minimizing the corporate tax rate to “as low as possible”; and
- Create a one-time offshore cash repatriation incentive.
Should Cohn become the new Fed chair, another worry for the markets is the politicization of the Federal Reserve because of Trump`s demands for personal loyalty (via Business Insider):
The problem is the widely reported premium Trump places on loyalty and the potential repercussions this has for the appointment of a close confidant to a position that is ostensibly meant to be independent.
Should the market adopt such an interpretation of a Cohn appointment, expect long rates to climb as the inflation risk premium widens. Higher long rates will serve to depress the already fragile housing sector and could tank the economy. Ironically, a Cohn nomination could have the effect of raising inflation expectations without the Fed having to raise a finger.
On the other hand, Cohn’s decision to publicly rebuke Trump in his FT interview may raise questions about his personal loyalty to Trump. It could doom his current position as NEC director and put the Fed chair out of reach. Politico reported that Cohn drafted multiple resignation letters in the aftermath of Trump’s Charlottesville comments about blaming both sides. The markets would not react well should Trump fire Cohn.
Should Gary Cohn falter in his quest to succeed Janet Yellen as Fed chair, the alternative scenarios are either market negative or neutral. Trump could opt to re-appoint Yellen for another term, which would be a neutral outcome as her views are well known. Otherwise, the most likely replacements are Republican economists with rules-based approaches to monetary policy, such as John Taylor, or Marvin Goodfriend (see A Fed preview: What happens in 2018?). Virtually all rules-based approaches to monetary policy would see a Fed Funds target significantly higher than it is today, which implies a steeper path of interest rate normalization that creates significant headwinds for economic growth.
The weeks ahead: A shallow or deep correction?
Looking to the weeks ahead, the question for traders and investors is whether the current stock market weakness represents a shallow or deep correction. By some metrics, the pullback has reached points where declines have halted in the past.
The Fear and Greed Index is 27, but it recovered from readings that are well within the zone where intermediate term bottoms have occurred in the past.
Short-term breadth from Index Indicators have reached oversold levels where the market has seen relief rallies begin.
AAII bull-bear sentiment spreads have also reached a minor oversold level where the market have bounced in the past.
The bear case
The caveat to the foregoing analysis is oversold markets can get more oversold. The question then becomes whether the market is sufficiently oversold to begin advancing again. The bear can contend that the market remains in a downtrend and displays a pattern of lower lows and lower highs.
NAAIM sentiment is nearing a bearish extreme, but this indicator has not yet flashed a buy signal, which is triggered when it touches the lower Bollinger Band (blue vertical lines).
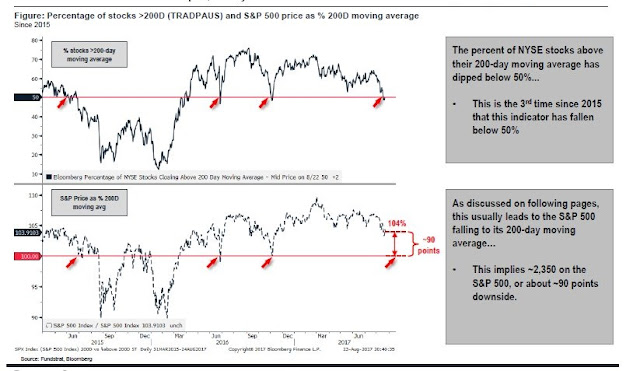
The percentage of NYSE stocks above their 200 dma had fallen to 50%. Such readings are usually signals of deeper corrections that end at the SPX 200 dma, which implies downside risk of about 2350 points from current levels.
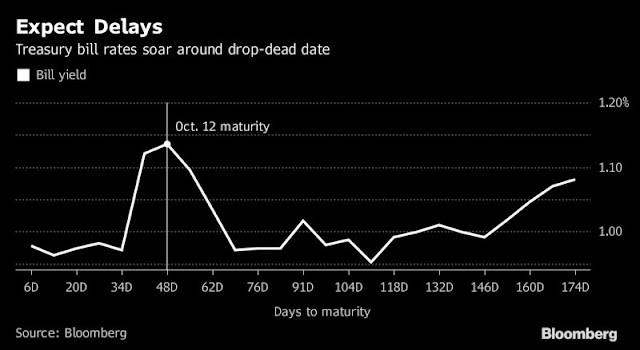
As well, the debt ceiling impasse has been complicated by Trump’s threat to shut down the government if there is insufficient funding for his Wall. Default risk on Treasury paper has perked up, and premiums on Treasury paper around the debt ceiling date are also spiking. It is difficult to believe that this drama can go away overnight.
Trump’s popularity is also becoming a headwind for the equity market. Gallup’s measure of presidential approval fell to a low of 34%. Analysis from NDR indicates that stock prices tend to be sloppy when the approval rating is 35% and below. FiveThirtyEight analyzed Trump’s pardon of former sheriff Joe Arpaio and concluded that the effect would be neutral to slightly negative for presidential approval, but Trump’s popularity likely depends more on how the government handles the aftermath of Hurricane Harvey.
Another development that is not on most investors’ radar are the wide ranging effects of American sanctions on North Korea. Bloomberg reported that, so far, the US has only sanctioned the “small fry”, or companies that do business with North Korea. However, those sanctions could be expanded to major Chinese SOEs, such as oil companies and banks:
So far, the U.S. is seeking to punish relatively minor companies such as Dandong Chengtai Trading Ltd., which is accused of laundering money for North Korea. But there’s reason for Chinese officials to worry that the America may go after major state-owned enterprises and banks, such as China National Petroleum Corp. and Bank of China.
“We have the ability to say, ‘Any Chinese SOE that we consider relevant is fair game,”’ said Derek Scissors, resident scholar at the conservative-leaning American Enterprise Institute in Washington. “We haven’t even gotten close to the economic coercion we’re capable of.”
Sanctioning large Chinese SOEs could spark a major trade war, as Beijing will respond to additional sanctions by pointing out that it is doing all it can by fully supporting UN Security Council resolution 2371 that placed additional sanctions on North Korea.
Yet that coercion might unleash a trade war between the two biggest economies that would affect everything from soybeans to smartphones. China is the U.S.’s largest trading partner, with $578.6 billion in two-way trade last year, according to the Office of the U.S. Trade Representative.
We have yet to see these risks develop in the market. Given the Trump administration’s antipathy towards both China and North Korea, the probability of additional sanctions are non-trivial, and the market would not react well to such a development.
The overhang of these tail-risks makes me think that a deeper correction is the more likely scenario. These threats are not likely to go away overnight and a sustainable rally is unlikely until these risks recede. From a seasonal perspective, Jeff Hirsch of Almanac Trader found that the last four days of August has shown a bearish bias.
My inner investor is neutrally positioned at his policy weight in stocks and bonds. My inner trader remains short the market, and he is bracing for further volatility and drama in the days and weeks ahead.
Disclosure: Long SPXU
2 thoughts on “Is the Fed tightening into a stalling economy?”
Comments are closed.





My anecdotal observation over the decades, is that as normal trading volume returns after labor day, or more likely, the second week after labor day. If the preceding rest of the year has had a good (summer) rally, expect a correction after labor day, as traders start to get worried about 3Q earnings, etc. This year, there are many other factors at play, amply detailed by Cam. What would be more interesting is to see if the seasonal pattern of November/December rally holds, or we get into start of a steep correction in that time frame (see what happened circa 2007-january 2008). Let us pencil in 2490 give or take on the S&P and January 2018, to watch.
Fed tightening? Really? A quarter point or two a year is tightening? That is symbolic. It is not a Mayweather punch. It’s a baby slap. It simply gives us experienced investors a reason to believe we are not in a Moonless World. It fills in the “late cycle” narrative.
But look down the list of the 100 items in the Consumer Price Index CPI and the only two, autos and housing would be impacted by small higher rate hikes and even there marginally. Consumer spending is 70% of the U.S. economy. Consumers don’t borrow to buy the other 98
I would argue that higher short rates would benefit savers and retired folks and spur spending by the latter and less saving by the former.
I agree, the direction is tightening but the extent equals Moonless.
Note that Yellen, Naruda and Draghi we’re all dovish on monetary policy at Jackson Hole.
Their focus on inflation which is staying low due to technology and globalization keeps them on the sidelines.