Preface: Explaining our market timing models
We maintain several market timing models, each with differing time horizons. The “Ultimate Market Timing Model” is a long-term market timing model based on the research outlined in our post, Building the ultimate market timing model. This model tends to generate only a handful of signals each decade.
The Trend Model is an asset allocation model which applies trend following principles based on the inputs of global stock and commodity price. This model has a shorter time horizon and tends to turn over about 4-6 times a year. In essence, it seeks to answer the question, “Is the trend in the global economy expansion (bullish) or contraction (bearish)?”
My inner trader uses the trading component of the Trend Model to look for changes in the direction of the main Trend Model signal. A bullish Trend Model signal that gets less bullish is a trading “sell” signal. Conversely, a bearish Trend Model signal that gets less bearish is a trading “buy” signal. The history of actual out-of-sample (not backtested) signals of the trading model are shown by the arrows in the chart below. Past trading of the trading model has shown turnover rates of about 200% per month.

The latest signals of each model are as follows:
- Ultimate market timing model: Buy equities
- Trend Model signal: Risk-on
- Trading model: Bearish
Update schedule: I generally update model readings on my site on weekends and tweet mid-week observations at @humblestudent. Subscribers will also receive email notices of any changes in my trading portfolio.
Prepare for Central Bank Armageddon?
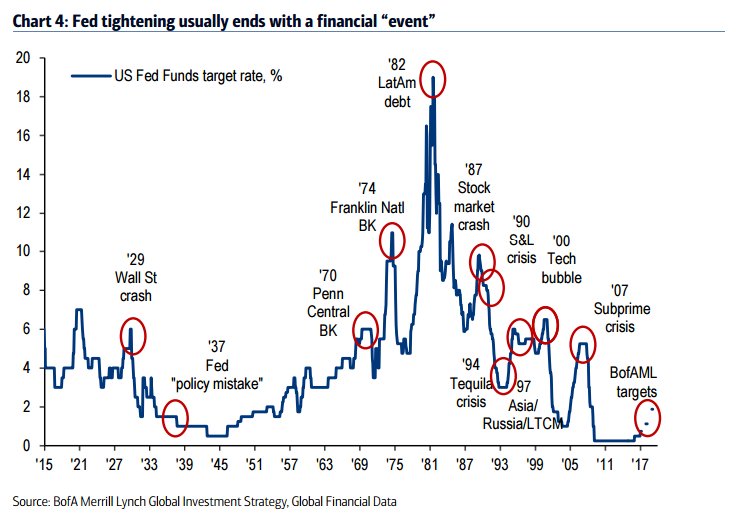
In the last two weeks, we have seen a parade of Fed speakers reinforcing the view that three rate hikes would be the appropriate policy for 2017. At the same time, I am reminded of this chart indicating that Fed tightening cycles often don’t end well because of policy overshoot.
In addition, global inflation surprise indices are spiking, which suggests that a re-synchronization of monetary policy is on the horizon. World central banks are poised to raise interest rates.

Is it time to start preparing for Monetary Armageddon? Will central banks overshoot crash the global economy?
Re-synchronized monetary policy
If this site was Zero Hedge, otherwise known as the financial tabloid of doom (found at your supermarket checkout everywhere), I would just focus on the risks.
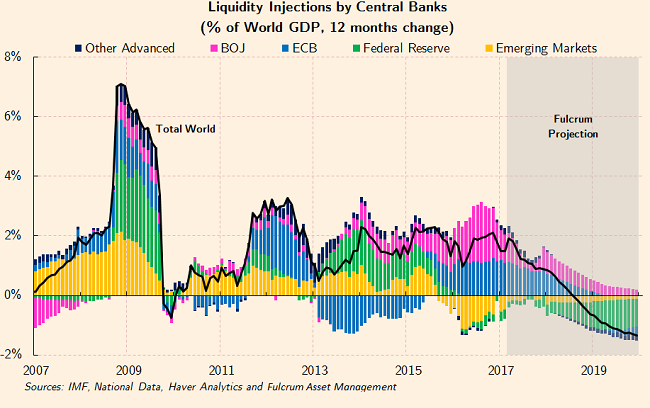
Consider, for example, the case of rising inflationary expectations depicted in the above chart. Gavyn Davies argued that the global economy is recovering, and global central banks are poised to start withdrawing accommodation.

If you believed that QE was holding up equity markets, what happens when central banks start to withdraw liquidity?
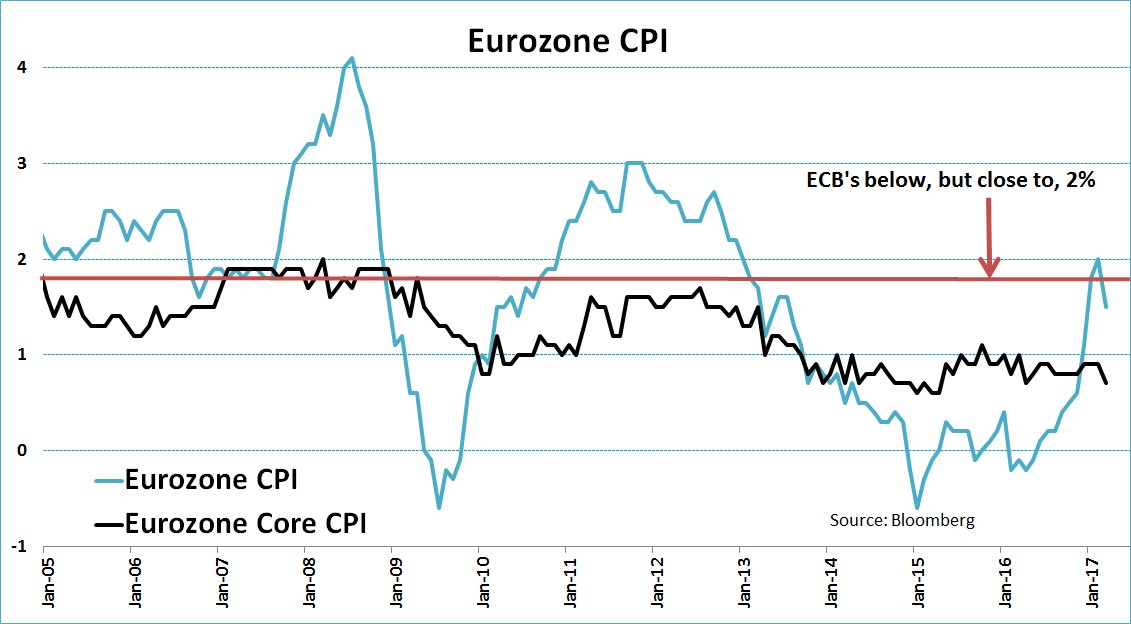
I recognize that eurozone core inflation rates came in well behind expectations in March, and the market reacted by reducing the odds of an ECB taper. But the Easter holidays falls in April this year, compared to March last year, and therefore inflation rates should snap back in April.
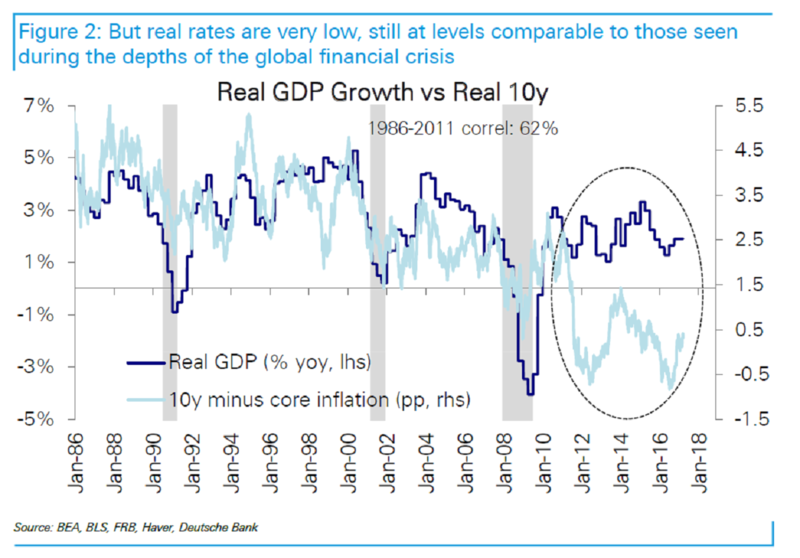
Equally worrisome is the problem of overly low real rates. Bloomberg recently highlighted analysis by Deutsche Chief Global Strategist Binky Chadha indicating that real rates are too low and they are poised to jump further than the market expects:
Real rates, which have generally moved in lockstep with real gross domestic product, are some two percentage points below what’s implied by the momentum of the U.S. economy, an unsustainable divergence, according to Deutsche Bank AG.
“We see real rates as extremely misvalued if not in a bubble,” Deutsche Bank analysts, led by Chief Global Strategist Binky Chadha, wrote in a note on Friday.
Inflation-adjusted yields can’t defy economic gravity for much longer, they argue, setting the stage for a correction that may imperil risk appetite in bond markets over the summer.
The problem of a re-synchronization of monetary policy is truly a global problem. Even as the Fed is on course to raise rates, Bloomberg highlighted the risk posed by rising exposure of USD loans in the offshore market.
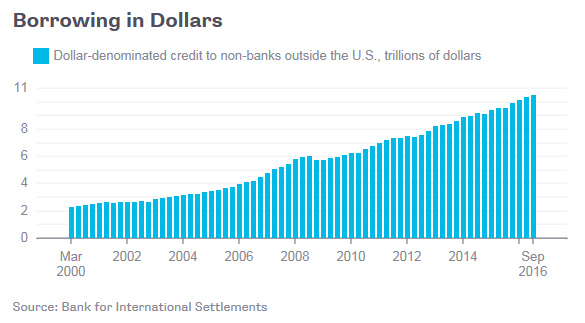
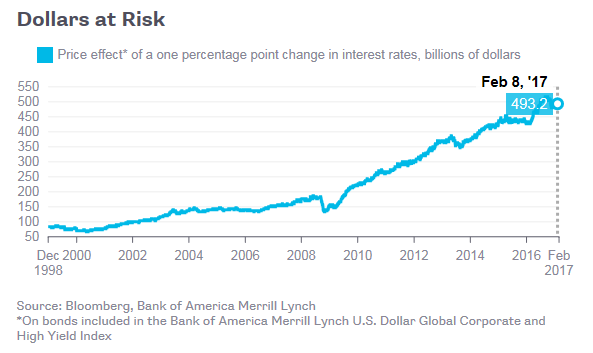
The chart below depicts the sensitivity to a 1% increase in rates. Monetary policy in Washington is in effect raising the risk of an emerging market debt crisis.
Even though stock prices tend to rise during the initial phase of a tightening cycle because the market focuses on the prospects for improving growth, history has shown that psychology can turn very quickly. As the chart below shows, we are currently in the low rate region (blue triangles) where rates are low and moves in stock prices are correlated with changes in bond yields. However, the Taper Tantrum of 2013 (red squares) demonstrated that market perceptions can change on a dime. During that episode, bond yields were negatively correlated with equity returns, as rising bond yields tanked stock prices.

A determined Fed
Even though the Fed is well aware of these risks (see Fed governor Lael Brainard on the risks posed by global linkages), Tim Duy highlighted a speech by New York Fed President William Dudley:
A particular risk of late and fast is that the unemployment rate could significantly undershoot the level consistent with price stability. If this occurred, then inflation would likely rise above our objective. At that point, history shows it is very difficult to push the unemployment rate back up just a little bit in order to contain inflation pressures. Looking at the post-war period, whenever the unemployment rate has increased by more than 0.3 to 0.4 percentage points, the economy has always ended up in a full-blown recession with the unemployment rate rising by at least 1.9 percentage points.
This is why the Fed does not want the forecast for unemployment to drift more than 0.3 percentage point below the estimate of the natural rate. Anything more and they risk being unable to quell an inflationary outbreak without a recession. And recessions are costly, something that is easy to forget now that unemployment is back below 5 percent.
In a separate speech last week, Dudley made it clear that the risks are not tilted to the upside and he favors scaling back monetary accommodation:
While there is still considerable uncertainty about fiscal policy and its potential contribution to economic activity, it seems likely that it will shift over time to a more stimulative setting. Consequently, it appears that the risks for both economic growth and inflation over the medium to longer term may be shifting gradually to the upside.
Even after the latest increase, the federal funds rate target range at three quarters of a percent to 1 percent is still unusually low in both nominal and inflation-adjusted terms. While most FOMC participants judge the equilibrium short-term real interest rate that is consistent with a neutral monetary policy to be low—perhaps in a range of 0 to 1 percent—this is still above the current inflation-adjusted federal funds rate. In such circumstances, it seems appropriate to scale back monetary policy accommodation gradually in order to reduce the risk of the economy overheating, and to avoid a significant inflation overshoot in the medium term.
This is not Zero Hedge…
If this were Zero Hedge, I would stop here and let the fear take over. But this is not Zero Hedge and I try to provide a balanced view of the market. Here is the bull case.
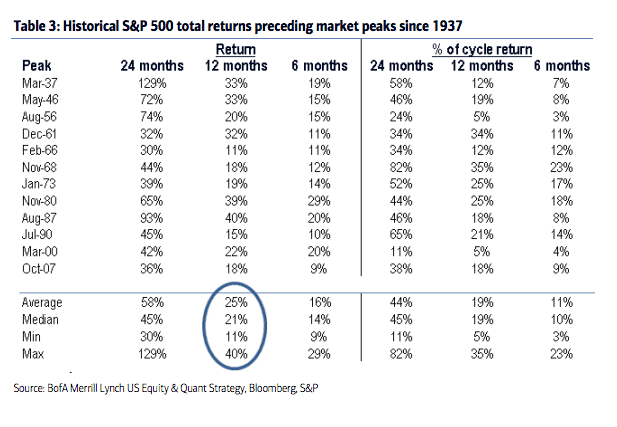
Analysis from BAML equity and quantitative strategist Savita Subramanian indicated that the last phase of an equity bull market is one of the most profitable. So don’t sell too soon:
The market does exhibit some classic late-cycle signs: heightened leverage, accelerating inflation, a flattening yield curve, and elevated valuations by a variety of measures. But what has been lacking throughout this bull market, and is still absent, is all out euphoria. In the late stages of a bull market, fundamentals and valuation typically take a backseat to sentiment and technicals. The last year of a bull market typically sees capitulation-like inflows, with median SP 500 returns of ~20%. And this, coincidentally, is roughly equivalent to the target return of our key sentiment model, the Sell Side Indicator.
Subramanian argued that we haven’t seen the excesses in the market yet, so this aging bull still has some time left.
Sentiment excesses everywhere
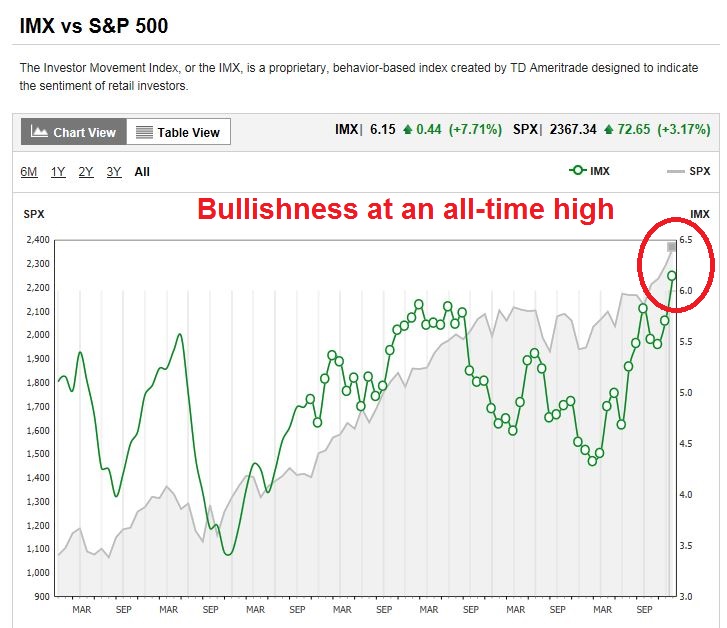
I beg to differ on the question of investor psychology, as I am seeing signs of giddiness everywhere. The T-D Ameritrade Investor Movement Index (IMX), which measures the sentiment of that firm’s retail investors are, is at an all-time high.
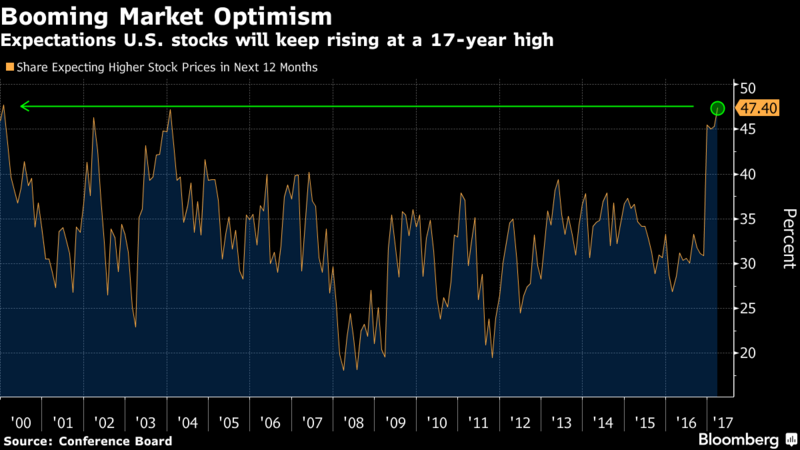
Other long-term metrics of individual investor sentiment are showing crowded long readings. The Conference Board’s survey of household confidence in equities is at a 17-year high (via Bloomberg).
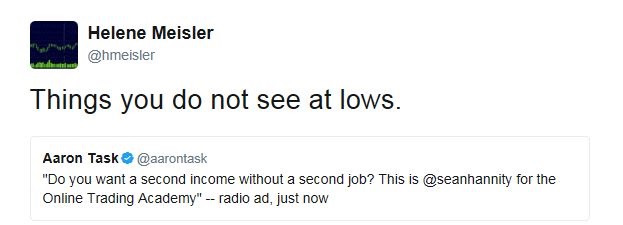
At an anecdotal level, Helene Meisler observed that the mood is not what you find at market lows. Here is one example.
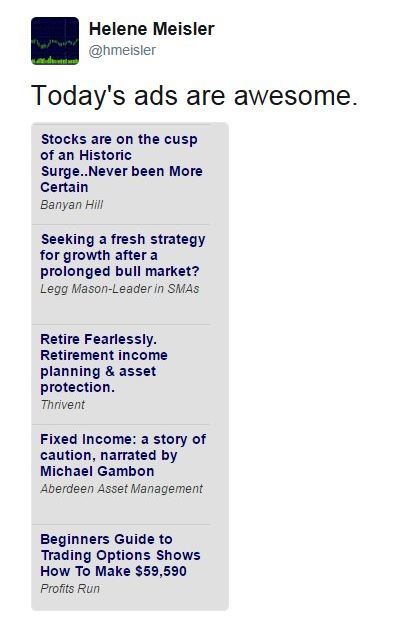
Here is another example.
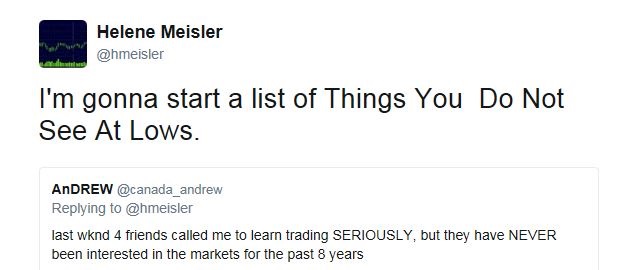
Here is a third example. You get the idea.
As for institutional managers, Savita Subramanian’s own estimates of US large cap manager equity beta hit at a new cycle high before pulling back a bit.
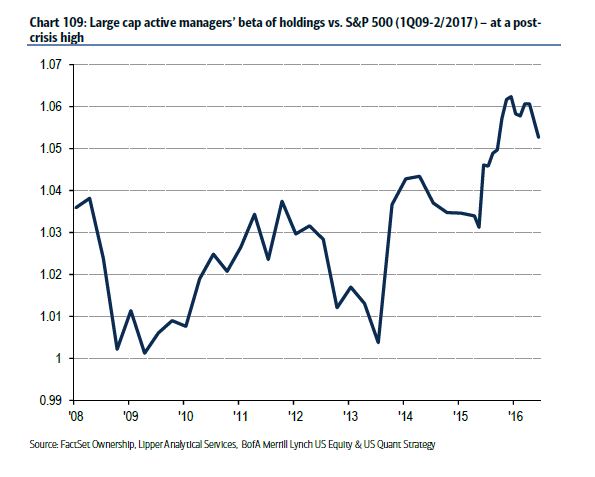
Investor giddiness – definitely. Euphoria? You decide.
No recession in sight
While signs of giddy sentiment does put the stock market at risk, near-term downside risk remains limited because growth remains healthy and there is no recession in sight. While minor disappointments such as the possible failure of the Trump administration to implement a tax cut could take the market down 10-15%, the ultimate bull market killer is a recession, which is not in the cards yet.
New Deal democrat, who monitors high frequency economic releases and divides them into coincident, short leading, and long leading indicators, summarized the weekly data as, “The outlook over the next 6 to 8 months remains very positive. The outlook for one year and more out 12 month remains generally neutral” (though it has deteriorated from positive).
However, I would anticipate that further central bank action later this year could slow the global economy enough for recession risk to rise. But those risks are in 2018 and beyond. Since markets are forward looking, it would peg the timing of a potential market top late this year or early next year.
A late cycle advance
Investors should therefore remain intermediate term constructive on equities. As global inflationary pressures rise, central bankers poised to become less accommodative, but the best and final phase of the bull market ahead of us, these conditions are the classic signs of a late cycle market.
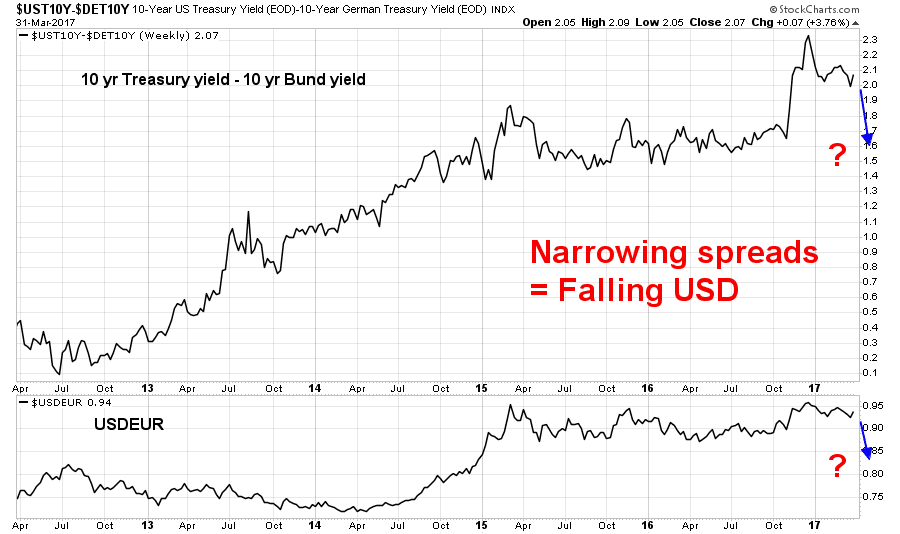
Consider the effects of the re-synchronization of global monetary policy from easy to tight, which should begin later this year. The chart below shows the yield spread between Treasury and Bunds. As the ECB shifts from accommodative to tapering, and ultimately tightening mode, the spreads should start to narrow. Narrowing spreads would put downward pressure on the US Dollar, which raises inflationary pressures within the US.
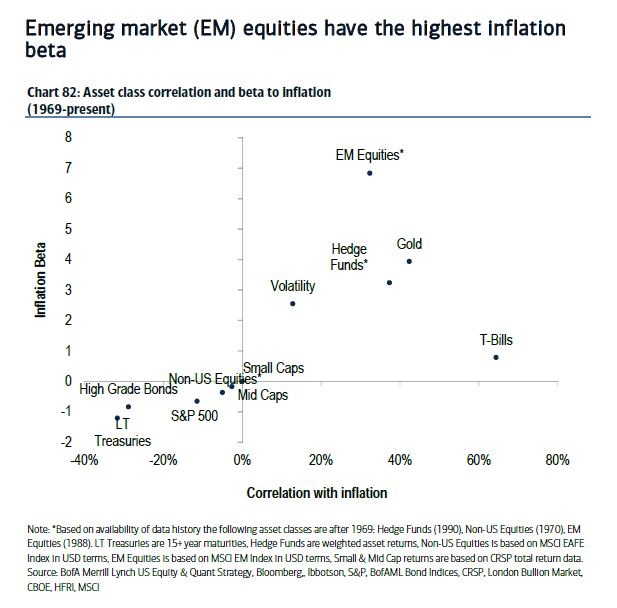
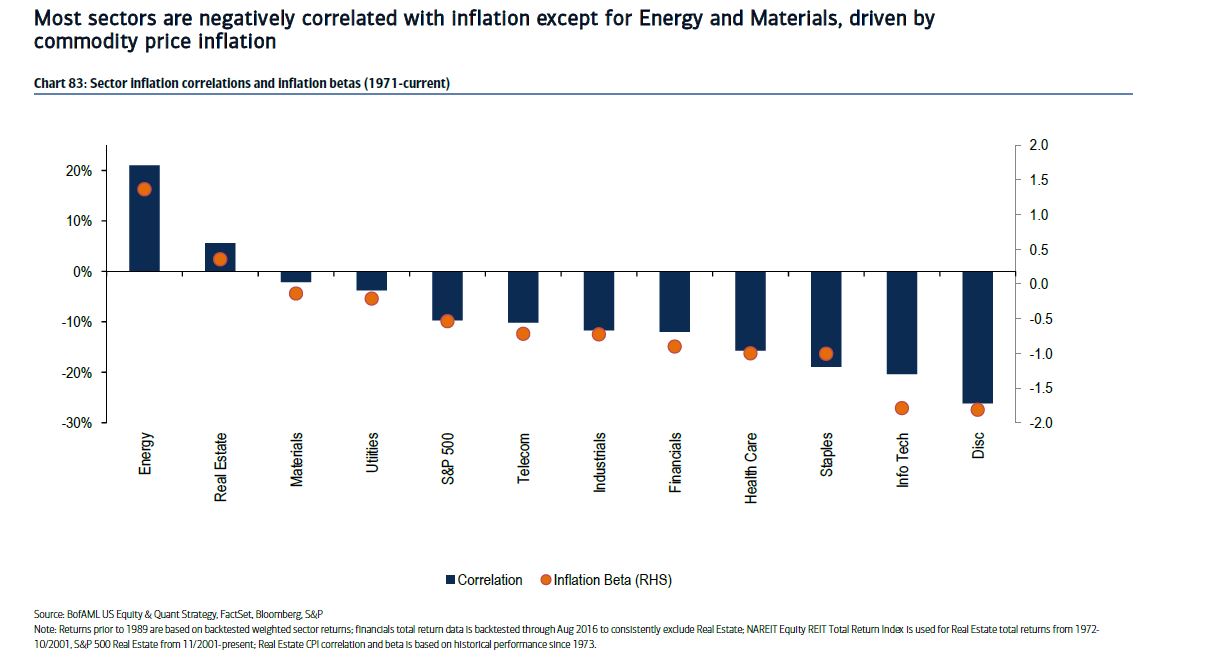
As this chart from BAML indicates, a rising inflation environment would be beneficial for asset classes like gold and emerging market equities.
At a sector level, the sectors most exposed to inflation are energy, real estate, and materials. The inflation beta of the US materials sector has been dampened by a lack of major mining companies in the US, such as BHP, Rio Tinto, etc., and the presence of downstream companies such as chemicals, which would negatively affected by rising material costs as inputs.
In conclusion, investors should not panic at the prospect of rising rates and the re-synchronization of global monetary policy. As William Dudley put it in his speech last week, “I don’t think we are removing the punch bowl, yet. We’re just adding a bit more fruit juice.”
In all likelihood, investors are likely to see another leg up in equity prices before the ultimate cyclical top. In that context, the SPX point and figure chart target of 2500-2600 makes sense, and investors can add further returns in this environment by tilting towards inflation hedges such as gold and energy.

The week ahead: Lines in the sand
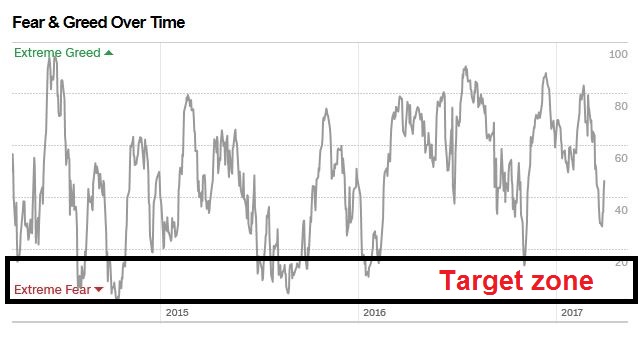
Looking to the week ahead, I reiterate my view that intermediate term indicators are only showing the initial signs of a bottom, and more consolidation is ahead. The Fear and Greed Index, despite last week`s bounce, has not historically bottomed with readings in the 30s.
The NYSE McClellan Summation Index (NYSI) may be starting to bottom based on its stochastic readings. In the past, the NYSI has seen a few weeks of choppiness before a durable bottom was made.

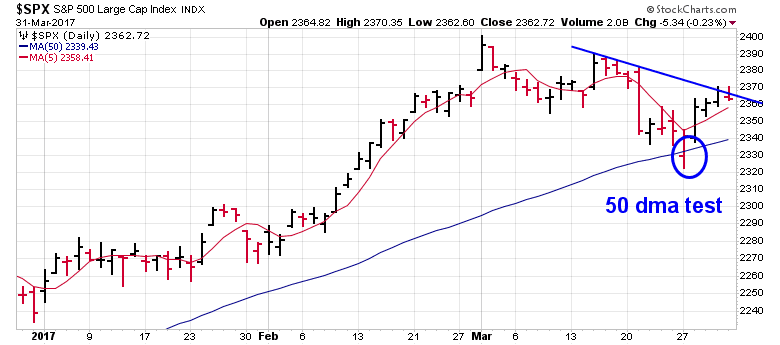
In the short run, the market is approaching some lines in the sand that delineate bullish and bearish impulses. The SPX successfully tested its 50 dma last week and it is now testing downtrend resistance. Further strength will likely signal a rally to test the old highs.
My inner trader remains bearishly tilted. This chart from Index Indicators shows that short-term momentum reached a minor overbought level and it is starting to roll over. The odds still favor weakness ahead for next week.

My inner investor remains bullishly positioned. He is waiting for the bullish finale of this equity bull run.
Disclosure: Long SPXU, TZA
Quarter end, jp financial year end, will see mkt really wants to go this week.
Jump in margin loans last week also confirms your thesis.
While the general index has not had a big pullback, the Trump favorites did enough to establish a decent low point to start another upleg. Banks, the most favored Trump industry, were off over 8%.
My biggest concern is that everyone I pay attention to, including Cam, believe that there is a final leg of the bull market left after which it will become evident when to head for the exits. Markets rarely allow such easy money to be made.
You have to think about this issue in terms of your own time horizon.
If I were an institutional investor that takes several months to implement an investment decision, I would start to pare back my risk exposure now. At a minimum, if I was overweight equities, I would move to a neutral weight in accordance with my investment policy weight.
If I were an individual investor who doesn’t want to pay a lot of attention to the market, I would wait for signs of recession from long leading indicators before starting to de-risk.
If I were a swing trader, I would be buying the dips, because any potential bear market is beyond my time horizon.
I’ll also note that the high for the S&P 500, thus far, was reached on March 1st. That high happened to be 21.4% higher than the close of the S&P exactly one year earlier. That 21.4% increase happens to be exactly the median of the final year increase of a bull market according to BAML’s work. Is my point that we reached a high for this multi-year bull market on March 1st this year? No. I am just pointing out that the BAML analysis is useless since the absolute peak is only known in retrospect.
Thanks for making the differences so clear.