Explaining our market timing models
We maintain several market timing models, each with differing time horizons. The “Ultimate Market Timing Model” is a long-term market timing model based on research outlined in our post Building the ultimate market timing model. This model tends to generate only a handful of signals each decade.
The Trend Model is an asset allocation model which applies trend following principles based on the inputs of global stock and commodity price. This model has a shorter time horizon and tends to turn over about 4-6 times a year. In essence, it seeks to answer the question, “Is the trend in the global economy expansion (bullish) or contraction (bearish)?”
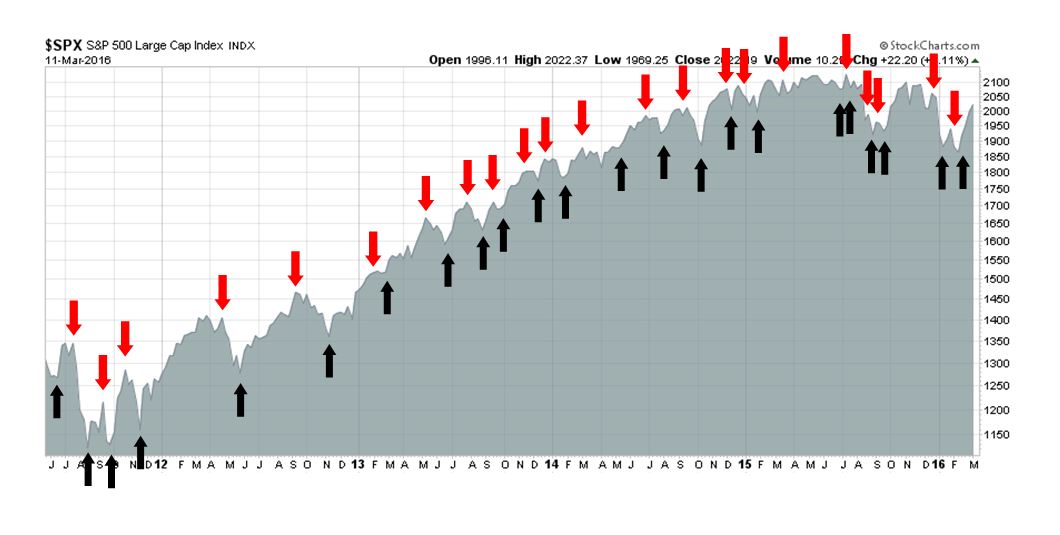
My inner trader uses the trading component of the Trend Model seeks to answer the question, “Is the trend getting better (bullish) or worse (bearish)?” The history of actual out-of-sample (not backtested) signals of the trading model are shown by the arrows in the chart below. Past trading of this model has shown turnover rates of about 200% per month.
The signals of each model are as follows:
- Ultimate market timing model: Buy equities
- Trend Model signal: Neutral
- Trading model: Bullish
Update schedule: I generally update model readings on my site on weekends and tweet any changes during the week at @humblestudent. Subscribers will also receive email notices of any changes in my trading portfolio.
The late cycle/inflation bandwagon
Just as I started to write about the late cycle and reflation trade theme last week (see RIP Correction. Reflationary resurrection next?), it seemed that the whole world was rushing to jump on this bandwagon. These conditions suggest that my thesis of late cycle sector leadership of capital goods and resource extraction industries should have some legs as the Street’s stampede is just starting. Before rushing to hop a ride on the Reflation Express, though, I would caution that a couple of risks lie ahead. In the short run, the advance appears extended and vulnerable to a pullback. As well, the FOMC meeting next week could be a source of significant market volatility.
Let’s begin with the macro big picture. The American economy is showing definite signs that it is moving into the late cycle of its expansions phase, characterized by tight capacity utilization, low unemployment and rising inflation. New Deal Democrat wrote a two part series (links to Part 1 and Part 2) pointing out that many of the mid-cycle indicators that he watches have peaked, though immediate recession risk is low:
So let’s summarize: of the 7 mid cycle indicators, 5 have probably peaked: 2 of the 3 consumption metrics, plus YoY employment, capital formation, and consumer sentiment. One – the real personal savings rate – is equivocal, and only 1 – spending on durable vs. nondurable goods – has not triggered.
Barring a big surprise, we are past mid-cycle, which most turning at roughly year-end 2014. That isn’t meant to be a precise 50% marker, as in the past these in the aggregate have turned sometime in the middle 1/3 of the expansion. In other words, it is time to focus on the long and short indicators of approaching recession, although the chances are relatively slim that it happens before 2017.
In his weekly monitor of high frequency economic data, he concluded that the US industrial economy is starting to turn up after its recent soft patch:
Once again the bifurcation of decent consumer economy, poor industrial economy (at least that portion tied to commodity extraction and exports) that began one year ago, is changing — and generally for the better, as commodity production and transportation look like they have turned positive. The recent weakness in real money supply appears to have ended. The dollar is becoming less of a drag. The only new negative is the continued deterioration in tax withholding.
Gavyn Davies observed that their models are showing signs of rising inflationary pressures:
Fulcrum’s inflation forecasting models (BVAR models that include price inflation, the exchange rate and oil prices) do suggest that the inflation process may have firmed up lately. The graphs below show that headline inflation will start to rise soon, and that core inflation will be hovering around 2 per cent by year end. These forecasts are a bit above the FOMC’s predictions that were published in December, so it is possible that the Fed’s inflation path could be slightly firmer when it appears with the March 15/16 FOMC meeting.

Gluskin Sheff Chief Economist David Rosenberg is bucking the bearish trend on Wall Street and running with the bulls instead, touting positive jobs and wages data as a sign that inflation—the current gold standard for economic recovery—may be right around the corner.
He noted that the Fed’s latest Beige Book indicated that wage pressures are escalating, which of course is good news for the economy. Oil prices might also be on the path to recovery as investors have been rewarding major oil giants for cutting their capital expenditures plans for this year.
Mr. Market takes a ride on the Reflation Express
The markets have also pivoted towards a reflationary paradigm for the global economy. As recessionary fears faded in the past few weeks, equities rallied in a coordinated fashion around the world. The chart below shows that US stocks, as measured by the SPX, staged an upside breakout through its 50 day moving average (dma) and regained its 200 dma level on Friday. European stocks, as measured by the Euro STOXX 50 and the FTSE 100, also rose above their 50 dma.

Reflationary gains are not limited to the US and Europe. The regional markets of China’s trading partners have all regained their 50 dma levels, with the exception of the Shanghai index:

The late cycle leadership theme was evident at a sector level as well. The chart below shows the USD Index (top panel), which is inversely correlated to commodity prices and the relative market performance of the energy and metals and mining stocks. The USD is weakening, while both of the resource extraction groups pictured have rallied out of relative downtrends, which is bullish. In addition, a soft USD should be supportive of better earnings growth of global multi-nationals.

As further independent confirmation of the late cycle investment theme, JC Parets recently penned an article to buy resource-rich Canada while shorting America.
Supportive sentiment readings
Sentiment models indicate that stock prices are poised for further gains. While some sentiment readings have moved from crowded short to neutral, the more important funds flow metrics (where people are actually putting actual money on the line) are still showing healthy signs of skepticism about the latest stock market rally. Josh Brown indicated that the latest RiskAnalyze report showed that advisors had gone risk-on, but only in the bond market. In equities, they pulled money out of the US and put it to work in defensive international stocks:
- High Yield Bonds (HYG, JNK, SHYAX)
- Healthcare (XLV)
- MSCI EAFE Minimum Volatility (EFAV)
- Russell 1000 (IWF)
- Short Term US Treasury (IEI, IEF)
- Global Bond (TPINX, TGBAX)


While the aforementioned skeptical readings are contrarian bullish, the behavior of the “smart money” insiders is constructive. Barron’s reports that insiders have been steadily buying since November:
The week ahead: The FOMC wildcard
Federal Reserve officials are likely to hold short-term interest rates steady at their policy meeting next week and leave open-ended when they’ll next raise rates given their uncertainties about markets and global growth.
For Fed Chairwoman Janet Yellen, that likely means crafting a message that gives the central bank flexibility to lift rates in April or June should the economy perform well in the weeks ahead, without committing to a move in case economic data disappoint or new market turmoil erupts.
Fed watcher Tim Duy thought that an interest pause is more a less a foregone conclusion. The bigger issue is whether the post-meeting statement is likely to be dovish, neutral or hawkish. Duy believes that Yellen would stay dovish for now, but that`s only an educated guess:
Where does Yellen stand? My sense is that six month ago Yellen’s position would align close to Fischer. But I think she would now find Brainard’s position more persuasive, especially with Dudley’s support. That suggests that the Yellen will work to pull the Fed toward a neutral/dovish statement.
Bottom Line: Fed will hold steady next week. Key FOMC participants are shifting in a dovish direction. The financial market volatility, which induced clear tightening in financial conditions, bolstered the Brainard’s arguments. Despite solid incoming data, the Fed will find it necessary to tread cautiously in the months ahead.
Whatever the Fed does next week, it will likely cause a minor earthquake in the financial markets. If the message is dovish, equities are likely to spike upwards, along with commodity prices as the USD dives. A hawkish tilt would reverse some of the gains seen in stocks and late cycle sectors.
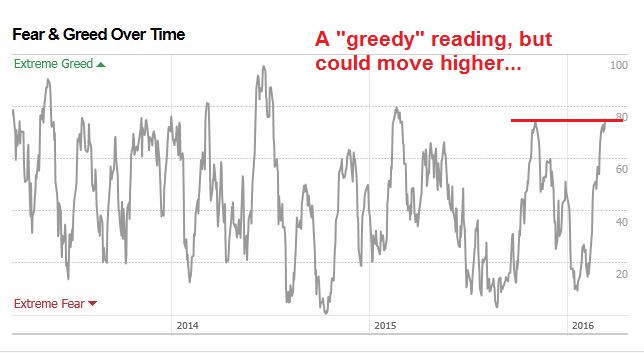
Technically, stock prices appear to be overextended as the SPX tests its 200 dma. The CNN Money Fear and Greed Index shows a greedy reading equal to the level reached last October, though this index has risen further in the past.
Breadth readings from IndexIndicators shows that the market is very overbought and vulnerable to a setback.

My inner investor had been accumulating equities on weakness, with an overweight position in resource extraction industries. He is standing pat with his positions.
My inner trader got stopped out of his long equity position by the market weakness on Thursday. He is staying in cash until the FOMC meeting next week. Despite the bullish intermediate term tailwinds that he is seeing for stock prices, he doesn’t believe the risk/reward ratio is favorable enough to play a event-driven market with a binary outcome like a FOMC meeting. At times like these, discretion is the better part of valor.
Hi Cam, what’s your view on gold?. Do you think it can perform in this late cycle scenario? Thanks
Gold should perform inversely vs. the USD. Tell me the tone of the FOMC statement and I can tell you what will happen to gold.
Cam, sometimes reading your post are like casting yarrow sticks for the I Ching. I have a preference for charts, and the directions of the trading arrows, I would like to see more charts for not just the Trading model but the Trend and Ultimate model as well.
When you state that the Trend model is neutral but your inner investor is accumulating equities on weakness I see a contradiction in your post, or not understanding. The last graph of the Trend model I saw was an upward black arrow, maybe you need another symbol for neutral.
The trading model is bullish.
The trend model is neutral, that just means that an investment account following the model should stay at a neutral allocation, e.g. if you neutral allocation is 60/40, then you should stay at 60/40.
My inner investor doesn’t necessarily stick exactly to the trend model, but he does following it closely.
Is that clear now?
Cam–How long will this outperformance by “extraction” stocks last? is this a medium term investment or have we turned a corner allowing for longer term investment in oil related companies?
In the past, the market has continued to rise when the Fed began a rate hiking cycle. That’s because the negative effects of higher rates, which influences E/P (inverse of P/E ratio), has been offset by better earnings growth.
In other words, the E in the P/E ratio grows faster than the contractionary effects of rate hikes on P/E.
These rate hike episodes also tend to coincide with mid to late cycle markets, which is what we are seeing today.
So here is the BIG QUESTION: How aggressive with the Fed be in hiking rates? That will determine the length of the outperformance by late cycle sectors like resource extraction and capital goods industries.
Watch this week’s FOMC statement for clues.