Preface: Explaining our market timing models
We maintain several market timing models, each with differing time horizons. The “Ultimate Market Timing Model” is a long-term market timing model based on the research outlined in our post, Building the ultimate market timing model. This model tends to generate only a handful of signals each decade.
The Trend Asset Allocation Model is an asset allocation model that applies trend following principles based on the inputs of global stock and commodity prices. This model has a shorter time horizon and tends to turn over about 4-6 times a year. The performance and full details of a model portfolio based on the out-of-sample signals of the Trend Model can be found here.

My inner trader uses a trading model, which is a blend of price momentum (is the Trend Model becoming more bullish, or bearish?) and overbought/oversold extremes (don’t buy if the trend is overbought, and vice versa). Subscribers receive real-time alerts of model changes, and a hypothetical trading record of the email alerts is updated weekly here. The hypothetical trading record of the trading model of the real-time alerts that began in March 2016 is shown below.

The latest signals of each model are as follows:
- Ultimate market timing model: Sell equities
- Trend Model signal: Bearish
- Trading model: Neutral
Update schedule: I generally update model readings on my site on weekends and tweet mid-week observations at @humblestudent. Subscribers receive real-time alerts of trading model changes, and a hypothetical trading record of those email alerts is shown here.
Subscribers can access the latest signal in real-time here.
Beijing blinked
It’s always the darkest before the dawn. Just as it seemed that the world was about to collapse into a synchronized global recession, Beijing announced that it’s considering allowing the sale of 1.5T yuan (USD 220B) in local government bonds earlier than planned to fund infrastructure projects.

Commodities rallied on the news but China related equity markets greeted the announcement with a yawn. Can China rescue the global economy once again?
China’s policy challenges
The jury is still out on that question. In the past, Asian markets have moved in lockstep with China’s ups and downs. This time, it has become more bifurcated. While China and Hong Kong have turned up in relative strength even before the announcement, Japan has roughly matched the performance of the MSCI All-Country World Index (ACWI). Semiconductor-sensitive South Korea and Taiwan are weak, and so is resource-heavy Australia.

While the stimulus program is a positive step, China’s challenge is to balance the needs of its zero COVID policy against the need for a growth revival. To be sure, injecting 1.5 trillion yuan into the Chinese economy will create a flood of liquidity into the financial system, but how much of the stimulus will be financialized, and how much will actually get into the Main Street economy?
Beware of the FOMC cycle
It’s difficult to instantly assess the impact of a policy shift. China’s stimulus could have a real lasting effect on global liquidity, or it could be a fake-out. US investors need to be mindful of the FOMC market cycle that’s played out in 2022. The market has shown a tendency to peak about one to two weeks before an FOMC meeting and decline into the meeting, followed by a rally. As the next meeting is scheduled for July 26-27, the timing of a peak could begin as soon as the coming week. (Note that the arrows shown in the accompanying chart are purely stylized and do not connote any price targets).

The stock market may have further short-term upside potential. One of the key indicators that the Fed will be watching is the June CPI report due Wednesday. Consensus expectations calls for a monthly headline CPI of 1.1% and core CPI of 0.6%. The Cleveland Fed’s inflation nowcast shows a headline CPI of 0.97% and core CPI of 0.49%, which is a setup for a tame inflation surprise and potentially bullish for risky assets.

For now, the S&P 500 remains in a falling channel on the weekly chart. Until it can stage an upside breakout, the bears are still in control of the tape.

Timing the short-term peak
The S&P 500 is testing resistance in the 3900-3920 zone, with secondary at the 50 dma at about 3970. Momentum may stall here, but the bulls have a shot at rallying the market further as indicators are not overbought yet.

Here are some of the indications that I am monitoring in order to time a short-term peak. The NYSE McClellan Oscillator (NYMO) recycled from an oversold condition and flashed a buy signal. An overbought reading, or a near overbought reading, would be a sign to take some profits.

Similarly, the usually reliable S&P 500 Intermediate Breadth Momentum Oscillator (ITBM) also flashed a buy signal at about the same time. The buy signal is based on a recycle of ITBM’s 14-day RSI from oversold to neutral. I am waiting for an overbought condition for a sell signal.

Still a crowded short
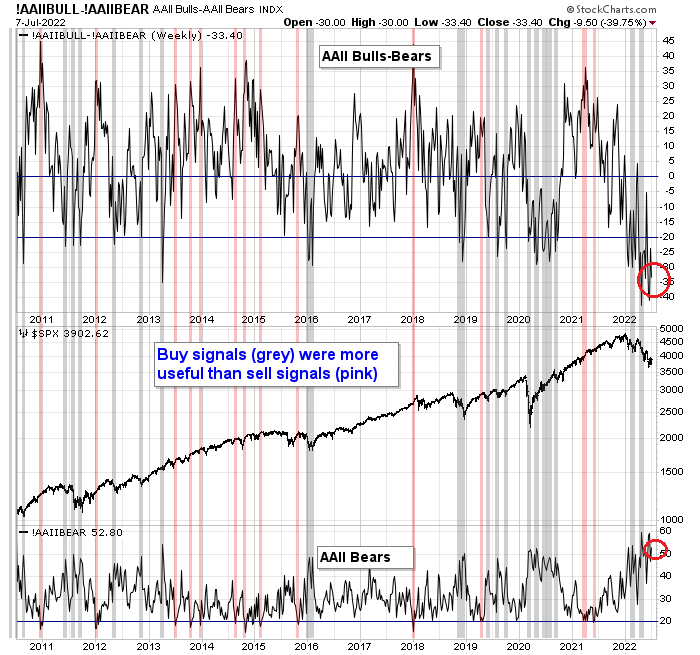
Despite my short-term caution, sentiment models are still pointing to the market forming an intermediate-term bottom. AAII sentiment remains at a crowded short, which is contrarian bullish.
While AAII sentiment is an investor survey, the TD-Ameritrade Investor Movement Index (IMX) measures the client positions of the firm. The latest monthly readings have continue to plunge and sentiment is approaching COVID Crash lows.

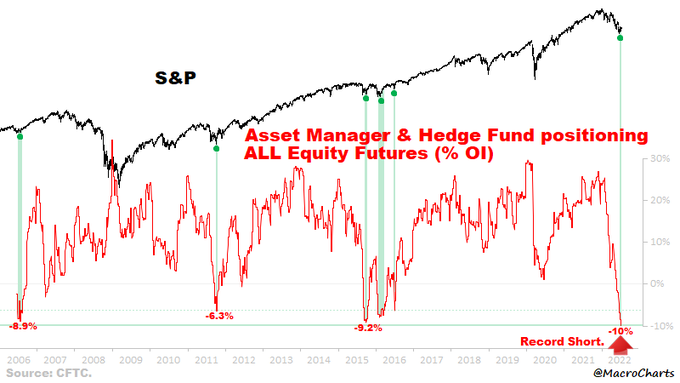
Macro Charts also pointed out that aggregate equity futures positioning by asset managers and hedge funds is at a record low.
In conclusion, I continue to believe the stock market is in the process of making an intermediate-term bottom. The panic from mid-June likely established a major support level for a bottom for this cycle (see Why last week may have been THE BOTTOM). While a V-shaped recovery is always a possibility, the odds favor a re-test of the old lows in the coming weeks. The China stimulus news was the catalyst for a relief rally of unknown magnitude. The bears aren’t done yet, and the FOMC cycle may not be done either.
Rent, a big component of PCE (hence of CPI as well), is a lagging component and has more room to go up. Anecdotally, rents are up 20% over previous year in Manhattan. Energy was lower in later part of June but is a much smaller part of CPI. Labor market is very strong.
All this to say that inflation is likely to stay up but economic growth slowing in parts of the economy. Service PMI was strong. I think Fed will get to it’s target for interest rate and quell inflation.
Risk Reward tilted to the down side for now.
As far as I can see the fundamental logic supporting this situation is fairly simple.
The market is going down because it is concerned about about a recession.
A recession is being brought on by the FED because it is concerned about inflation.
Until the FED starts to see a definite downward trend in prices it won’t changes its outlook.
Therefore we are waiting for the FED to wave the green flag to say that the “coast is clear” before we should invest again.
(Ken’s take on this is that it could be Dec 14th ?)
Dec.14 at 2:00 EST during Powll’s press conference to be exact.
lol.
Nick Timiraos tweeted yesterday:
Fed governor Christopher Waller: “This kind of worry that there’s going to be a stop-and-go policy by the committee like what happened in the ’70s—that’s just not going to happen in my view.”
In the mid 70s the Fed “blinked” because of a recession and so inflation bottomed in late ’76 and then reaccelerated. Is this “whatever it takes” the other way around?
Wow!!!
Bank of America Bull & Bear Indicator is currently at ZERO.
https://twitter.com/qcapital2020/status/1546475092028411904
Another downside fake-out to start the day.
Confusing times for sure. I think Paul Krugman captures it this morning:
“Overall, the picture appears consistent with a “soft landing” — a slowdown that falls short of a full-on recession, or involves a mild recession at worst, together with stabilizing inflation.
But, of course, we don’t know that. In fact, given the wide discrepancies in economic data, economic pundits (including me) have unusual freedom to believe whatever they want to believe. Just pick and choose the numbers that tell you what you want to hear and glue them together.”
Doug Cass: I am growing increasingly, and incrementally, more bullish on equities — in part based on our expectations of a mild and brief recession and a possible rapid deceleration in the rate of inflation which could result in a less hawkish Fed.
My baseline expectations are for a mild and short-lived recession and “peak inflation.”
https://realmoney.thestreet.com/investing/doug-kass-my-contrarian-bullish-case-for-equities-16050390
This morning’s post-CPI reaction may end up being the best downside fake-out of all.
Larry Summer’s group has reconstructed CPI data back to 1949 using modern methodology and have made some conclusions. The data is freely available.
COMPARING PAST AND PRESENT INFLATION, NATIONAL BUREAU OF ECONOMIC RESEARCH
https://www.nber.org/system/files/working_papers/w30116/w30116.pdf
Recent work suggests that the years following World War II have strong similarities to the current inflation environment (e.g., Rouse et al., 2021; DeLong, 2022). We show that due to the greater weight of transitory goods components —especially food and apparel— in the index of the 1940s and 1950s, past inflation spikes were higher and more shortlived than today’s. When using current weights, we estimate that the peak of core CPI inflation in June 1951 falls from 7.2 to 5 percent, and the peak of headline CPI inflation falls from 9.4 to just 3.3 percent. These two points serve as a caution against overly optimistic forecasts of an inexpensive disinflation in the current cycle —the disinflation that needs to be achieved now is large by historical standards.