Preface: Explaining our market timing models
We maintain several market timing models, each with differing time horizons. The “Ultimate Market Timing Model” is a long-term market timing model based on the research outlined in our post, Building the ultimate market timing model. This model tends to generate only a handful of signals each decade.
The Trend Model is an asset allocation model which applies trend following principles based on the inputs of global stock and commodity price. This model has a shorter time horizon and tends to turn over about 4-6 times a year. In essence, it seeks to answer the question, “Is the trend in the global economy expansion (bullish) or contraction (bearish)?”
My inner trader uses a trading model, which is a blend of price momentum (is the Trend Model becoming more bullish, or bearish?) and overbought/oversold extremes (don’t buy if the trend is overbought, and vice versa). Subscribers receive real-time alerts of model changes, and a hypothetical trading record of the those email alerts are updated weekly here. The hypothetical trading record of the trading model of the real-time alerts that began in March 2016 is shown below.

The latest signals of each model are as follows:
- Ultimate market timing model: Buy equities
- Trend Model signal: Bearish
- Trading model: Neutral
Update schedule: I generally update model readings on my site on weekends and tweet mid-week observations at @humblestudent. Subscribers receive real-time alerts of trading model changes, and a hypothetical trading record of the those email alerts is shown here.
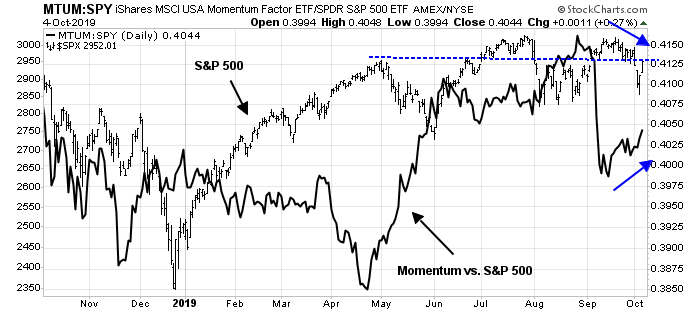
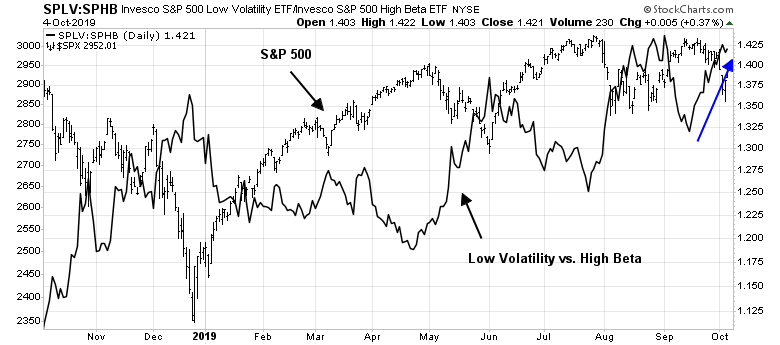
An update on the Momentum Massacre
Remember the Momentum Massacre? Too many investors were in a crowded short in the stock market. The cautiousness was manifesting itself in the price momentum factor, which was showing up in low volatility, low beta, defensive, and value stocks. The crowded short and long momentum trade began to unwind in late August, and accelerated when the SPX staged an upside breakout from its trading range at 2960 in early September.
The reversal was dramatic enough that JPM quant Marko Kolanovic called it a “once in a decade trade” (per CNBC). He made the case that both hedge fund and institutional positioning was too cautious, and a short-covering rally would spark a stampede by the slow moving but big money institutional behemoths to buy beta. Moreover, the reversal could also be a signal for a long awaited turn from growth to value investing.
Since then, returns to the price momentum factor has stabilized and begun to turn up again. It is time for an update.
More importantly, our analysis of the returns to differing factors and sectors is revealing of likely future market direction.
A factor and sector update
Here is what has happened since the Momentum Massacre. So far, the institutional stampede into equity beta has not materialized. The long low volatility and short high beta pair trade has begun to turn up again, indicating a continued reduced equity risk appetite.
Credit market risk appetite, as measured by the relative duration-adjusted price performance of high yield (junk) bonds, remain in the doldrums.

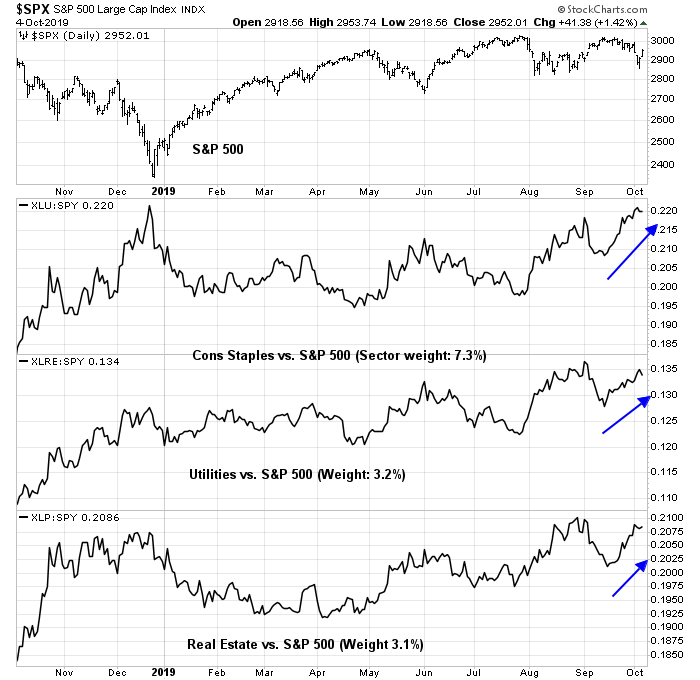
In addition, the relative performance of defensive sectors have been recovering, even before last week’s dramatic market sell-off.
A subtle change in leadership
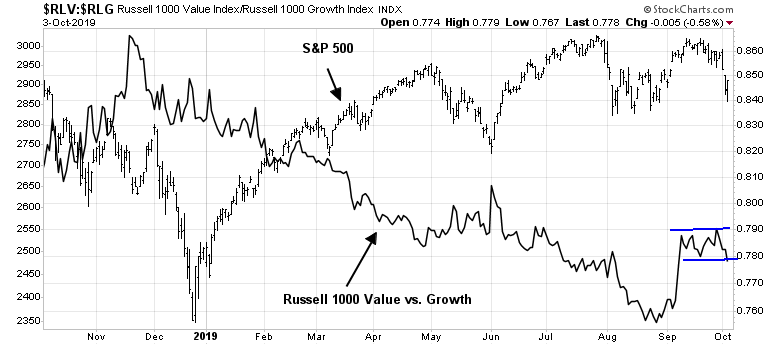
The market action in the wake of the Momentum Massacre reveals a subtle change in leadership. The growth to value style relationship predictably reversed when the price momentum factor cratered. However, value and growth relative performance has stabilized and remained range-bound. Unlike the other factors, growth did not recover and resume its relative uptrend.
This is attributable to the faltering leadership of the high octane NASDAQ stocks. An analysis of the absolute and relative performance of the NASDAQ 100, however, shows the weakened position of this part of the market.

The market is falling out of love with growth, and especially loss making hyper-growth stories. This was evident by the less than enthusiastic reception of the WeWork IPO, and the disappointment response to delivery misses at Tesla. If these conditions were to continue, it would mean a liquidity squeeze at the high growth and loss making part of the market, which could crash risk appetite.

Before the Momentum Massacre, stock prices were being partially held up by NASDAQ leadership even as the Street pivoted to low-beta and defensive names. In other words, investors were holding a barbell portfolio of NASDAQ and defensive stocks. Now one end of the barbell, the high octane NASDAQ stocks, is breaking.
The only visible sector leadership is the defensive sectors. An analysis of cyclical stocks show that they cannot be relied upon for leadership, with the possible exception of semiconductors.
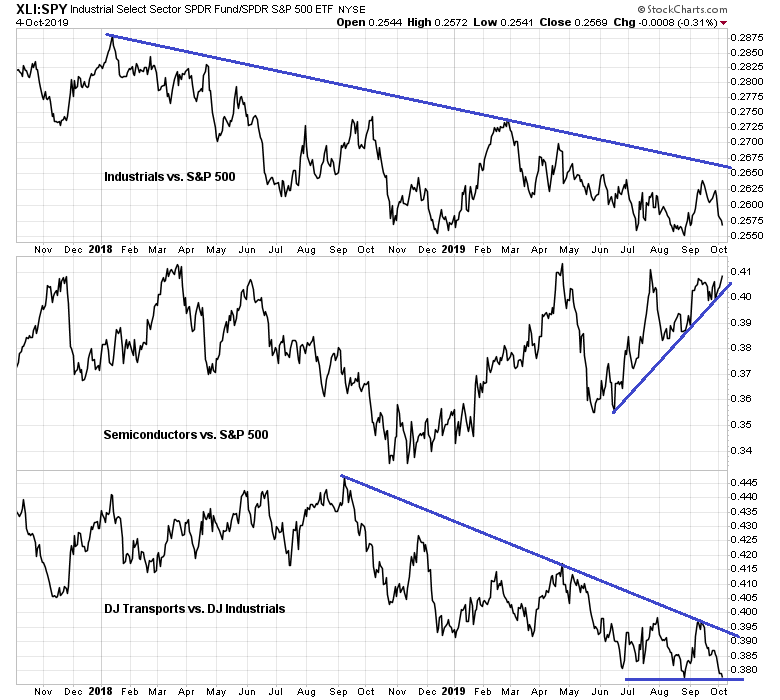
The combination of a lack of either growth or cyclical leadership and the defensive sectors the only men left standing leads me to conclude that the path of least resistance for stock prices is down.
Where’s the valuation support?
I reiterate the view from early August (see Powell’s Dilemma and why it matters) that the US economy is not headed for a recession, which takes the risk of a major bear market off the table. However, valuations were elevated and the stock market was in need of a valuation reset.
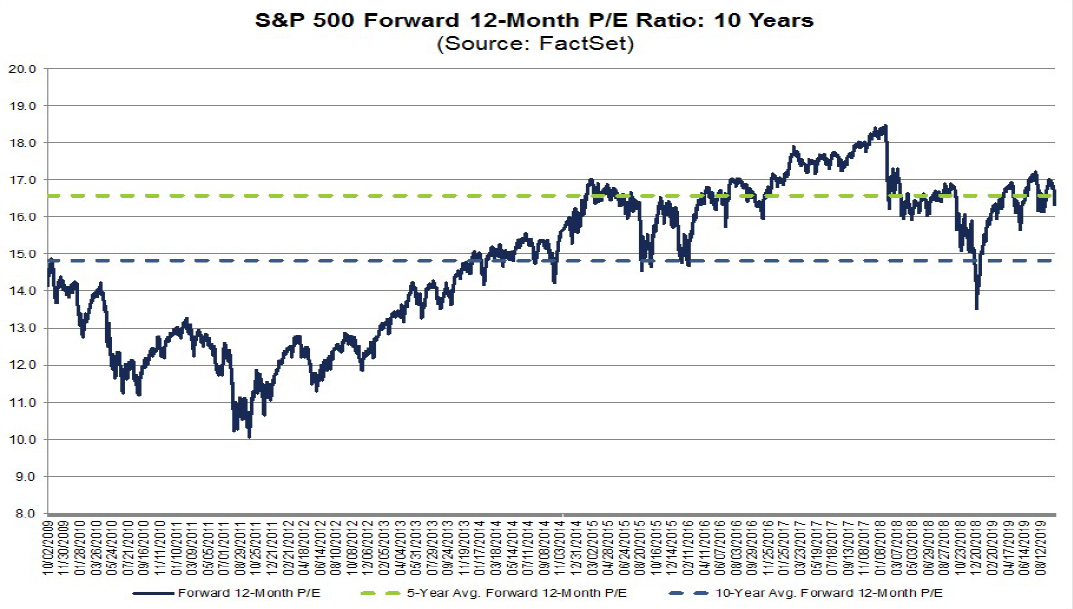
The S&P 500 is trading at a forward P/E ratio of 16.5, which is slightly below its 5-year average of 16.6 and above its 10-year average of 14.8. Valuations are mildly elevated, but stocks are neither wildly cheap nor expensive.
What about the E in the forward P/E ratio? Analysis from Yardeni Research, Inc. reveals that forward 12-month estimate revisions have been flat to down. While readings can be volatile on a week-to-week basis, mid and small cap estimates have been consistently trending downwards, and large cap estimates fell last week. In the absence of a bullish catalyst, such as a surprise US-China trade deal, it is difficult to see how US stock prices could rise very much in the face of mildly elevated valuations and weak estimate revisions.

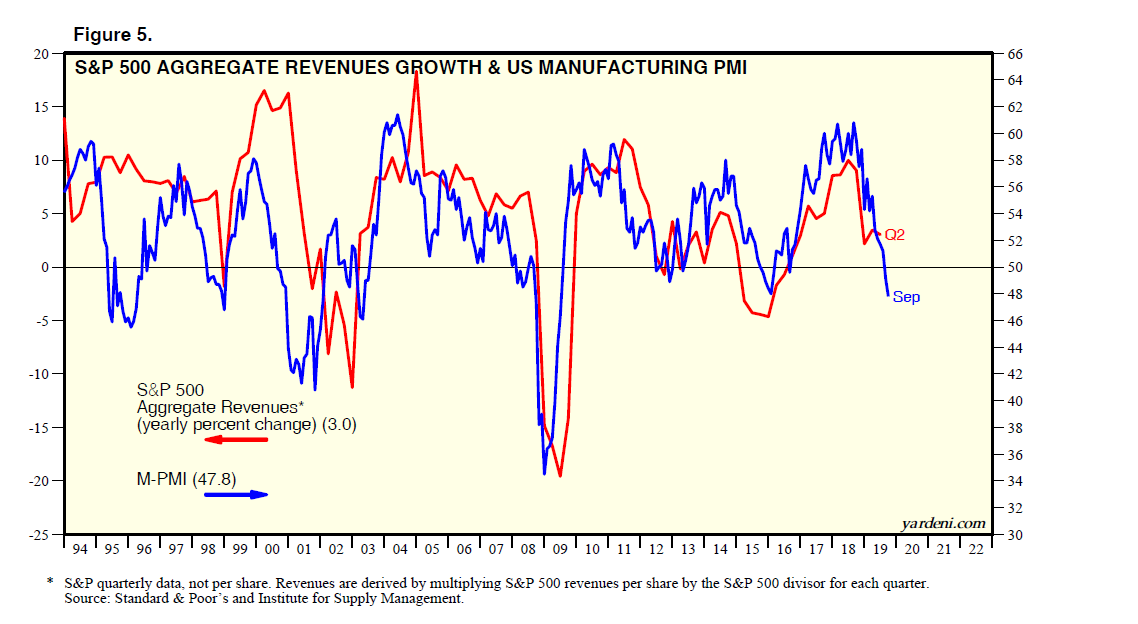
Ed Yardeni also observed that the soft ISM Manufacturing PMI is bad news for S&P 500 revenues as the two series have historically been closely correlated with each other.
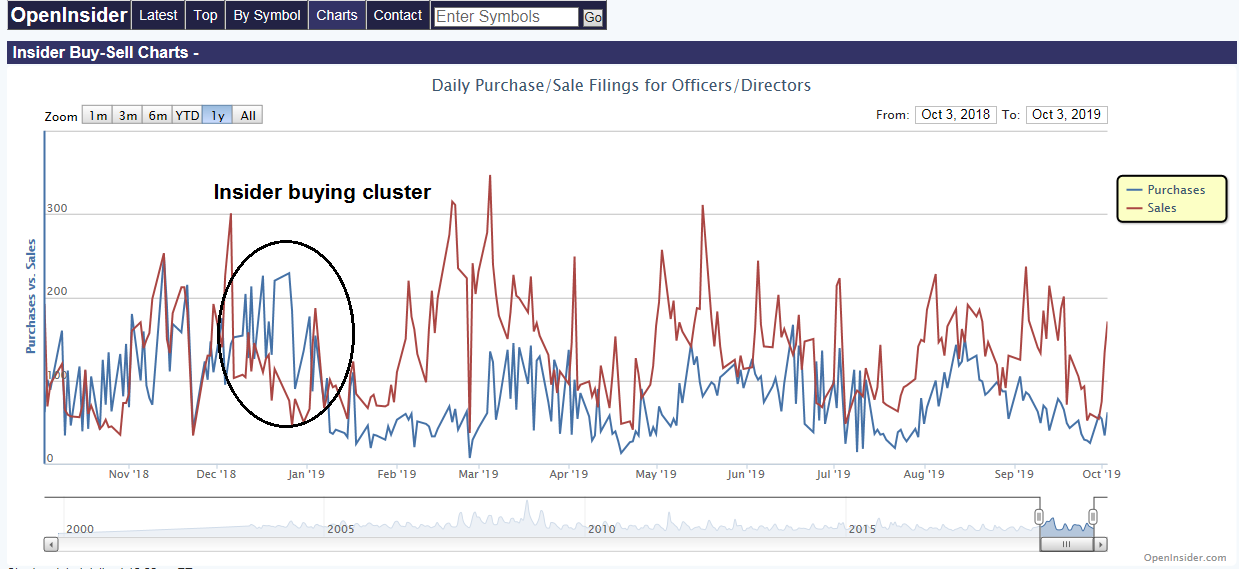
As well, upside potential may be limited because the market is not being supported by insider buying.
That said, the American economy is not at risk of a recession despite the recent market angst over the soft ISM data. New Deal democrat monitors high frequency economic releases and categorizes them into coincident, short leading, and long leading indicators. His latest update shows while manufacturing may be in a slowdown, the consumer is very strong, and there is little chance of a full-blown recession.
The forecast across all time frames remains positive, although the recently volatile short-term forecast is only weakly so. Please note that the less timely but more reliable index of short leading indicators is negative primarily due to a heavier weighting of manufacturing measures, as I wrote about earlier this week. Also note the global weakness reflected in the further decline in commodity prices. The indication is that the manufacturing/production side of the economy is in recession, but it has not brought down the much larger non-manufacturing consumer sector, which remains very positive.
In the absence of recession risk, downside risk is limited. In the study I published in early August, I had projected downside risk of 2591 to 2891, with the mid-range at 2738. The subsequent market weakness pushed the index into the upper end of that range. I stand by my previous analysis. Current conditions suggests that the valuation reset is incomplete.
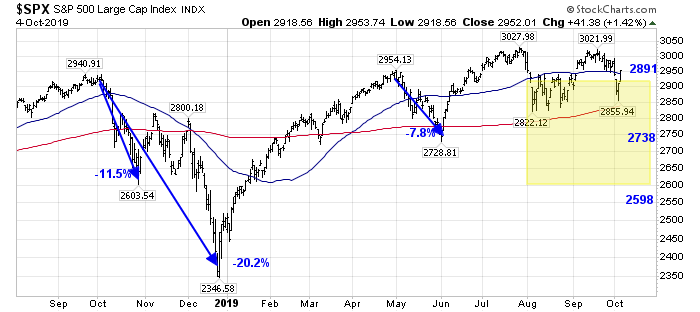
Downside risk is well within the normal parameters of equity risk. The maximum projected drawdown from current levels is only about 10%. Be patient, and you should be able to deploy cash at more attractive levels.
The week ahead
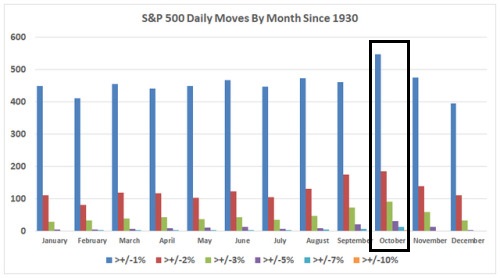
I have been calling for a return of volatility in these pages (see Where have you gone, Vol-a-tility) and it arrived in spades last week. In fact, Jeff Hirsch at Almanac Trader pointed out the month of October has historically seen the highest realized volatility. Last week’s market action featured a dramatic sell-off and an equally dramatic rebound.
Is the correction all over? Is it safe for investors to get back in the water?
I don’t think so. Firstly, sentiment models are not flashing signs of capitulation that are usually observed at intermediate term bottoms. As an example, last week’s AAII weekly sentiment survey saw the bull-bear spread decline, but levels are not low enough to be contrarian bullish. Past signals at these levels have historically been a hit-and-miss affair.

Mark Hulbert thinks so too. His Hulbert Stock Newsletter Sentiment Index (HSNSI) is not at levels that are fearful enough for durable market bottoms.

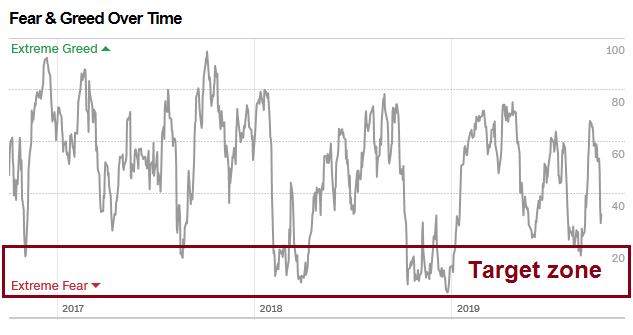
Similarly, while the Fear and Greed Index has fallen, readings are not low enough seen at past bottoms indicating bearish capitulation.
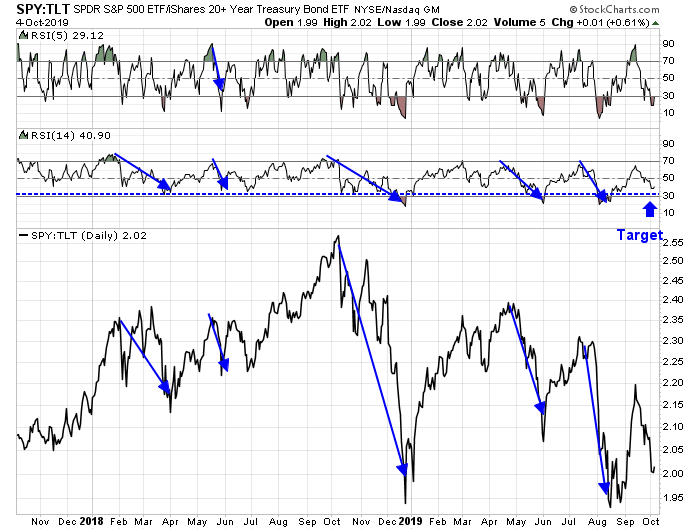
From a technical perspective, the stock/bond ratio (SPY/TLT) has not reached sufficiently oversold levels seen at past bottoms either.
Tactically, the market did become sufficiently oversold to warrant a relief rally. Subscribers received email alerts on Wednesday and Thursday outlining the trading tripwires under which I would cover my short positions, which was done near the close on Thursday. The short covering trigger was the VIX Index falling below its upper Bollinger Band after closing above. However, I did not flip from short to long because I believed the rally is nothing more than a dead cat bounce.
How far can the bounce go? An examination of past VIX upper BB bounce signals reveals some clues. In the past, the relief rally has petered out at about a 61.8% Fibonnaci retracement level. If history is any guide, that would put the short-term upside target at the resistance level of 2960, which also acted as resistance during past upside breakouts.
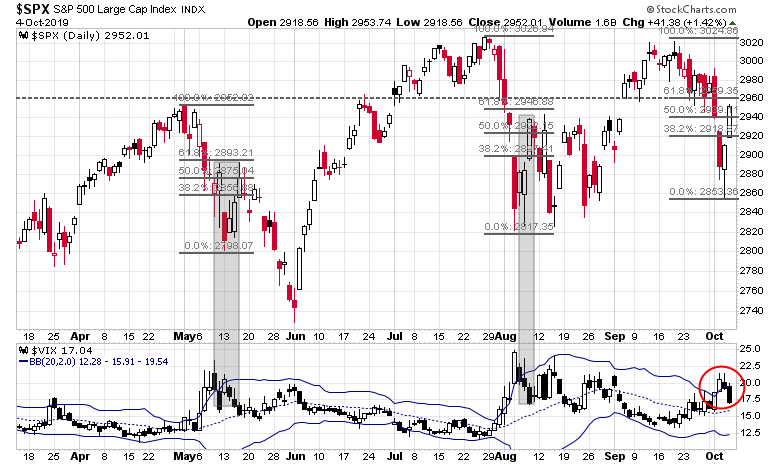
In the short run, traders can expect possibly one or two more days of strength before the rally stalls. Past VIX BB rebound signals has seen momentum indicators reach overbought levels as shown in the chart below.

My inner investor remains defensively positioned and underweight equities. My inner trader took profits in his short positions late last week. He is waiting for a rally near the 2960 level before re-entering his short position in anticipation of further price downside in the weeks ahead.
Good write-up, Cam. You have a knack for posting what your readers need to hear and when they need to hear it.
That said, your comment- ‘In the absence of a bullish catalyst, such as a surprise US-China trade deal, it is difficult to see how US stock prices could rise very much in the face of mildly elevated valuations and weak estimate revisions.’- is where I’m focused. Whereas a failure in negotiations was the surprise risk early in the year, the surprise risk now becomes signs of real progress. (Although a case can be made that most traders are closet trade talk bulls, and the real surprise may in fact be another failure!)
The first 2 charts are the most telling.
I remember when there was all the angst over Greece, but I can’t remember a time when there was such uncertainty of catalysts for the bear/bull sides…from trade war, to impeachment, to socialist democrats, to FOMC….seems there is always something
There has in fact always been something. In the Nineties, we had the Clinton impeachment proceedings + a trade war with Japan + the Asian financial crisis. Ultimately, the markets survive the uncertainty.
VIX for me will be indicative tomorrow and rest of week. Its made a comeback.
Cam, assuming we have correction follow through in the weeks ahead. When its time to deploy cash, do you
have an opinion on what factors, sectors, industries may outperform the broad market on a relative basis?
Thanks
One step at a time. Let’s see how the market internals behave then, and then make a judgment call on what sectors or groups are likely to outperform.
In a low rate (and going lower) environment, REIT and ITB stocks should outperform, regardless what happens in the near future. As usual, the hot and fast money will drive them into unsustainable levels. But we can make nice money on the way up. Just don’t be greedy.
McClellan’s analysis of AAII sentiment data shows washed out sentiment. He is sounding bullish.
https://www.mcoscillator.com/learning_center/weekly_chart/aaii_survey_shows_sentiment_washout/