Preface: Explaining our market timing models
We maintain several market timing models, each with differing time horizons. The “Ultimate Market Timing Model” is a long-term market timing model based on the research outlined in our post, Building the ultimate market timing model. This model tends to generate only a handful of signals each decade.
The Trend Asset Allocation Model is an asset allocation model that applies trend-following principles based on the inputs of global stock and commodity prices. This model has a shorter time horizon and tends to turn over about 4-6 times a year. The performance and full details of a model portfolio based on the out-of-sample signals of the Trend Model can be found here.

My inner trader uses a trading model, which is a blend of price momentum (is the Trend Model becoming more bullish, or bearish?) and overbought/oversold extremes (don’t buy if the trend is overbought, and vice versa). Subscribers receive real-time alerts of model changes, and a hypothetical trading record of the email alerts is updated weekly here. The hypothetical trading record of the trading model of the real-time alerts that began in March 2016 is shown below.

The latest signals of each model are as follows:
- Ultimate market timing model: Sell equities
- Trend Model signal: Neutral
- Trading model: Bullish
Update schedule: I generally update model readings on my site on weekends and tweet mid-week observations at @humblestudent. Subscribers receive real-time alerts of trading model changes, and a hypothetical trading record of those email alerts is shown here.
Subscribers can access the latest signal in real-time here.
Testing support
As the S&P 500 tests a key support level just above its 200-week moving average and while exhibiting a series of positive RSI divergences, I am seeing five constructive signs that the market may be forming a short-term bottom.

Supportive breadth
The first is better underlying breadth. Even when the S&P 500 struggled at a key support level, the mid- and small-cap S&P 400 and Russell 2000 held support in more solid manners.

A momentum rebound
Friday’s strong gains on high volume qualified as a Follow-Through Day, as specified by William O’Neil, which is a sign of strong price momentum.
A follow-through day occurs during a market correction when a major index closes significantly higher than the previous day, and in greater volume. It happens Day 4 or later of an attempted rally. Leading up to a follow-through day, an attempted rally takes place during a downtrend when a major index closes with a gain. The rally attempt continues intact as long as the index doesn’t make a new low.
Follow-through day variables include: an index closing sufficiently above 1% on increased volume, positive behavior of leading stocks, and improved market action regarding support vs. resistance levels. The most powerful follow-through days often happen Day 4 through Day 7 of an attempted rally.

From a longer term perspective, the 10 dma of the NYSE McClellan Oscillator recycled from an extreme oversold level, indicating price momentum turnarounds. There have been eight instances of this signal since 1998. All of them coincided with strong short-term market rebounds.

Signs of a cyclical bottom
As the global economy weakens, a recession call has become the consensus view. Ned Davis Research’s global recession model shows a 98% chance of a global recession.

Similarly, the BoA Global Fund Manager Survey shows that economic weakness has become the overwhelming consensus.

In light of this bearish macro backdrop, expectations for Q3 earnings season have been diminished. While it’s still early, the EPS beat rate is below average while the sales beat rate is above average. In short, the preliminary verdict on Q3 earnings season is better than some of the dire expectations when the reporting period began.

The cyclically sensitive copper/gold and base metals/gold ratios have been flat to up since July, which is also inconsistent with the expectation of global weakness.

Europe FIFO
I speculated in late August about the spillover effects of European weakness (see Will Europe drag us into a global recession?). At the time, the EU was beset by high energy prices because of the Russo-Ukraine war and fears of de-industrialization loomed. Even today, the BoA Global Fund Manager Survey shows that the Eurozone is the second lowest regional underweight behind the UK.

At the time, I set out two bullish tripwires based on the first-in-first-out principle. Europe was the first to enter a recession, and if signs emerged that it was beginning to emerge out of a slowdown, that would be a positive sign for risk appetite. Both of those tripwires have been triggered.
The first was the BASF and Dow Chemical pair trade. Both companies are giant chemical companies whose stock prices had historically tracked each other closely. BASF dramatically lagged against Dow when the war began, but now it has staged a relative breakout out of a base.

In addition, MSCI Poland has staged a relative breakout out of a downtrend against the MSCI All-Country World Index (ACWI), with both vehicles measured in USD terms. I interpret this to mean that geopolitical risk is fading in Europe.

First in, first out. These are the signs of green shoots of global risk appetite.
Sentiment still washed out
Lastly, sentiment models are still washed out, which is contrarian bullish. Investors Intelligence sentiment is showing more bears than bulls, which is an unusual and excessively bearish condition.

The latest AAII weekly survey still shows far too many bears. Both the bull-bear spread and bearish percentage are consistent with major market bottoms. While stock prices can weaken further from these sentiment levels, bearish investors would have to be betting on a major financial crisis like the Lehman Crisis in order to realize more downside.

In conclusion, a combination of factors, namely positive breadth, improving price momentum, signs of cyclical strength, European turnaround, and excessively bullish sentiment, are serving to signal a possible tactical bottom and put a floor on stock prices.
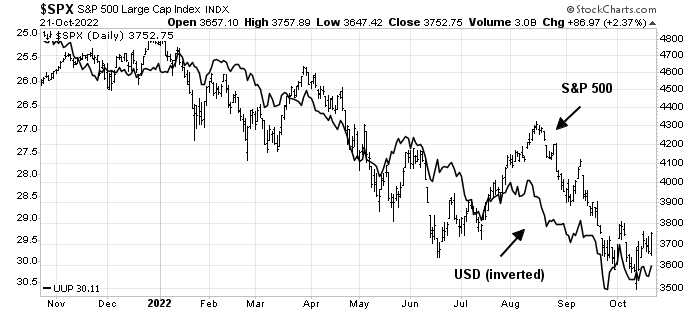
However, investors should recognize that the current environment has been dominated by a single macro trade, the inverse correlation of the S&P 500 with the USD, which is a two-edged sword. Should interest rate expectations rise further to boost the dollar, it would represent a significant headwind for stock prices. On the other hand, now that Fed speakers are in a blackout period ahead of the November FOMC meeting and the last comments were less hawkish than expectations, the price momentum of that commentary has the potential to spark a risk-on stampede without interruption or contradiction from Fed officials.
Disclosure: Long SPXL
Last Friday’s action was certainly constructive for the bulls, but it should be noted that no IBD-FTD follow through day has completed its 10 day count in 2022, they all failed after 6 days or less and there were 5 others preceding this last attempt. This doesn’t mean that a rally couldn’t follow the FTD failed count which usually involves price falling back below the FTD and in fact there were two rallies that did reasonably well for the bulls: the mid March rally and the July-August rally.
https://i.imgur.com/RsCmuKD.png
By some metrics such as the plot of cumulative NYSE 52wk HiLo Difference (bold red line with interspersed yellow-white-green on chart) is dropping sharply while SPX is rising rapidly – this is quite bearish and unsustainable. We saw this divergence (red dots showme above price bar) during the March 17 rally and the July 20 rally where the cumulative line actually flattens and made a case for continuing rally, but in this case Monday, it is diverging and this rally is likely to fail unless market breadth improves rapidly. The lone red dot on 6/2/22 showed what happened when breadth flattened and failed – it was a quick 12% drop in 10 trading days.
https://i.imgur.com/u6W4oFQ.png
Today Tuesday morning is a first confirmation of this rally with cumulative NYSE 52wk HiLo diff making a substantial curl up and flattening (red bold line on the leading edge). This suggests that market breadth is catching up to price which is leading and there is less of a chance that the market will drop out from here. So in this bear market rally which is now appearing to be similar to the previous two of 2022, one in March and another July-Aug, this is likely to continue up until this flattening falls.
https://i.imgur.com/i2B6H0U.png
china is tanking and dragging down the rest of the world with it