Mid-week market update: How far and long can this rally run? Here is one way of determining upside potential. The S&P 500 staged an upside breakout through an inverse head and shoulders pattern, with a measured objective of about 4120, which is the approximate level of the 200 dma.

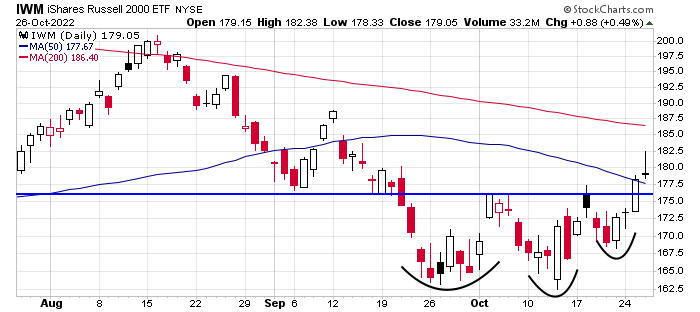
The inverse head and shoulders breakout is even more evident using the Russell 2000, which staged an upside breakout through its 50 dma.
The bull case
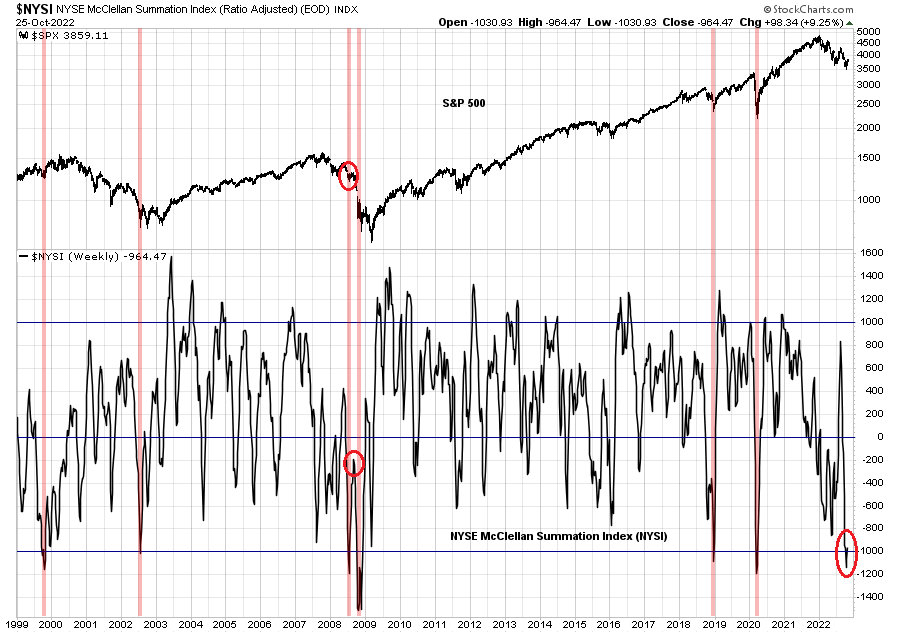
Here are some reasons why that this rally has a lot further to run. The NYSE McClellan Summation Index (NYSI) just recycled from an extreme condition of below -1000, which has always sparked a relief rally in the past. As well, rallies usually haven’t stalled until returned to the zero neutral line. The only exception occurred in July 2008, when the rally petered out with NYSI at -200.
The S&P 500 has been inversely correlated to the USD for all of this year. The USD Index has been weakening and just violated a minor rising trend line, though the longer term uptrend remains intact. At a minimum, this argues for a period of consolidation for the USD and therefore stock prices instead of a stock market decline back to test the old lows.

What to watch
It’s always more difficult to call tops than bottoms, but here are some other signposts that I am watching from a short-term tactical viewpoint. The NYSE McClellan Oscillator (NYMO) reached an overbought condition yesterday. The last two bear market rallies of 2022 saw NYMO trace out negative divergences before finally topping, and tops were accompanied by either near-overbought or overbought conditions on the 14-day RSI. We’re quite there yet.

The three to one-month term structure of the VIX is upward-sloping, but the one-month to nine-day term structure is inverted. As more and more option players have migrated to short-term options, the shorter-term structure is still indicative of fear, which is contrarian bullish.

The two bear market rallies of 2022 saw the 10 dma of the equity put/call ratio fall below the 200 dma. While readings are close, the cautionary signal hasn’t been triggered yet.

That said, ITBM flashed a well-time buy signal last week, by its 14-day is nearing an overbought condition, which would be a warning that the rally could stall at any time.

Stay tuned. In addition to the volatility induced by earnings season, investors will have to look forward to the uncertainty of the FOMC meeting next week.
Disclosure: Long SPXL
The measured move to 4120 implies another 8% move up from today’s close, on top of almost 9% move up. Some indicators are bullish while others are neutral. Earnings are mixed at best.
The Fed and elections are two macro events in the next two weeks.
What are the odds of a move to 4100 area?
https://twitter.com/CGasparino/status/1585678718072233985
BREAKING: Economists at @BlackRock are telling financial advisers that they expect “pivot language” at the next @federalreserve meeting when they expect Powell to announce a 75 BP FF hike followed by two smaller ones and a pause to get us to around 4.75%.
How reliable is the source? Anyone knows?
WSJ has been a more reliable source recently.
somewhat reliable I feel….. as BoC “only” hiked 50bps this week, with some mild pivot language of their own
Back in the Bay Area after a week in Honolulu to celebrate my wife’s birthday. One sign of a looming recession might be the restaurants. For the most part, we scheduled reservations at the same places we liked in June 2021 (another sign – it was obvious after the fact that reservations were unnecessary) – however, with a few exceptions, the meals were disappointing, almost as if the owners were already cutting back on quality in response to declining business. Sure, it’s October and not June – but that’s never an excuse to disappoint customers. IMO many of these places will no longer be in business next year.
The other notable change was that most residents/visitors no longer mask up.
AMZN after hours reaction looks like an obvious bear trap for the indices – S&P futures just backtested the inverse head and shoulder breakout and is currently bouncing. But Nasdaq 100 couldn’t even get back to the 50-day and may turn out to be a drag on SPX which couldn’t close above the 50-day so far. Would still expect this rally to continue, all the money in non-dividend paying stocks needs to go somewhere. German DAX for instance continuing to break out so far.
I tend to agree with Mark Hulbert’s latest column, which can be paraphrased as:
(a) People are (still) looking hard for reasons to go long.
(b) When they stop looking, then it might be time to start thinking about buying back in.
SPX is poised to close above 3841 by end of today, Friday 10/28/22, which means the long term SPX price reversal model for the consistently index beating strategy since 1947 should flip to the long side using the weekly chart. This model last went to short (or to cash or commercial paper) on 09/02/22 near SPX 3971 but most notably it was short starting on 01/21/22 near SPX 4400 which provided a clear signal for a change of trend – this is the most useful aspect of this strategy as it provides a multi-week look at possible trend direction.
https://i.imgur.com/u9megua.png