In light of the dismal performance in the first nine months of a 60/40 portfolio in 2022, it’s time to ask, “What’s changed and what adjustments should investors make to their portfolios?”

The answer is inflation, and it’s a game changer. The correlation between stocks and bond increasingly rise as inflation rises. In a low-inflation environment, the correlation is slightly negative, indicating moderate diversification effects. In a high-inflation environment, stock and bond returns becomes correlated, which was demonstrated in the bear market of 2022.

The inflation picture
The global inflation picture looks dire. Inflation rates are surging all around the world/

In response, central banks around the world have raced to hike interest rates and raised the risk of a global recession.

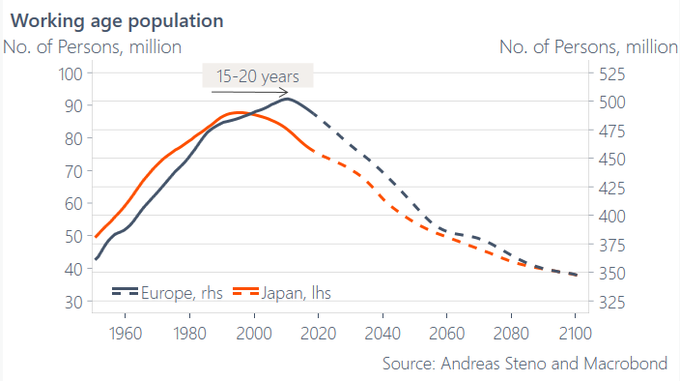
While the current inflation acceleration is cyclical in nature, the long-term secular trend is worrisome. A BIS study found a link between age demographics and inflation: “A larger share of young and old in the population is associated with higher inflation.”

As the population of advanced economies ages, inflation pressures from demographics will present a challenge for policy makers in the coming decades.
The Fed’s response
Notwithstanding the long-term problems of inflation, the Fed has made it clear that bringing inflation back to its 2% target is its primary focus. The September Summary of Economic Projections (SEP) is a succinct outline of its economic projections and expected policy response.
The changes in projections from the June SEP to September SEP highlight the broad outline of the Fed’s thinking:
- Recession ahead: 2022 GDP growth was dramatically downgraded from 1.7% to 0.2%, but it’s projected to bounce back to 1.2% in 2023. Reading between the lines, that projection doesn’t sound plausible at unemployment is projected to rise in 2023 and so are interest rates. In other words, the Fed is expecting a recession, but it’s published a soft landing scenario for political reasons.
- Decelerating inflation: Core PCE inflation is projected to peak in 2022 at 4.5% and decelerate to 3.1% in 2023 and 2.3% in 2024, which is near the Fed’s 2% target.
- A rates plateau: The median Fed Funds rate ends 2022 at 4.4%, plateaus in 2023 at 4.6%, and gradually falls afterward.

Reuters reported that the theme of frontloading rate hikes is consistent with what was voiced by St. Louis Fed President James Bullard:
A “hotter-than-expected” September inflation report doesn’t necessarily mean the Federal Reserve needs to raise interest rates higher than officials projected at their most recent policy meeting, St. Louis Fed President James Bullard said on Friday, though it does warrant continued “frontloading” through larger hikes of three-quarters of a percentage point…
After delivering a fourth straight 75-basis-point hike at its policy meeting next month, Bullard said “if it was today, I’d go ahead with” a hike of the same magnitude in December, though he added it was “too early to prejudge” what to do at that final meeting of the year.
If the Fed follows through with two more 75-basis-point hikes this year, its policy rate would end 2022 in a range of 4.50%-4.75%.
San Francisco Fed President Mary Daly said Friday, just ahead of the media blackout ahead of the FOMC meeting, that she wants to avoid putting the economy into an unforced downturn by overtightening, “I want to make sure we don’t overtighten just much as I want to make sure we don’t undertighten.” She added that the SEP Fed Funds rate forecast, which amounted to a 75 bps hike in November and followed by 50 bps in December, was a “good projection” and argued for rate hikes to slow to a 50 or 25 bps pace after the November meeting.
Current market expectations calls for a terminal rate of under 5% in 2023, with easing to begin late in the year. This is consistent with the Fed’s stated course that it will pause but not ease prematurely because of the fears of a policy error that ignites a 1970’s style inflationary spiral.

Good news on inflation
Despite all of the angst about broadening inflation dynamics, an analysis of the underlying trend indicates that inflation is peaking and will decelerate in the near future.
A disaggregation of PCE inflation trends shows that the inflation shock is mainly attributable to COVID-19 and the Russo-Ukraine War. Moreover, much of the supply-driven inflation is starting to diminish and roll over.

As for the hot September CPI report that came in ahead of expectations and rattled markets, the overshoot can be attributable to Owners’ Equivalent Rent (OER), which is a large weight in CPI. An analysis of core CPI ex-OER shows a clear trend of deceleration.

OER is a lagging indicator, which is a problem for Fed policy makers. Paul Krugman pointed out that an analysis from Goldman Sachs found that average alternative metrics of rental rates show that rents are rising at about 3% and decelerating, compared to the accelerating September BLS OER rate of 6.8%.

Jason Furman substituted Zillow’s new rent data into core CPI and found a similar trend of deceleration, though the alternative core CPI measure shows greater volatility.

As for the Fed’s fears of a 1970’s style wage-price spiral, relax. Wage increases are starting to top out. While job switchers are enjoying better raises than job stayers, which is an indication of a tight labor market, the rate of increase for both switchers and stayers is rolling over.

Moreover, an IMF study concluded that wage-price spirals are rare.

None of this means that the Fed should pivot from tightening to easing, but it does mean that inflationary pressures are starting to ease and an interest rate pause should be closer than the market expects. I would argue that the Fed is fighting the wrong war by targeting wage inflation. The main enemy during the inflationary 1970’s was the enormous power they wielded by unions and the Fed was correct in breaking the wage-price spiral then. The policy problem today should be the ability of companies to raise their prices in response to inflationary pressures. Pretax margins fell during the 1970’s when inflation rose. Today, margins are rising in lockstep with inflation as corporations have been able to pass through price increases.

It’s become all one trade
Here is what all this means for investors. The intense market focus on Fed policy has translated into a single one-factor Fed policy factor trade.
The Fed’s balance sheet (blue line) is inversely correlated to real 10-year Treasury yields (red line).

The Fed’s balance sheet (blue line) is also inversely correlated to the trade-weighted dollar (red line, inverted scale) as Fed tightening has driven up the USD and exported inflation abroad.

Finally, the S&P 500 (red line) is highly correlated to the Fed’s balance sheet (blue line). By extension, it has become all the same factor trade – liquidity, real yields, the USD, and stock prices.

Here is a chart of the USD Index since 1980 along with its 20-month Bollinger Band and the S&P 500. Past overbought episodes of the USD have occurred during periods of positive correlation with the S&P 500. The current period is highly unusual inasmuch as it is occurring during a period of S&P 500 weakness for the reasons already cited. The greenback is very extended and fault lines are appearing around the world. Japan and China have intervened to stabilize their currencies, and the UK has experienced funding stress. Either an inflation or crisis driven pivot should occur in the near future.

Investment implications
I began this publication by rhetorically asking the question of how investors should adjust their portfolios in response to high inflation. The analysis from JPM Asset Management outlines how asset classes perform in different inflation environments.

Jim Paulson at Leuthold Group further analyzed the S&P 500 during rising and falling inflation under high, medium, and low inflation regimes. If my analysis of decelerating inflation is correct, the S&P 500 is about to undergo a period of strong returns in the coming months.

In conclusion, rising inflation has played havoc with 60/40 portfolios as bond prices haven’t provided a counterweight to falling stock prices. A study reveals that underlying inflation trends are decelerating. which should be positive to risk appetite expectations. The inflation and market pivot is just around the corner and it may be closer than the market expects.
Personally, I would stick with sectors that have done well this year and will continue to do well in an inflationary environment: Oil, Oil Drillers and Metals and mining. FYI, Exxon (XOM) made a new high. All the above sectors are up for the year in a very sharp bear market.
My baseline with all of this is the chart Cam showed a couple of months ago indicating that EVERY single time the FED enters a rate tightening cycle the final FED’s cash rate is greater than the current CPI at the end of tightening cycle.
Cam says that ” Current market expectations calls for a terminal rate of under 5% in 2023, with easing to begin late in the year.” According to the “Meeting Probabilities” table this peak will be in February next year.
Therefore the key question is do we expect inflation to be down to 5% by Feb. 2023? On the evidence I have seen above this is hard to see. Inflation may have peaked, but there seems to be little evidence of the deceleration yet especially since Cam indicates” that margins are rising in lockstep with inflation as corporations have been able to pass through price increases.” Wage rate increases may have also peaked but in absolute terms they are still high.
I am also surprised by the statements indicating that there is a weak link between unemployment / wages and prices. I think that the Phillips curve says otherwise and that there are quite a few studies supporting this. It may not be a massive wage-price spiral like in the 70’s but the relationship still exists. It only makes sense that in a very tight labour market like now that there will be continuing pressure on wages and therefore prices.
Therefore in summary based on the above it is difficult to see that the “end is in sight” just yet. As a result the market will continue to be surprised putting further pressure on stock prices.
Recall that both the Yellen and Bernanke Fed struggled with the Phillips Curve because it was so flat.
Unofficial Transcript:
St. Louis Fed President and CEO James Bullard’s Remarks at Citi Macro Forum
Oct. 14, 2022
Now, as far as how the disinflationary process work, I’ve been mystified at the discussion around this, that it emphasizes labor markets so much because we just spent a decade saying that the Phillips curve is extremely flat. And so, therefore, you wouldn’t get much disinflationary pressure coming from that channel, at least according to the flat Phillips curves. And even the ones that aren’t quite as flat, there isn’t very much there as far the correlation between labor market action and inflation, at least price inflation.
So, I think the way the disinflationary process is going to work is very different. It’s going to come through product markets instead and the price-setters in the economy. And my interpretation of the 1980s disinflation is that firms had the fear of God in them that if they raised prices too rapidly, they would lose market share. And if that happens, market share leaves permanently; and the company either loses business permanently or just goes out of business altogether
Three things in the 60s and 70s that were different.
1. The gold window was closed in 71, and eventually politicians embraced consequence free spending, which put money into the economy, just like the recent stimulus did, but which hopefully is a one time pandemic deal.
2.Manufacturing was still a great part of the American economy. It is much harder to replace a skilled factory worker than a service employee in a mall, so the unions had power. If the workers at GAP went on strike, one can buy online, and it is easier to replace, until there truly is a shortage of workers. The impact of robotics, technology and AI is profound.
3. America was a creditor, not a debtor. You know the saying “if you owe the bank 100,000 you have a problem, if you owe 100,000,000 the bank has a problem” add more zeroes to bring it up to date if you wish, but as long as the politicians can keep spending, they will, just like if one had 100,000,000 balance on a credit card but no limit to the balance. Until the card is taken away, the spending will go on.
So things may turn out very differently from the 70s.
How this will end, no idea, except it will not likely be nice, but for now, I think it makes sense to follow the trend in prices. If they turn up think long, and own useful things like energy, metals, food.
Saw great comment this week;
Since the GFC investors were rewarded by OWNING ASSETS since bonds, stocks and houses went up and up with the tailwinds of globalization, low inflation, low interest rates, friendly Central Bankers and a peaceful world. Now investors to succeed must MANAGE ASSETS as all of those tailwinds have become headwinds.
Corporate profits are rising with inflation. That says to me inflationary expectations are UN-anchored.
Jurrien Timmer of Fidelity has posted some very interesting twitter threads over the past few days. Worth checking out @TimmerFidelity