Mid-week market update: Recent discussions with readers made me realize that many investors may have become so numb to the endless bearish stock market impulses that they don’t realize how oversold the stock market is. I have highlighted in the past the chart of the NYSE McClellan Summation Index (NYSI) to demonstrate that a reading of under -1000 is rare and historically led to tactical rebounds.

But that’s not the full story. Here is the NASI, which is the NASDAQ version of NYSI. Readings of -1000 are a bit more frequent, but they have led to tactical rebounds with the single exception of the episode in late 2000.

The S&P 500 weekly Williams %R, which is another overbought/oversold oscillator, recently recycled from a deeply oversold reading of -100. While this indicator has shown itself to be an inexact trading signal, it also signaled a deeply oversold condition that has usually resolved in tactical rebounds.

The 5 dma of the percentage of the S&P 500 with bullish patterns on point and figure charts recently fell below 15% before recovering. While historically these signals were slightly early, they have nevertheless indicated a positive risk/reward ratio for bullish positions in the past.

The percentage of NASDAQ stocks above their 200 dma fell below 10% and recovered. These are all signs of a deeply oversold market by any historical measure.

The percentage of S&P 500 stocks above their 50 dma experienced a breadth wipeout in June by falling below the 5% level but recovered to over 90% in a brief period. In the past, such breadth thrusts have always signaled the start of a fresh bull leg – except that the latest buy signal failed and the indicator retreated below 5%. The closest template of current conditions may be the 2008-2009 period. While this indicator did not fail by flashing a buy signal and weaken during that period, it did flash a positive divergence by exhibiting a higher low. So did the percentage of the S&P 500 above their 20 dma. I interpret this to be a constructive sign for the bulls.

Bearish sentiment
Sentiment models have also been very bearish, which is contrarian bullish. The latest BoA Global Fund Manager Survey shows that respondents are extremely overweight cash and underweight equities. Fund managers have built the highest cash levels since April 2001.

The New York Post featured the losses in the average 401k account this year as a contrarian newspaper cover indicator.

Futures positioning is very short financial assets.

The lack of risk appetite is confirmed by Goldman Sachs prime brokerage, which reported net equity positioning at fresh lows.

The bullish catalyst
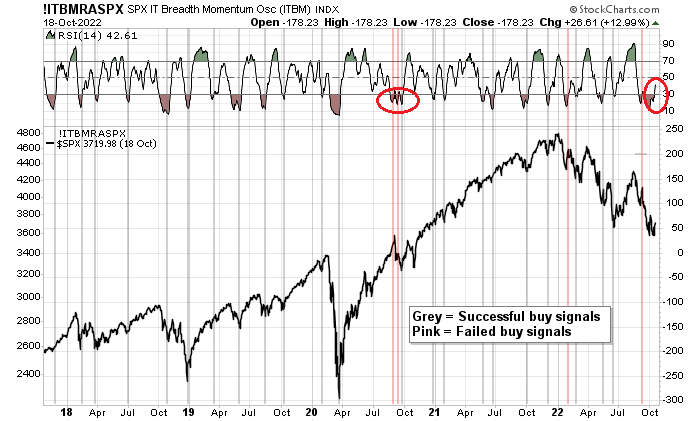
The market just needed a catalyst for a risk-on liftoff. From a technical perspective, the usually reliable S&P 500 Intermediate-Term Breadth Momentum Oscillator (ITBM) just flashed a buy signal when its 14-day RSI recycled from an oversold condition to neutral. There have been 26 such signals in the last five years and 22 have resolved bullishly. The current buy signal is reminiscent of the September 2021 period when the RSI indicator weakened from neutral back to oversold soon after the buy signal. The final buy signal eventually succeeded and the index rallied about 10% on a trough-to-peak basis, which would come to about 3940 on the S&P 500.
From a fundamental and macro perspective, the bullish catalyst could be attributable to two possible factors. The most obvious is the British government’s about-face on its fiscal plan, which sparked a relief rally in the gilt market and Sterling.
Less noticed but equally important is the prospect of better liquidity in the Treasury market. In the wake of concerns expressed by Treasury Secretary Janet Yellen about diminished Treasury market liquidity, Reuters reported that the US Treasury asked banks if it should buy back Treasuries to improve UST market liquidity. Joseph Wang, otherwise known as the Fed Guy, explains:
Treasury buybacks would be a powerful tool that could ease potential disruptions arising from quantitative tightening. The Treasury hinted in their latest refunding minutes of potential buybacks, which is when Treasury issues new debt to repurchase old debt. Buybacks can be used to boost Treasury market liquidity, but more importantly also allow Treasury to rapidly modify its debt profile. By issuing bills to purchase coupons, Treasury could strengthen the market in the face of rising issuance and potentially structural inflation. An increase in bill issuance would also facilitate a smooth QT by moving liquidity out of the RRP and into the banking sector.
Better UST liquidity would be a step to offset the bearish factors posed by the Fed’s QT program.
Key risks
Investors face a number of key risks to any risk-on rally.
- Fed hawkishness: Jenna Smialek of the NY Times report that a pause is not on the Fed’s current trajectory and a 75 bps hike is baked-in at the November meeting. However, this degree of hawkishness has already been discounted by the market. The real question, which no one can answer, is the terminal rate and how long the Fed intends to hold rates at that level.
Federal Reserve officials have coalesced around a plan to raise interest rates by three-quarters of a point next month as policymakers grow alarmed by the staying power of rapid price increases — and increasingly worried that inflation is now feeding on itself.
Such concerns could also prompt the Fed to raise rates at least slightly higher next year than previously forecast as officials face two huge choices at their coming meetings: when to slow rapid rate increases and when to stop them altogether.
- The uncertainties posed by Q3 earnings season: Despite widespread concerns about earnings deterioration, earnings report risks are symmetrical. Indeed, Bianco Research’s corporate guidance index, which measures the rate of positive to negative earnings guidance, is positive for Q3.

- Financial instability in Japan: The USD wrecking ball is wreaking havoc in Japan. The 10-year JGB is edging above the BOJ’s 25 bps yield curve control mark, and the JPY is weakening to new post-1990 lows.

- Geopolitical risk: China recently advised its citizens to leave Ukraine. Other countries that recently either closed their embassies or urged their citizens to evacuate from Ukraine include Belarus, Kazakhstan, Kyrgyzstan, Serbia, Tajikistan, Turkmenistan, and Uzbekistan. All these countries are either Russian allies, or closely aligned with Russia. Do these countries know something the rest of the world don’t know?
- Chinese retaliation in the semiconductor war: The Biden White House recently imposed a set of semiconductor export controls on China that are expected to hobble China’s science and technology ambitions. For a detailed explanation, listen to this podcast with Kevin Wolf, former Assistant Secretary of Commerce for Export Administration. While the announcement has cratered semiconductor stocks, Beijing hasn’t announced retaliation measures and it’s unclear how wide-ranging or the magnitude of the retaliation will be.
In conclusion, these violent market swings tend to be bear market characteristics and my base case scenario for this latest advance is a bear market rally.

How far can the rally run? Assuming that this is a sustained bear market rally and not a two-day wonder, a 10% rebound would take the S&P 500 to about 3940, while the first Fibonacci retracement level is about 3990. The rally will encounter strong resistance at about 4140, which is the intersection of the falling trend line and the 50% retracement level.

Disclosure: Long SPXL
Understood that the market is oversold and poised to rally. However, there have been exceptions in the past, even if only a single exception. Given that the 2022 has been an anomaly with regard to the correlation between stocks and bonds as well as the extent of the decline in bonds – might we be looking at the possibility that 2022 will become the second exception to the rule?
Fed will keep tightening until inflation comes down or something breaks. Long and variable lag of policy means we won’t know the full impact of raising rates for some time. If the Fed pivots because something breaks, the underlying forces stoking inflation will just light up again.
These are interesting times to be an investor.
My personal take is for the rally to have legs we need two things:
1. The long bond to stop to stabilize and stop going down.
2. The dollar strength to weaken.
Also, I would like to see the stock market’s reaction to some bad earning reports. If the stocks don’t go down it will be a positive sign.
How does issuing new debt to pay old debt achieve anything? Who will buy this debt? Is this Hallowe’en QE?
Sentiment was really bad in 2008 prior to the Lehman moment, then things got worse.
If we get a rally I think the levels Cam mentioned will be critical.
There’s lots of liquidity in the short end of the yield curve, the belly and long end, not so much.
https://twitter.com/Callum_Thomas/status/1582872277074739200
‘Long-term [holders] of $TLT have been sent back to 2014.’ That’s including dividends.
This has to be the bear market from hell for 60/40 portfolios.
Cam’s reading of some of his readers’ thoughts is consistent with our cohort’s sentiments. No one has the confidence to trade in size regardless of so many stars lining up auspiciously. Interest rates should show some signs of stabilizing first. That is the Fed’s blunt tool to reduce inflation and the rates are still going up. Ten year is at 4.14 today, while 2 year is at 4.6%!!
The ‘ruling’ reason is interest rates, imo.
The market needs to go sideways and down before it can go up, something like 7/11/22. We saw a sizable drop of 282% in day over day 52WHLND (52 week highs – lows). Sometimes a breadth drop like that can be significant and of the 14 similar instances in the last 12 months, market has gone down in 11 of them and the only 3 other winning instances were ones trading above the 50 day MA.
In addition, there is this $CPCE put call ratio that increased 15.29% today and closing over 1, putting it directly in shorting the market.
There is still plenty of time for a rally to Nov 8, 2022 which is 14 trading days and 20 calendar days away. The market could easily drop 2 to 3% in a few days and then rally for 8% to Nov 8 before dumping to a new 2022 low by late November, which is something that it did between election day in 2008 and days before the 2008 Thanksgiving.
After a string of unlikely gains of about 9.75% in the last 5 trades, this on going breadth momentum reversal strategy runs up to resistance at SPX futures ES 3748. It is good that the bull showed up to defend 3700 as they did this morning, but for now they are stuck below the resistance and it is unpredictable where the market will go. As of 11:30ET this strategy is short ES at 3724.25. It is expected that this strategy will flip flop a lot near resistance and that is where most of the profit drawdown occurs.
https://i.imgur.com/y92OB3z.png
RTY (Russell 2000) breadth reversal buy 16:03 ET at 1711.20 after being short from 1747.80. ES breadth reversal buy at 3882.50 after shorting from 3724.25 earlier.
Both see some breadth reversal near the close.
ES buy at 3682.50 correction, obviously not 38..xx
Another great analysis of the chip ban comes from Ben Thompson of Stratechery on Sharp Tech. The US has shut the door on China with no hope of reconciliation and now the clock is ticking on the Taiwan question and on the United States’ chip supremacy. Innovation is not as hard when you know the outcome is possible.
https://open.spotify.com/episode/6IxQ7Hz5sEKQmZOiDPhjOY?si=Pvszd-hATa6cpI9UCy9zvA&utm_source=copy-link
Nobody knows anything today. Anything people put on media is at best a guess. So what market dynamics is in play today that is unusual? Big banks and hedgies are into what used to be retail’s realm: short-dated options trading. This dynamic basically renders everyday its own ecosystem. There is no continuity from day to next day. In this way, because of dealer gamma hedging, stock price itself becomes third derivative. You’ve got delta, gamma, stock price, forming a loop and with a very high sensitivity because they are derivatives in its own loop. Now you see 1% swings in indices like you drink a can of soda casually. With large volumes in these options, from day to day, any headlines and any opinions from some folks and for no obvious reasons market can swing in any direction at any moment. Markets will remain like this indefinitely, until big boys quit this game. But when?
The yen market is likely to be calling the shots here, in the short term, as the Yen breaks 150 to the $. The ten year Japanese treasury needs to be at 0.25% and BOJ has unlimited capital to defend that level.
BOJ is likely to sell $s and buy yen. This has the likelihood of a US bond market sell off, pushing US yields even higher. The question is if such yield curve fireworks become unhinged, in short order, say in the next few days. By some metrics, it is the long end of the US yield curve that is at risk, because of low liquidity. Higher yields in the US is bearish for all kinds of assets (if we get such large BOJ interventions, USD is likely to weaken as BOJ sells $s??).
Anyone considering playing the GBP, gilts or the UK equities in coming days and weeks?