Preface: Explaining our market timing models
We maintain several market timing models, each with differing time horizons. The “Ultimate Market Timing Model” is a long-term market timing model based on the research outlined in our post, Building the ultimate market timing model. This model tends to generate only a handful of signals each decade.
The Trend Asset Allocation Model is an asset allocation model that applies trend-following principles based on the inputs of global stock and commodity prices. This model has a shorter time horizon and tends to turn over about 4-6 times a year. The performance and full details of a model portfolio based on the out-of-sample signals of the Trend Model can be found here.

My inner trader uses a trading model, which is a blend of price momentum (is the Trend Model becoming more bullish, or bearish?) and overbought/oversold extremes (don’t buy if the trend is overbought, and vice versa). Subscribers receive real-time alerts of model changes, and a hypothetical trading record of the email alerts is updated weekly here. The hypothetical trading record of the trading model of the real-time alerts that began in March 2016 is shown below.

The latest signals of each model are as follows:
- Ultimate market timing model: Sell equities
- Trend Model signal: Neutral
- Trading model: Bullish
Update schedule: I generally update model readings on my site on weekends and tweet mid-week observations at @humblestudent. Subscribers receive real-time alerts of trading model changes, and a hypothetical trading record of those email alerts is shown here.
Subscribers can access the latest signal in real-time here.
A failed reversal
Last week, I highlighted a possible bullish reversal candlestick on the weekly chart, but warned that the reversal needs to be confirmed by the next candle. This week, the S&P 500 weakened and failed to confirm the reversal candle, though the market is still exhibiting a positive 5-week RSI divergence and it is still testing support at the 200 week moving average.

Regardless, I am seeing helpful signs of leadership rotation. During bear markets, the old market leaders fade and new leadership emerges to lead the new bull cycle. The change in leadership is a constructive market internal that is indicative of a bottoming process.
Ready to rally
Sentiment readings indicate that the market is washed out and poised to rally. The Investors Intelligence bull-bear spread had fallen to levels last seen during the GFC.

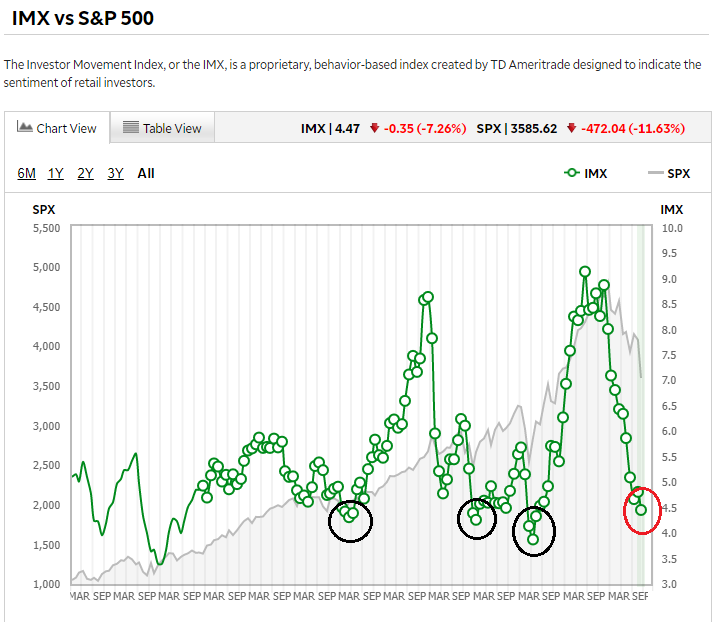
The TD-Ameritrade Investors Movement Index, which measures the positioning of that firm’s customers, fell to historically low levels, which is contrarian bullish.
The NDR Crowd Sentiment Poll has fallen to levels last seen at the 2008 low, which should put a floor on stock prices. The market just needs a catalyst to begin an advance.

A change in leadership
The US equity market has seen a definite shift in leadership. Changes in market leadership can be a sign that a bear market is turning into a fresh bull. As the old bull and old leaders falter, new blood and new leaders take up the baton. Large-cap growth FANG+ names, which had been the leaders since before the onset of the COVID pandemic, have seen their relative strength completely roll over.

A more detailed analysis of the relative performance of the three major growth sectors shows that they are all struggling.

Tactically, FANG+ prices may be experiencing headwinds because of SNB selling. Detailed disclosures of changes in the SNB balance sheet shows that most of the equity sales are concentrated in large-cap US growth stocks.

By contrast, the relative performance of cyclical value sectors are more positive.

A detailed relative performance analysis of selected cyclical industries shows:
- A relative breakout by infrastructure stocks;
- Broker-dealers have been in a relative uptrend since early July, though the group hasn’t achieved a relative breakout yet;
- Homebuilding stocks, which should be in the gutter with the tanking housing market, is in a relative uptrend;
- Retailers are forming a saucer-shaped relative bottom;
- The laggards are transportation and semiconductor stocks.

Valuation support
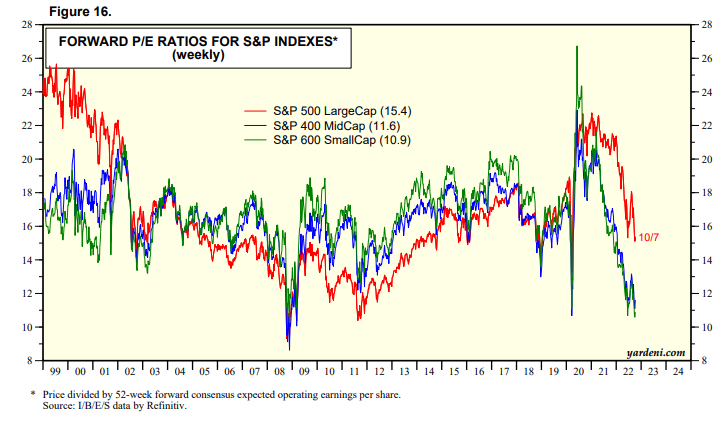
It’s possible that the market has seen the lows for the cycle. The S&P 500 is trading at a forward P/E of 15.4, but the forward P/E is about 12 on an ex-FAAMG basis, which is arguably cheap by historical standards.

An ex-FAAMG forward P/E of 12 is in the vicinity of mid- and small-cap P/E ratios.
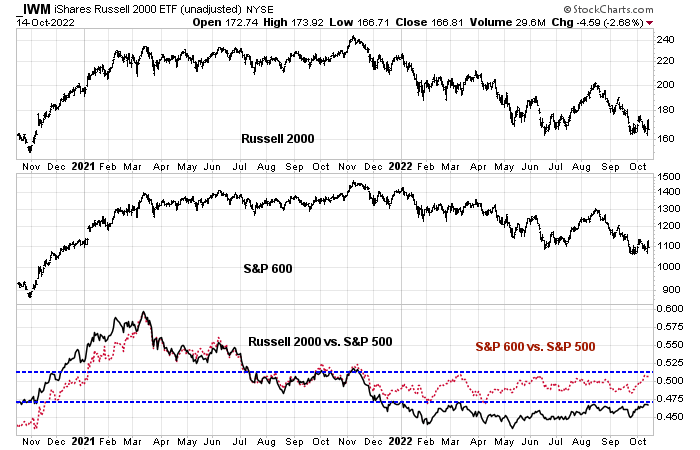
Indeed, the small-cap Russell 2000 and S&P 600 have been strengthening against the S&P 500 since May in an uneven manner and attempting a relative breakout.
Bear market rally ahead
My base case scenario calls for a bear market rally for several reasons. The market has been extremely oversold, as measured by the NYSE McClellan Summation Index. Past readings of under -1000 have seen stock prices rally, even in the bear markets of 2002 and 2008.

However, the rotation from growth to value isn’t entirely convincing. While large-cap value has turned up against large-cap growth, mid- and small-cap value and growth aren’t confirming the rebound.

In conclusion, the stock market is poised to undergo a bear market rally. Sentiment and technical conditions continue to be supportive of a short-term bottom. Beneath the hood, the market is undergoing a change in market leadership, which can be indicative of a long-term bottom process as the old leaders falter and the new leaders take up the baton.
Disclosure: Long SPXL
Cam
If the Fed pivots (your previous article), wouldn’t growth/FAAMG rally harder than the rest of the universe? This would also mean that SPY/Total market index would outperform an actively managed portfolio that is low on growth scrips.
https://www.yahoo.com/video/invest-during-stagflation-120000335.html
Growth takes a back step. This seems like a scenario that plays out with multi year inflation that takes time to cool off. This is the million $ question in my opinion, how long will it take for inflation to subside. Even if it takes 2-3 years from today for inflation to back off to 2% (all the way to 2025), growth may not come back as a style of investing, considering bond market yields may remain elevated for a few years to come, all the way to 2025 (and beyond?).
Thoughts?
“Valuation support…It’s possible that the market has seen the lows for the cycle.”
Cam, for clarification, do you believe this is a good long term entry point for value stocks?
Short answer is “yes”
Is there a false narrative? That being that the Fed raising rates will cause the market to drop. That things will break and everything will crash.
Remember in the 90s when we had the Dotcom bubble that was epic, rates for the 2 year were around 5.5%. Admittedly, there is more debt, and instead of rates being in a downtrend they are going up. But what if the narrative is wrong? Then all this pessimism and sentiment is in the wrong direction.
I’m not saying this is the case, just “what if”.
Zombie companies, the bondholders pick over the remains.
Just thought I’d toss this out there, and if we have the beginnings of a new bull then just about everyone is positioned wrong.
We are overdue for a rally, but my gut says we are in a big bad bear market, but if the rally just takes off I will think about some cheap out of the money calls
Crestmont’s Ed Easterling defines a secular bear as when the PEs are elevated and that we are in one since 2000, so this bull from 2009 to 2021 is a bear market rally. A bear market being a market where returns are subpar. This makes sense if you consider that buying at a high PE almost guarantees a poorer return than buying when the market is cheap. So it is a matter of looking at prices vs returns to define bull or bear. We focus on price.
Right now both views agree we are in a bear market.
One day PEs will be low, how we get there is unknown, but we will get there. What if we get a pivot and we get inflation so the nominal earnings go up as the $ devalues and price is stationary so to speak. After years of sideways movement PE is down and the possibility of a true bull with better than average returns arises. Look at the Nikkei, sideways for 30 years +, ouch.
Look at a 75 year chart of the S&P, the 1964 to 1982 timeframe. When silver came out of coinage and inflation was increasing, the Vietnam war, Nixon closing the gold window, and the market went sideways for over 15 years. The PE in 1965 was 18.75, by 1982 7.73, nominally the S&P went sideways, but in purchasing power, a dollar in 1965 bought a lot more than in 1982.
So we could get this huge trading range for 15 years or more, the good news is the S&P will not go to 50 if this holds, in fact we could be getting near a good rally like we saw in the 60s
Many people I know are on the lookout to catch the next wave, ride it as long as possible, and get off before it crashes. Many false starts but believe that a big one is just gathering energy. A bit of gambler’s faith and desire to get even. Let’s see if the Fed and the macro environment give them an opportunity and they can seize it.
I think inflation will be sticky, particularly the last 2-3% points before it gets close to 2% target. Powell has no motivation to quit the program he has put in place. He stumbled badly last year and he doesn’t want the blemish on his legacy.
It would be very helpful if Cam spent some ink on stagflation scenario and how to position the portfolios. Of course, not investment advice but guidance.
https://www.yahoo.com/video/invest-during-stagflation-120000335.html
This is precisely what I had in mind and here is a good answer how to invest with stagflation in mind.
Thanks D.V. Appreciate the info.
I would still like to hear Cam’s take on it too. If he is taking requests, that is.
I’ll write a longer analysis this weekend.
Thanks. Look forward to it.
Yellen has given a hint about gov buying long bonds. Last week she told media that the treasury market liquidity is poor and getting worse. The poor liquidity is part of the reasons yields have been trending up non-stop. How this reconciles with Fed’s inflation mandate is unclear. It is also not clear how all the algos will react. At the minimum if the market can stop going down precipitously it would help the sentiment.
UK’s problems are far from solved. So next week it might become a flash point again in the absence of top-tier econ reports. On top of this, the earning season is ramping up. Hard to position anything meaningful. In general, the backdrop is as poor as it gets. Good reports will prompt Fed to be more aggressive. And poor reports will raise market participants’ worry about a bad recession. Just can’t win.
Update on the intraday breadth momentum reversal strategy. This strategy has been described a few times before and it trades SPX futures ES based on reversals of market breadths during RTH (regular session). It has a remarkable run recently generating +9% in the last 3 trading sessions and still holding long after three major reversals – 1. short into CPI 2. reversal at 10:45 ET 3. reversal short at 15:45 ET later that afternoon and then buy reversal at close of Friday 10/14 and still holding the long.
The only observation here that it is noteworthy is that even with signs of selling, this quick to reverse breadth model has not reversed today, suggesting that breadth has not suffered large losses and that further price upside to the index that is often faded after gaining more than 2% is likely.
https://i.imgur.com/V6QfAqI.png
For inflation watchers;
https://www.kopernikglobal.com/sites/default/files/Jigs%20Up%20-%20FINAL%209292022.pdf
https://finance.yahoo.com/news/past-two-decades-low-inflation-173230207.html
Thank you
No end in sight to the decline in the long bond.
Does it end with a bang, or a whimper?