Preface: Explaining our market timing models
We maintain several market timing models, each with differing time horizons. The “Ultimate Market Timing Model” is a long-term market timing model based on the research outlined in our post, Building the ultimate market timing model. This model tends to generate only a handful of signals each decade.
The Trend Asset Allocation Model is an asset allocation model that applies trend-following principles based on the inputs of global stock and commodity prices. This model has a shorter time horizon and tends to turn over about 4-6 times a year. The performance and full details of a model portfolio based on the out-of-sample signals of the Trend Model can be found here.

My inner trader uses a trading model, which is a blend of price momentum (is the Trend Model becoming more bullish, or bearish?) and overbought/oversold extremes (don’t buy if the trend is overbought, and vice versa). Subscribers receive real-time alerts of model changes, and a hypothetical trading record of the email alerts is updated weekly here. The hypothetical trading record of the trading model of the real-time alerts that began in March 2016 is shown below.

The latest signals of each model are as follows:
- Ultimate market timing model: Sell equities
- Trend Model signal: Neutral
- Trading model: Bullish
Update schedule: I generally update model readings on my site on weekends and tweet mid-week observations at @humblestudent. Subscribers receive real-time alerts of trading model changes, and a hypothetical trading record of those email alerts is shown here.
Subscribers can access the latest signal in real-time here.
Still constructive
Last week, I outlined seven reasons why traders should grit their teeth and buy. I reiterate my short-term bullish and intermediate-term cautious view of the stock market. Traders should continue to buy now, but be prepared for pain later.
The S&P 500 rallied strongly early in the week but gave up most of its gains as time passed. Friday’s hot NFP report cratered stock prices and the index traced out a bearish island reversal, which is clearly visible on the hourly chart. The good news is the S&P 500 has nearly reached the measured downside target of its reversal pattern. In addition, the last hour was characterized by a morning star doji candle, which is a possible reversal pattern that needs to be confirmed by market strength Monday morning.

Reversal signals
Possible inverted hammer reversal candlestick patterns can also be seen in the NASDAQ Composite weekly chart and the S&P 500 weekly chart. The bullish backdrops are enhanced by the presence of positive RSI divergences. Both reversal setups will need to be confirmed by market strength next week.


The bullish rewards of a reversal could be considerable. Portfolio manager Steve Deppe found that the stock prices surged the following week when the S&P 500 closed over -4% off its weekly high each of the last four weeks (caution, n=3).

Reasons to buy
Notwithstanding the bullish results from silly small sample studies, technical conditions are supportive of the bull case. First, the relative performance of defensive sectors look dismal, except for Healthcare. Two out of four sectors are testing relative support and one, real estate, is breaking down relative to the S&P 500. It should also be noted that weak relative strength in defensive sectors began even before the stock market staged its rally.

Another positive signal comes from cross-asset analysis. Credit market risk appetite is perking up. Both the relative price performance of high-yield and leveraged loans compared to their duration-equivalent Treasuries is exhibiting positive divergences against the S&P 500.

Equity risk appetite indicators are bullish to neutral. The relative ratio of high beta to low volatility is showing a minor positive divergence, while the equal-weighted consumer discretionary to staples ratio is tracking the performance of the S&P 500.
Despite the surge in stock prices early in the week, the NYSE Summation Index (NYSI) oversold and very near an extreme condition. The market simply doesn’t crash with NYSI readings at these levels. At a minimum, this should put a floor on stock prices should the market weaken.

Bearish positioning
Positioning is at an extreme and supportive of high prices. Bloomberg reported that fund flows into the short ETF is a record, indicating that retail investors have piled in. A separate Bloomberg article revealed that fund flow reports show investors poured the most money into cash in the past week since April 2020.

Tactically, hedge funds are short and poised to cover. Charlie McElligott at Nomura observed that CTAs have begun to cover their equity shorts from a crowded short condition. Any catalyst that sparks gains in the market could start a melt-up stampede.

In addition, the 10 dma of the equity put/call ratio is at or near levels where the market has bottomed out in the last 10 years. Fear levels are nearing a crescendo.

Upbeat earnings season
As we approach Q3 earnings season, FactSet reported that the pace of positive guidance has improved sequentially from last quarter and negative guidance declined. Moreover, the number of companies giving positive guidance is above its 5-year average. The game of guiding lower to beat results for Q3 is done. We should see a decent series of positive earnings surprises in the coming weeks.

The theme of an upbeat Q3 is confirmed on a top-down basis by the Atlanta Fed’s GDPNow nowcast, which soared to 2.9% and shows no immediate signs of a recession.

Pain later
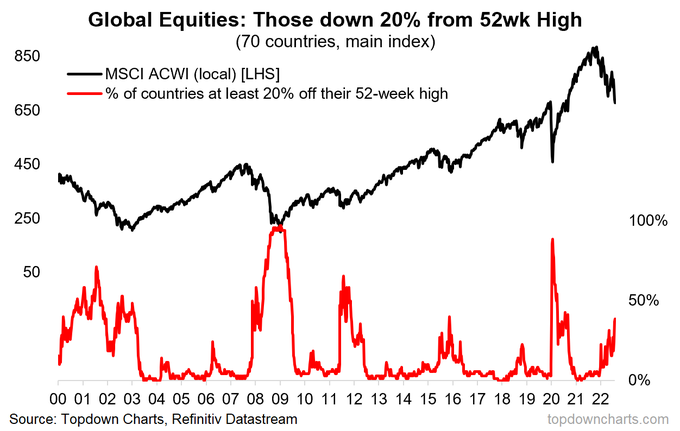
Despite the sunny near-term outlook, investors can expect some storm clouds on the horizon. Using the official definition of -20% from their highs as the definition of a bear market, about 40% of global markets are in bear markets. As Europe is almost certainly in recession, China is teetering on one, and the US is almost certainly going to see one in 2023, these readings are inconsistent with a durable bottom. Stocks have more work to do on the downside.
The recent risk appetite environment has mainly been driven by the bond market, as the stock market has really gone along for the ride. The MOVE Index, which measures the volatility of bonds, is exhibiting a significant divergence from the VIX Index. This bear market is unlikely to end until the two converge. Watch for the VIX to rise in the coming months.

In conclusion, I am constructive on the stock market for the next few weeks, perhaps as far as to year-end. These conditions are consistent with the pattern of positive seasonality that begins about now. However, investors need to be prepared for turbulence once any short-term rally peters out. This is a bear market, and don’t mistake a bear market rally for the start of a fresh bull.
Disclosure: Long SPXL
Cam: do you see now as an opportunity to enter into TLT?
Ask yourself this question, “Have you ever seen a bear market where treasury bonds are leading the market down?”
Answer no. Because they were always uncorrelated.
The Equal-Weight S&P 500 is down 18% and the TLT is down 30%
That is the key to this market. Long term stock valuation is anchored by long term interest rates, We are going from absurdly low manipulated rates to some level of normalcy with some real return. That is taking the oxygen out of the gymnasium as the players run about and wonder why they feel so tired as the game goes on.
This explains why Defensives of Utilities, Staples and Real Estate have fallen 15% in a couple of weeks. The Utility index is only down 4% this year and Staples 8% even after the big recent decline. They were ignoring the huge drop in bond prices because investors were shifting into defensive stocks on a portfolio allocation basis. I’m guilty of that.
But buying these defensive sectors whose prices have not reflected the new long term risk-free interest rate is wrong and dangerous especially since Jackson Hole when the FED has driven home how committed they are to higher for longer.
I have been saying over and over, “We are in unprecedented times as in never happened before.”
Long-term Treasury bonds leading us down to a bear market low never happened before. Portfolio managers who live by their successful experience in cycles that were predictable and returned to previous means, are most liable to get this wrong. Quants compute investment policy on long-term irrelevant data will be doubly wrong in ‘unprecedented’ times.
Investors are waking up to the risk-free competitive valuation conundrum. Oxygen is getting sucked out of the room.
Here is a thought experiment:
The 2025 December Fed Futures is now at 4%. If we expect the yield curve to be positive at that time after the FED stops its current tightening when inflation is back to 2%, How high will the long bond be to have a positive curve? 5% – 6%-7% ???
Where will the PE on stocks be in that world (especially growth stocks)?
I don’t think it will. Unless they do some tricks with the Federal debt. They can let the zombies fall, bondholders or someone will pick at the remains.
Since the history of fiat currencies is that they always eventually fail, why should this time be different?
There will be a Fed pivot or a federal massive stimulus, take your pick.
Supposedly we are also at a good time based on mid terms, so a bounce is definitely in the cards, but we are in a bear market and it ain’t over.
What’ll be the catalyst for the markets to bounce here before the mid-term? Just the collective expectation of the market participants for a bounce before the mid-term? Can the administration do anything? The Fed is doing a good job of jawboning the market into submission.
Sometimes a look at the simple coppock curve which is a type of smoothed momentum oscillator will keep an investor out of a bad trade. The last time long bonds took a dump at the start and after a recession with relatively high inflation was in 2008 and long bonds didn’t really recover until a year after the recession and after the inflation rate had bottomed (CPI below zero and turned up after August 2009). This time the inflation rate is much higher than the ~5% of July 2008 and why there is a rush by some macro bros into long bonds is a mysterious narrative, perhaps it is that they thought there is no alternative or they don’t really know how to trade bonds – an entry in mid to late July 2022 when they recommended would have resulted in a loss of -16%.
Coppock monthly (bottom panel) on a chart of TLT, coppock red ever since Oct 2020 and no chance of turning around. All these data can be had for free to plot with a free tier account at tradingview.
https://i.imgur.com/CI4mCY0.png
I look at the monthly coppock and the zero line, and we are currently negative, it will take a while to cross back to positive
For you folks that don’t mind a long post.
A new critical reality is always seen first with new eyes.
Here is an observation that hits the mark.
It’s in front of us but we don’t see the new reality, By us I mean investment experts with successful, long experience.
So, new eyes are seeing what new reality? Long-term Treasury bonds falling tremendously more than stocks indicates the well acknowledged bubble in free money has ended. Interest rates in future will be rational and offer real returns. And VERY IMPORTANTLY equity valuations across the board must be much lower in that new reality. The recent crash in Staples and Utilities are prime examples that can only be understood as investors starting to see this new reality. The next two pages dive into this.
A smart investor once wrote that he would find a new stockbroker to the business that was excited about a new sector that was going up strongly. He would give them money and let them unleash their confidence and make him big gains by taking risks he was too knowledgeable and careful to take. Once the smart investor saw the bull market was going to end, he would sell out his now, much larger account, to the shock of the proud rookie broker. He knew the rookie broker wouldn’t see their bubble was over and be humbled. I was that new, and later humbled broker in the energy boom of the 1970’s, riding it up and down. I took a client’s account from $50,000 to $1,4 million. He should have taken the money away then. Enough said.
What do new eyes see? They see a new way stocks are busting not booming.
A young CFA student with an economics degree who does work for me asked a question, “Have you ever seen a bear market in stocks that was led down by a bigger decline in Treasury bonds? Easy answer; no. They were always uncorrelated. He had never experienced a real bear market. The Covid Crash didn’t count. My brain over the next few days, kept coming back to that question and that answer. BTW, his young eyes are shorting ARK things and buying puts. Last year, he was long meme stocks.
Experts I trust and follow, say we are in unprecedented times, as in ‘never happened before.’ I have said over and over that in unprecedented times, a success person with now useless deep experience is the most dangerous investor. Correlation of long-term Treasuries to stocks is the new reality that changes everything. Stock valuations are much too high given the Treasury rates.
Thanks!
Another way of looking at it is “What’s going to break?’
Here is my take on this. Basically it’s the Fed and gov’t debt that will break.
The Fed has mission impossible, but not the TV version.
It is impossible to raise rates with such high debt, when we have been living off debt for 40 years give or take.
So we may get higher rates, but these will be accompanied by accelerating deficits, a vicious spiral. Soc Sec with Cola, gov’t pensions with Cola, this all means acceleration of money going to Main Street. There is little difference between an extra 500 billion going out in Cola to stimulus checks. So there will be inflation. At some point that inflation works it’s way into assets. Which is why in Zimbabwe and Weimar Germany stocks did well as the mark tanked.
That TLT is going down when there should be a rush to safety may be due to the belief that this always happens being incorrect, or it’s too early, waiting for the pivot.
So if there is no pivot, the debt crushes us and we have deflation or fiscal spending inflation.
If there is a pivot and we have inflation anyways then we have an inflationary depression. This is less painful than deflation and depression. They can play games with the inflation numbers to reduce the bite of Cola, I don’t think they can play with deflation numbers. This is the less painful shorter term option. They will pick this one if they have a choice.
Ken makes a good point. We may be witnessing the initial stage(s) of a new normal. Nothing wrong with that – some things in life just aren’t sustainable. Sky-high home prices and rents that force families to move or live in their cars. Stock valuations that require increasingly wilder rationalizations to justify. Negative interest rates. The past decade isn’t ‘normal.’ What’s normal are home prices that allow young families to buy homes, stock prices that make sense, and interest rates that allow retirees to generate a stable income on their hard-earned savings with little to no risk.
In other words, a reversion to the mean – where the mean is defined as a sane world 🙂
The problem right now may be that everyone is waiting for the countertrend rally that allows them to cash out ahead of the next leg down. The market being what it is – the king of maximum frustration – the countertrend rally may not materialize and what lies ahead is simply the next leg down.
I was alive during the 70s but just a kid. For those more experienced folks on this site, what dynamics in the market are relevant today?
I’ve heard elsewhere that by the end of the 70s no one was interested in stocks, why would you be with CDs and Treasuries paying such handsome rates? I feel like we are adjusting back to something akin to those times.