Mid-week market update: The stock market has been exhibiting a series of positive breadth and momentum divergences as the S&P 500 weakened, but the recent main driver of risk appetite has been the fixed income and currency markets.

Do divergences matter anymore?
External drivers
The divergences matter less inasmuch as the stocks in the S&P 500 are all moving together, indicating that equities are being driven by either extreme emotion and external macro forces. In this case, the external drivers are mainly the bond and currency markets.

You’ve got three days
The market was thrown into turmoil yesterday when BoE Governor Andrew Bailey told pension fund managers to finish rebalancing their positions by Friday when the Banks ends its emergency support program for the country’s fragile bond market, “And my message to the funds involved and all the firms involved managing those funds: You’ve got three days left now. You’ve got to get this done.” The market was instantly thrown into turmoil, though the FT reported that the Bank walked back the sudden stop in BoE support, but left participants confused. The yield on the 10-year gilt surged to levels last seen during the GFC.

The MOVE Index, which measures the volatility of the Treasury market, has also surged to GFC levels, though the anxiety can largely be attributable to the Fed’s tightening trajectory.

Cross-asset signals
Even then, I am seeing a number of cross-asset signals that may be conducive to a better risk appetite.
I have heard from some readers expressing concern about the breach of support by TLT, the long bond Treasury ETF, other ETFs representing the shorter end of the Treasury yield curve held support during the latest bond market downdraft, which may be a constructive sign for risk appetite.

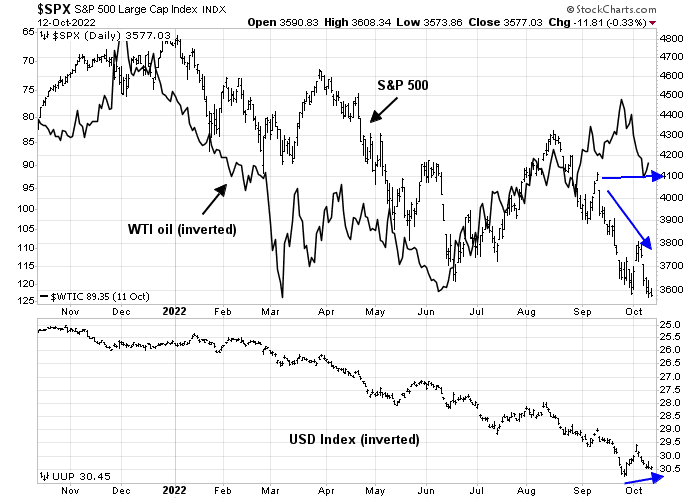
The S&P 500 has been inversely correlated to oil prices and the USD. Oil prices have been flat even as stock prices fell, and the USD Index is exhibiting a slight positive divergence against the S&P 500, which is another positive sign for risk appetite.
Poised for a bear market rally
I interpret these conditions as the stock market is washed out and poised for a rally. The NYSE McClellan Summation Index (NYSI) has fallen below -1000. Stock prices have historically rebounded when NYSI reached these levels. Even during the bear markets of 2002 and 2008, the market rebounded before weakening again.

The VIX Index is nearing or reaching the minimum level of 34, which has signaled near-term bottoms in the past year.

As well, the term structure of the VIX is inverted, indicating widespread fear.

Analysis from SentimenTrader shows that the Fear & Greed Index exhibited a positive divergence. The last time this happened was the Christmas Eve Panic of 2018, and the market rallied hard afterwards.

You can tell a lot about market psychology by the way it responds to news. PPI came in hot this morning, and stock prices have been roughly flat on the day instead of tanking as they did after the NFP report, indicating that risk appetite is becoming numb to bad news. Much will depend on the CPI report tomorrow morning.
The Cleveland Fed’s inflation nowcast is calling for a monthly headline CPI of 0.3% and core CPI of 0.5%, compared to consensus expectations of a headline of 0.2% and a core of 0.5%.

Ahead of the CPI report, SPY option open interest is skewed very bearish, which may mean that we need a very hot CPI print for stock prices to tank. If the report comes in at or below expectations, it could spark a strong risk-on bounce tomorrow.

Disclosure: Long SPXL
CNBC market commentator Mike Santoli mentioned last Friday that the pattern of weakness on Thursday and Friday has been playing out again – when people talk about a pattern, it is unlikely to work again. I just can’t get too excited about the upcoming earnings season.
One could look at the growing stress of the US dollar on the world’s financial markets in two ways. The bullish way it that like a rubber band it will snap back and the stress will come off. The negative way is that the rubber band breaks and economic chaos reigns.
The dollar strength is a wrecking ball on non-US countries along with higher interest rates by the Fed as they only look inward at their strongest economy while others are harder hit by energy and food inflation.
I expect a Fed pivot before year end. But as Mohammed El-Erian said, be careful what you wish for since the pivot will happen when something major breaks.
If a pivot happens before inflation is killed, we will be in a golden period for inflation loving industries. Truly a once in a lifetime opportunity to buy commodity oriented companies.
Have cash to take full advantage.
Gold and Gold stocks are showing relative strength compared to the S&P500. Also, XME the metals mining index. When the dollar peaks and it will those sectors should shine. Pun intended.
Since Jackson Hole speech on August 26, both bonds and equities have gone down in a waterfall, with a brief 2 day 4% rally. Nothing has mattered much. Fed continues to reinforce its hawkish message in-spite of any financial cracks elsewhere. They must be in close touch with other major central banks, imo, and do not take them seriously, yet.
Earnings are going to punish those missing expectations severely while rewards for meeting or beating may be fleeting.
The momentum is down and one may be lucky to catch a fleeting bounce if technicals matter much.
I think intermediate investment grade corporate bonds offering 5.5-5.8 yields are a great opportunity. So are preferred stock of financial institutions offering 6.5% with 25% discount to face value(call price).
Compared to average 6.8% annualized return on S&P over the long run.
Interesting. With the bad CPI number the dollar has not made a new high or the long bond a new low. Something to watch if you are expecting a turn.
Give it some time 🙂
Spoke to soon. The long Bond just did.
After the shorts cover their bets, we’ll find out how much conviction the bulls have.
SPY looking good.
TLT/IEF not so much.
According to some, this SPX rally is not driven by short covering but by sharp drop in intraday volatility (IV) for options expiration which then suggests this rally may not last very long. $CPCE is still above its MA but dropping.
https://twitter.com/MichaelMOTTCM/status/1580595283951353857/photo/1
Nobody has a crystal ball to the market and nobody knew one of the largest buy program was going to kick in today at around 9:45 ET, however when a large move occurs, it leaves footprints and changes the market internals such as the breadth and up volume. If you study such internals and make a model of the price action reacting to market internals, that will give you a clue where the market could be headed. One does not need to be correct 100%, just more than 50%, hopefully 60 +% correct. Here is such a model, showing market strength and no shorting so far after 10:30 ET and buy at 10:45 ET at ES 3552. This market forces a swing trader to become an intraday day trader, but the return could be +4.5% for example in the last 24 hours as shown. The strategy was positioned as short going into CPI release, although not optimally as a discretionary trader might do.
https://i.imgur.com/8ksbb44.png
The closest analog to what happened today in the last 20 years in the SPX is 10/28/2008 – which is this bullish engulfing over the last 3 bars plus a 2% gain over previous close.
What happened in 2008? The market rallied 5 trading days to Nov 4, 2008 which was most likely election day then reversed sharply, dropping to the low for 2008 by that Thanksgiving. If that is the pattern here then we have some time now because it is 18 trading days and 26 calendar days to Nov 8, 2022, the US election day.
Cam, can you please mention how far this rally can go. Can it last till begining next week? Thank you.
Hard to tell. This feels like a short covering rally today. Have to see how the market reacts over the new few days to see if the rally has legs.
Thank you Cam. Looking forward to your Sat/Sun posts. 🙂
Horrible day today. I do not understand how is it possible that VIX is not UP widely. Price action of SPY is real disapointment. Cam, should you explain us these movements Ill be very happy. Thx very much.
It’s extremely difficult for anyone to navigate this market – as Ken points out, we’re in uncharted territory.
Use a compass and remain vigilant – there will be traps every step of the way. I can’t fault anyone for getting it wrong in this environment – the worst year for 60/40 funds in a long time. The only other option is to stand aside.
One possible way to look at this it is just a slow and steady valuation reset, people are not panicking – another indicator is that European stocks did not make new lows this week. Last week’s Nasdaq candle looked more like a gravestone doji to me and I think we got confirmation this week, also with a third close below the 200-week (COMPQ shows more clearly that it tried to recapture the 200-week but finally let go of it this week) Growth vs Value is in a relative downtrend and nearing the May/June lows again, but what is interesting is that cheaper European stocks are starting to become more numb to bad news. The outlook is less clear on US cyclicals and value stocks, but the one place it seems you don’t want to be is US tech. On SPX we tried to recapture 3800 and failed, this week it was 3700 and failed. Walter Deemer said Thursday reminded him of late May 1962, which was followed by a pretty much down June and a bottom in late June.