Mid-week market update: I received a number of questions from readers who were positioned for the monster rally that began on Monday, “What’s your upside target?”
The answer is, “It depends.” Make no mistake, the market was washed out and oversold when the rally began, but it was sparked by a rebound in bond prices. Much will depend on the interest rate outlook going forward.

Initial targets, by the numbers
Nevertheless, we can see an initial resistance zone on the S&P 500 hourly chart in the 3870-3900 area. After two sizable surges, it’s no surprise that the market took a breather today.

A point and figure analysis, using 30 minute S&P 500 data, 0.5% box size, and differing box reversals yields an upside target range of 3982 (2 box reversal) to 4166 (3 box reversal).

From a short-term technical perspective, I can conclude that the S&P 500 will encounter initial resistance at 3900, with further resistance at 4000-4100.
From a trading perspective, here are a couple of “take profit” tripwires to watch. Bounces off bottoms often fizzle out when the VIX Index recycles from above its Bollinger Band to the middle of the band, which hasn’t happened yet. As well, bear market rallies this year have all reached a minimum of a neutral reading on the % of S&P 500 stocks above their 20 dma, which was nearly achieved yesterday, but not yet.

Does this rally have legs?
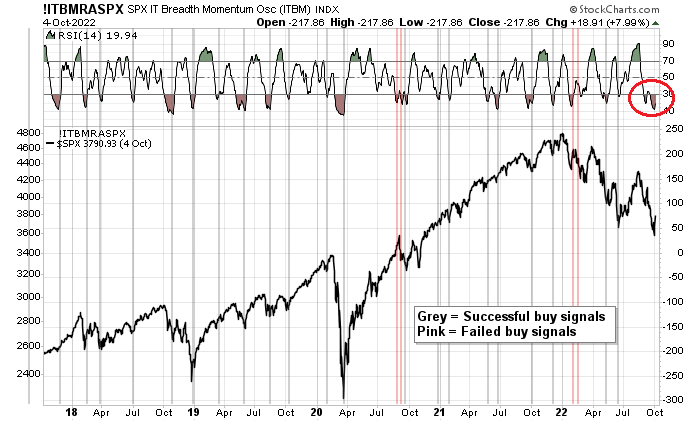
Arguably, this relief rally has more legs beyond any initial resistance target. The usually reliable ITBM model is on the verge of flashing a buy signal.
An analysis of hourly returns shows that they reached +/- 2.5% levels in the latest downdraft. This is a condition that has signaled significant bounces in the past.

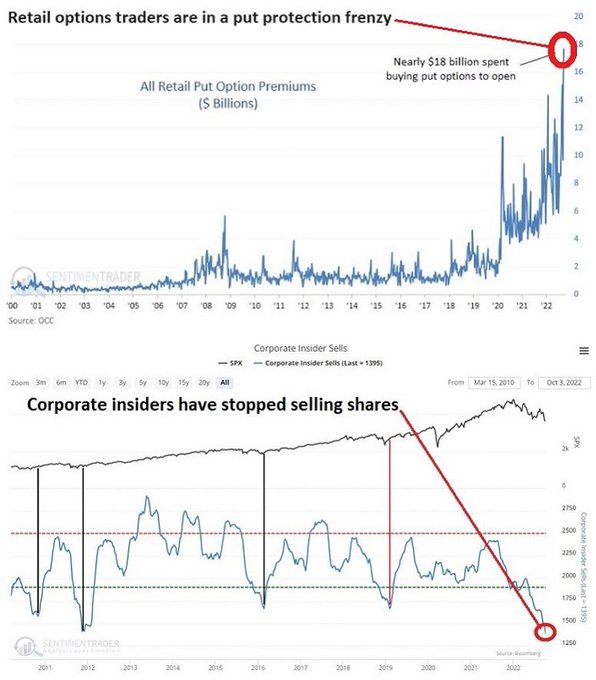
Jay Kaeppel at SentimenTrader pointed out a smart and dumb money frenzy. Retail option traders are piling into put options for downside protection, while insider selling has virtually evaporated. Who would you bet on?
Nautilus Research identified a 50-day cycle in the VIX Index, and it’s projecting a bottom in the VIX in late October. Since the VIX is inversely correlated with stock prices, that implies a late October tactical top.

Other signals from the option market also argue for further upside potential. The 10 dma of the CBOE put/call ratio is elevated. While the market rally may temporarily stall, it’s hard to see how it could crash with the put/call ratio at these levels.

And make no mistake, this is a bear market rally and not the start of a fresh bull. Mark Hulbert found that large market spikes such as the ones we experienced on Monday and Tuesday tend to occur during bear markets.

Volatility ahead
To be sure, investors have to brace for volatility. Half of all equity options now expire in less than a week, the cheapest and most-levered bets. This is likely to enhance volatility in the near term.

As I pointed out at the start of this post, the stock market rally was sparked by a bond market rally. Bond prices are highly dependent on economic data – and there are two big announcements on the horizon. First up is the September Employment Report on Friday. In all likelihood, the headline number will beat expectations. The high-frequency initial jobless claims reports have been trending down, which is a sign of a strong labor market. The more important questions are whether average hourly earnings are showing signs of acceleration or deceleration and whether the labor force participation rate is rising, which would be a sign of people returning to the post-COVID jobs market, which would alleviate the Fed’s concerns of labor market tightness.

Longer term, leading indicators from the August JOLTS report show signs of labor market weakness. Not only did job openings plummet, the quits/layoffs rate, which has led NFP, is nose-diving. As this ratio is a leading indicator of the jobs market, labor market weakness is unlikely to show up for several more months.

Investors will see the all-important CPI next Thursday. Market expectations call for a core CPI of 0.5% on a monthly basis, and 6.5% on an annual basis. These figures are roughly in line with the Cleveland Fed’s inflation nowcast, indicating little or no surprise. However, such a report would be a signal for the Fed to stay on its hawkish path and the odds of a dovish pivot would diminish.

As well, Q3 earnings season begins in earnest on October 14 when the banks begin their reports. While top-down macro expectations are calling for an earnings deceleration, the bottom-up picture tells a different story. FactSet pointed out that Q3 positive guidance has risen and negative guidance has fallen compared to Q2, which is a potential positive surprise.

Stay tuned. I have outlined the risk and potential rewards. If you are bullishly positioned, the degree of greed and risk you take is up to you. In all cases, prepare for volatility.
Disclosure: Long SPXL
Cam, the FT carried an article on rising financial stress driven by a strong USD and rapidly rising interest rates.
Would love to hear your thoughts on this.
Thanks!
‘Someone will get hurt’: Investors and analysts warn on rising market stress
https://www.ft.com/content/3627d8b4-93cc-4dec-9fae-0e654fb941af
The OFR’s (the Treasury’s Office of Financial Research) Financial Stress index is near a two-year high at 3.1, where zero denotes normal market functioning. This suggests trading conditions in US government debt, corporate bonds and money markets are increasingly stretched.
We are close to the 60th anniversary of the Cuban Missile Crisis. Of course, it is also time for another mid-term during the presidency of a Democrat. And the nuke-carrying Russian sub is spotted in the arctic.
Putin stationed 150k troops on the border with Ukraine for 2 months. No one believed him. I didn’t either.
Now I’m definitely afraid that the worst might happen. At least, a nuclear test…
Any thoughts?
https://www.dailymail.co.uk/news/article-11284097/New-satellite-images-Russias-nuke-carrying-submarine-Belgorod-lurking-Arctic.html
Reserve balances with Federal Reserve Banks
October 6, 2022
2,972,874
+ 12,276
Start of a QT pause? Too early to tell, but that is what drove July 1, 2022 to August 12, 2022 rally. QT spike of -12.3% also drove the sell off from April 22, 2022.
Now we can only hope! I am desperate.
The summary for the week is that what started out as extraordinary +90 and +95 SPX upvol the first two days turned to -63 dnvol by Wednesday through -90 by Friday. Such a turn around really deserved no support from those holding longs in the SPX index and a backtested profitable strategy for this set up exited the long trade by Wednesday 10/5/22 at close. There is no shame in taking a smaller profit rather than no profit or a loss if there is a good tested reason for exiting a trade. Such a set up was described in the user comment section of the Oct 1 post on this site. The exit criteria was based on the market breadth NYSE 52 wk High Low difference rate of change > 75% in 1 bar representing a sharp drop in breadth which happened on Wednesday close. These were the results of the last 3 trades of the strategy:
16 Buy 05/12/22 L1 $3,930.08 4.04%
Sell 05/17/22 S1 $4,088.85
17 Buy 09/06/22 L1 $3,908.19 4.07%
Sell 09/09/22 S1 $4,067.36
18 Buy 10/03/22 L1 $3,678.43 2.85%
Sell 10/05/22 S1 $3,783.28
10.22%
These results are preferable to holding longs and taking losses in a bear market of unknown duration.
https://i.imgur.com/243PiN5.png
10.22% is the sum of gains in the last three trades. There were two other trades prior to 05/2022 that exited with nominal losses, -0.54% and -0.20%.