Preface: Explaining our market timing models
We maintain several market timing models, each with differing time horizons. The “Ultimate Market Timing Model” is a long-term market timing model based on the research outlined in our post, Building the ultimate market timing model. This model tends to generate only a handful of signals each decade.
The Trend Asset Allocation Model is an asset allocation model that applies trend following principles based on the inputs of global stock and commodity price. This model has a shorter time horizon and tends to turn over about 4-6 times a year. The performance and full details of a model portfolio based on the out-of-sample signals of the Trend Model can be found here.

My inner trader uses a trading model, which is a blend of price momentum (is the Trend Model becoming more bullish, or bearish?) and overbought/oversold extremes (don’t buy if the trend is overbought, and vice versa). Subscribers receive real-time alerts of model changes, and a hypothetical trading record of the email alerts is updated weekly here. The hypothetical trading record of the trading model of the real-time alerts that began in March 2016 is shown below.

The latest signals of each model are as follows:
- Ultimate market timing model: Buy equities
- Trend Model signal: Bullish
- Trading model: Bullish
Update schedule: I generally update model readings on my site on weekends and tweet mid-week observations at @humblestudent. Subscribers receive real-time alerts of trading model changes, and a hypothetical trading record of those email alerts is shown here.
Subscribers can access the latest signal in real-time here.
Has Santa come to town?
Will the real Santa Claus rally, which begins on Monday and lasts until the second trading day of January, now begin in earnest?
I pointed out last week (see A breakout to S&P 4920?) that the S&P 500 was potentially forming an inverse head and shoulders pattern, but head and shoulders patterns are incomplete until the neckline breaks. The market staged a marginal upside breakout through resistance on Thursday. The measured objective of the inverse H&S breakout is about 4920, but that level may be overly ambitious. If the Santa rally has truly begun, one of the tactical indicators that he has returned to the North Pole is whether the VIX Index falls below its lower Bollinger Band, which is an overbought signal to take trading profits.

Here is what else I am watching.
Santa rally internals
In my last post (see Was the Grinch in the house?), I outlined some possible characteristics of a year-end market advance. One is the snapback of beaten-up stocks as tax-loss selling season ends. One possible group for a relief rally is speculative growth stocks, which have begun to bottom out relative to both the S&P 500 and NASDAQ 100 in December but tailed off in the last week. Will they pop in the coming week and early January?

Another hated group is small-cap stocks. While most investors use the Russell 2000 as a small-cap benchmark, which is still stuck in the middle of its trading range, the higher quality S&P 600 is nearing resistance. An upside breakout by the S&P 600 would be a positive sign for the bulls.
However, the market tends to be led by low-quality stocks this time of year. If the seasonal rally is indeed underway, watch for the Russell 2000 to outperform the S&P 600.

Indeed, an analysis of the quality factor shows that low quality is dominant in both large and small-caps.

How durable is the advance?
If Santa does come to town, how durable is the advance?
The relative performance of the top five sectors is revealing. These sectors account for over three-quarters of S&P 500 weight and it would be impossible for the index to significantly rise or fall without the participation of a majority. An analysis of the top five sectors shows that three, technology, consumer discretionary, and communication services, exhibited temporary relative strength that appear to be more of a counter-trend nature. I interpret this to be an early warning for traders not to overstay the party.

Risk appetite internals are equally troubling. Equity risk appetite indicators are flashing negative breadth divergences.

Credit market risk appetite shows a mixed picture. While the relative price performance of junk (high yield) bonds compared to their duration-equivalent Treasuries have confirmed the S&P 500 advance, emerging market bonds have not. As the Fed begins its rate hike cycle, fragile EM economies will be the canaries in the global financial system coal mine and the relative performance of EM bonds is not encouraging.

Don`t be prematurely bearish
Before traders turn prematurely bearish, keep in mind that the market staged a rally from an oversold condition and sentiment washout. The NYSE McClellan Summation Index (NYSI) remains oversold on the weekly chart.

The NAAIM Exposure Index, which measures the sentiment of RIAs, fell below its 26-week lower Bollinger Band two weeks ago. This model has had a remarkable record of spotting short-term bottoms. Tactically, I am inclined to wait for NAAIM to return to the 26-week moving average. This has historically taken between 2-5 weeks from the time of the buy signal, which puts the time horizon for exiting a tactical long position about the middle of January.

Analysis by Martin Pring [gated at StockCharts] is also supportive of a 2-4 week rally. Pring pointed out that the KST for the put/call ratio had rolled over. (KST is a momentum oscillator that’s “a weighted average of four different rate-of-change values that have been smoothed”.)
Last week, [KST] had started to go flat. Now, it has experienced a decisive peak, which indicates that traders have started to become more optimistic. The arrows show that such action has consistently been followed by a 2-to-4-week rally or more.
This indicator flashed 10 buy signals in the last five years. Of the 10, the S&P 500 rose in seven instances (blue lines), fell in two (red lines), and fell immediately before rising again in one (black line).

A simple analysis of option sentiment also shows that bearishness has come off the boil but readings are still high. The equity-only put/call ratio has fallen, indicating a retreat in bearishness, but the 10 dma remains elevated. In short, intermediate-term sentiment models are beginning to recycle back to neutral, but conditions are nowhere near crowded long conditions that warrant caution.

As well, seasonal patterns are supportive of a bullish outcome. The S&P 500 has been tracking its seasonal pattern remarkably well in 2021. If it were to continue, watch for a short-term top about the second week of January.

What if Santa doesn`t call?
Mark Hulbert recently demonstrated that the odds have historically favored a market advance after Christmas and for the first two days of the new year. However, there is still the possibility that the Santa Claus rally doesn’t materialize.

Short-term breadth is very extended and a pause and pullback would be no surprise in the early part of next week.

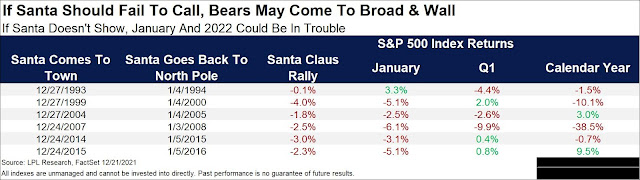
Ryan Detrick of LPL Financial showed the history of returns if the Santa rally fails. While the sample size is small (n=5), the implications for January and the rest of the year are not encouraging.
In conclusion, the market is poised for a year-end rally with an S&P 500 measured objective of 4920. The key risks are faltering market internals and overbought short-term breadth. If the market were to stage a seasonal advance, historical odds point to a trading top in mid-January.
Disclosure: Long SPXL
Thanks Cam for cutting into your holiday time to do this important analysis.
All the best to all you Humble Students in the holiday season. Stay triply safe.
We are in this together.
Yes, thank you Cam and best wishes to all.
I think that the rally will be impacted by Omicron…cases are exploding higher, but what will be the severe illness count be among the vaccinated? At the current rate of infection we can expect it to burn itself out soon because there will be no one left to infect. So maybe we get an immediate rally, or a delayed one, but one thing is pretty certain, Omicron will burn itself out. It’s in the math. So does the market look beyond that?
I checked in with my cousin and her husband, both doctors, in London over the weekend. The bad news based on what they are seeing in their practice( called surgeries) is that the number of new cases has not peaked. Good news – very few people are getting seriously ill. Most common symptoms mimic those of a common cold.
As the market looks ahead, I think it’s more likely that we should see a rally. Great analysis by Cam to tell us when to get out.
Hopefully Cam will soon write about what to expect post the rally. I do remember his post about choppiness in the first half of 2022. Become defensive? How defensive? Etc..
Best to Cam and all of you. What is beautiful, joyful and meaningful be yours over the coming days, months and years.
The US lags the UK in number of cases by a few weeks and we here in the US are still some time from the peak fury of Omicron. It is the unvaccinated that are taking the brunt with severe sickness, ICU admissions etc. With only about 62% Americans vaccinated, give or take, this has some more time to “burn out”. Before the “burn out” one expects more variants to be born, unless we have a massive, global vaccine campaign.
“Every day it goes up and up. The last weekly average was about 150,000 and it likely will go much higher,” Fauci said on ABC’s “This Week.”
While I also remain sceptical about the “mildness” of Omicron, as an investor those early study results shouldn’t be ignored. Some of the recent worries, like China real estate and a potentially disastrous Omicron wave *could* be playing out a little more benign compared to what one had to fear just a few weeks ago – and this keeps the narrative for a santa rally in play.
Mid Jan 2022 starts 4Q2021 earnings season confession. Let’s see if there is any front running.
One of the three BIG PICTURE elements I have used to avoid every crash over the last forty years is INVESTOR SENTIMENT (other two Value and Leading Economic Indicators).
European stocks are struggling as they experience the Omicron surge whereas very inward-looking American investors are ignoring it and leap instantly into a ‘buy-the-dip’ and ‘positive seasonal’ strategies. America is terribly less vaccinated than Europe.
We are now ending the third consecutive year of great gains. This makes the general public feel bulletproof.
As Cam writes, this is likely successful for the next few weeks. A great investor once remarked about the folly of “picking up pennies in front of a steam roller.”
The market is safe when BIG PICTURE Sentiment is Panicky/Pessimistic and unsafe when it’s Optimistic/Bubbly. I ask you, where are we now?
But so many of us are fearful! But we really are in uncharted waters. I still expect a melt up before a really really bad crash, but I have been expecting a crash since forever. I think there is still a lot of stimulation money rolling around and this can fuel the rally, so I have small positions and I am mostly in cash….if it loses 6% in a year, so be it. If Omicron is not horrible, then when earnings come out we could get a boost up, but I don’t expect the next earnings season to be pretty. So I think we have a couple of months left.
But, won’t the investors react to the earnings guidance for the following quarter (1Q 2022)? That won’t make the earnings season to be pretty.
I agree with you. Many investors are fearful. This market is climbing a wall of worry.