Mid-week market update: I am publishing this note one day early ahead of my holiday hiatus. Regular service will return Sunday with a trading note.
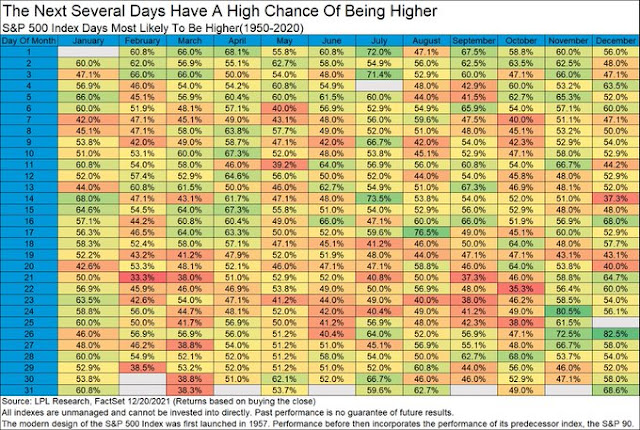
Positive seasonality
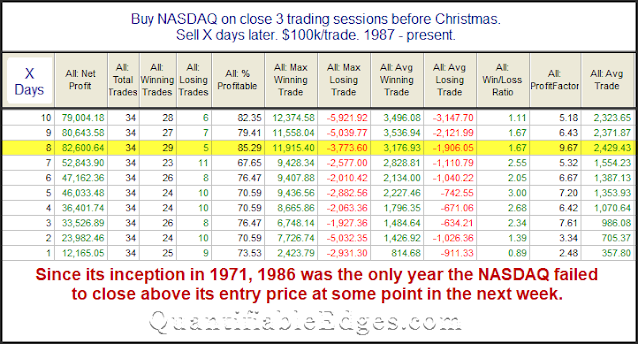
A possible short squeeze
Positioning of systematic and discretionary investors has already declined significantly to the bottom third of the historical distribution (~30-35th percentile). CTAs are fully short small cap and many international indices, while S&P 500 positions are not under pressure given the ~25% one-year appreciation of the cap-weighted benchmark. Volatility targeting and risk parity funds started adding exposure, given muted realized volatility and correlation and internally offsetting large stock moves. There will also be buying of equities into month- and quarter-end – particularly for international, SMID, and cyclical benchmarks that are impacted the most. In short, this is not a setup similar to 4Q2018 from a fundamental or technical angle. Yet, there is aggressive shorting, likely in a hope of declines in retail equity position and cryptocurrency holdings – while in fact both of these markets and retail investors have shown resilience in the past weeks. One should note that large short positions likely need to be closed before (the seasonally strong) January, which is likely to see a small-cap, value and cyclical rally. And given that market liquidity is dwindling, the impact of closing shorts may be bigger than the impact of opening them, when liquidity conditions were better.
Plunging SKEW = bullish
The SKEW Index measures perceived tail-risk by quantifying the price of out-of-the-money call and put options in the S&P 500. The index usually varies between 100 and 150. A high SKEW level indicates a high cost of tail-risk protection and vice versa for a low reading. In effect, the index is a proxy for sentiment and volatility.
Many analysts have unsuccessfully used SKEW as a contrarian trading indicator by buying when SKEW is high and selling when SKEW is low. Instead, I introduce a trading model based on the change in SKEW. Whenever the 10-day change in SKEW falls -10% or more, it has been an effective buy signal for the S&P 500. Rapid declines in SKEW indicate alleviation of market anxiety, sort of like a rapid fall in the VIX Index. It can induce market makers to adjust their hedges, usually by buying the index, much like the way the Robinhood crowd created a price momentum effect with massive buying of individual stocks and forcing market makers to hedge by buying the underlying.
The chart below shows the five-year record of this short-term trading model, where bullish resolutions are shown in grey and bearish ones shown in pink. Buy signals have been successful roughly two-thirds of the time, and it just flashed a buy signal.
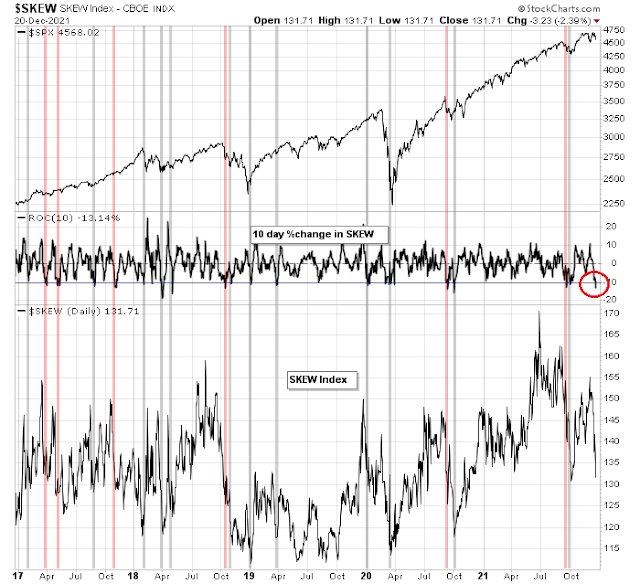
The SKEW model buy signal is timely in light of seasonal effects and consistent with Kolanovic’s call for a short squeeze rally.
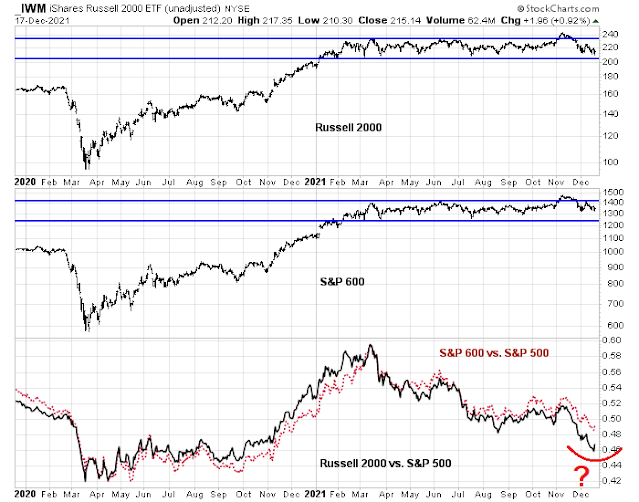
Rebound candidates
With that preface in mind, here are some short-covering candidates that could benefit as a tax loss selling season ends and a rebound begins. Small-cap stocks have traded sideways for most of 2021. They recently exhibited a failed breakout and they are much hated.
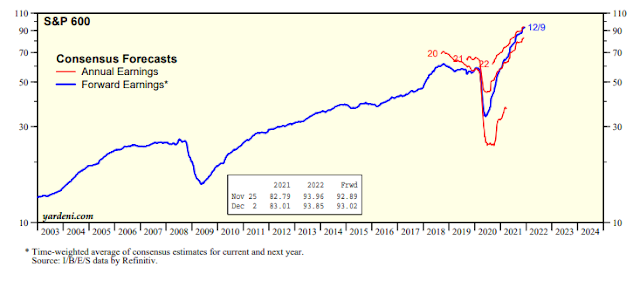
Even though prices have been flat, forward EPS rose steadily in 2021, which makes their forward P/E valuation less demanding.
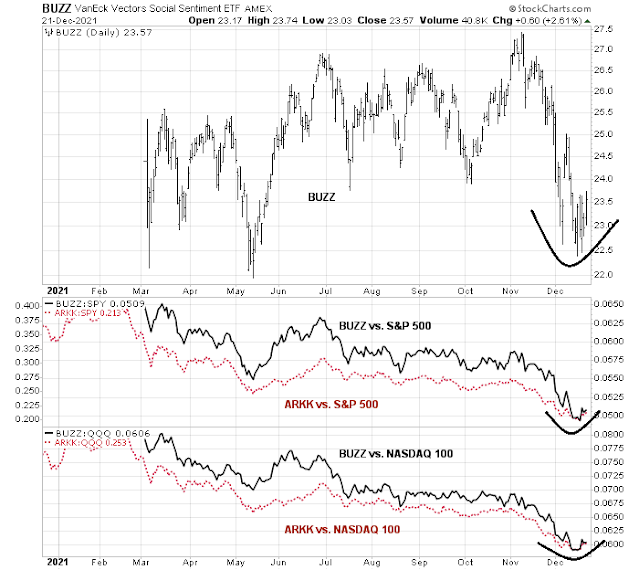
On the other side of the value/growth spectrum, speculative growth stocks have been clobbered recently while high-quality growth FANG+ names have been the leadership. Trading in these stocks has been the province of small individual investors and recent losses could be the catalyst for tax-loss selling. The ETFs ARKK and BUZZ appear to be good barometers of the speculative growth factor. Watch for a short-term rebound.
Buy the junk!

I am trying to figure out the impact of omicron in the real economy first. From what I learned, the dissemination throughout the world will be quite fast, putting aside China, New Zealand and Australia by now. I believe is going to be quite benign. I assume there won´t be lockdowns because of Omicron in most countries. I can’t figure out what the protocols will be. If all infected people has to quarantine there will be ugly moments in most countries. What if a significant part of the health personnel and the police get infected at the same time? This type of situations may greatly impact the mood of the market. I also believe the economic activity will resume by March full throttle.
Global economies are shutting down. The US is deploying army guards to help with this surge. ICUs in USA are filling up and a large number of unvaccinated people are being affected. We are in for a rough winter, as Omicron replaces delta within weeks. Medical community has very few tools in their tool box against the Omicron variant. Pfizer and Glaxo have some solutions but they are in extremely short supply. Effects on the economies are obvious, a slow down in Western Europe and USA.
Cam all the studies that you show reflect a benign
interest rate environment. Have you tested the studies going back when interest rates were rising?
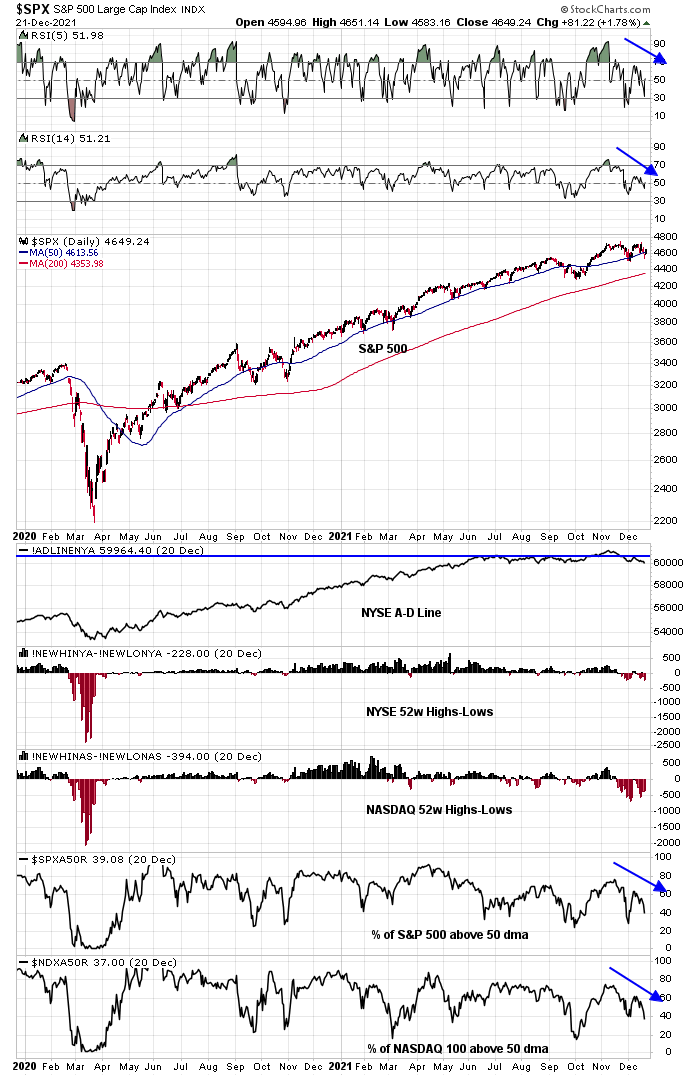
I wonder if the S&P is making a triangle, in which case if it breaks out to a new high the move up after that could be sharp.
News from South Africa says hospitalization is 80% less for omicron. Considering that 61% of US population is vaxxed one can hope that if omicron cases surge the toll will be less. At least the news from South Africa is not suggesting greater virulence. A few more days of positive news from South Africa could also give Santa a boost.
Large vs. small cap performance has been correlated with rising vs. falling case counts…
https://twitter.com/MikeZaccardi/status/1473657206797180930
Building positions in QQQ/ IWM/ EEM + BABA/ LCID this morning.
I think ‘the market’ wants to head higher.
just testing the top of the range. If Russia invades tonight, may get pretty volatile.
QQQ/ IWM/ EEM off.
BABA off.
Paring back on LCID.
Finally hit a line drive. Portfolio up +0.86% over two days. Sure, it might have been much nicer had I jumped in earlier – but I decided to wait for confirmation of buying interest yesterday.
Any thoughts on gold? With money supply tightening, isn’t gold a sell? It has not really broken above 1900 either.