Preface: Explaining our market timing models
We maintain several market timing models, each with differing time horizons. The “Ultimate Market Timing Model” is a long-term market timing model based on the research outlined in our post, Building the ultimate market timing model. This model tends to generate only a handful of signals each decade.
The Trend Asset Allocation Model is an asset allocation model that applies trend following principles based on the inputs of global stock and commodity price. This model has a shorter time horizon and tends to turn over about 4-6 times a year. The performance and full details of a model portfolio based on the out-of-sample signals of the Trend Model can be found here.

My inner trader uses a trading model, which is a blend of price momentum (is the Trend Model becoming more bullish, or bearish?) and overbought/oversold extremes (don’t buy if the trend is overbought, and vice versa). Subscribers receive real-time alerts of model changes, and a hypothetical trading record of the email alerts is updated weekly here. The hypothetical trading record of the trading model of the real-time alerts that began in March 2016 is shown below.

The latest signals of each model are as follows:
- Ultimate market timing model: Buy equities
- Trend Model signal: Bullish
- Trading model: Bullish
Update schedule: I generally update model readings on my site on weekends and tweet mid-week observations at @humblestudent. Subscribers receive real-time alerts of trading model changes, and a hypothetical trading record of those email alerts is shown here.
Subscribers can access the latest signal in real-time here.
Publication schedule next week: There will be no regular strategy publiction next Saturday owing to the seasonal holidays. I will publish a tactical trading comment next Sunday.
A potential inverse H&S
A potential inverse head and shoulders pattern is forming in the S&P 500? The measured upside objective is roughly 4920. Despite the volatility from Friday’s quadruple witching, the S&P 500 held support at its 50 dma.

The bulls shouldn’t break out the champagne just yet. Strictly speaking, head and shoulders patterns are incomplete until the neckline breaks. If the index can stage an upside breakout above resistance, then traders can declare a risk-on tone to the market. On the other hand, if the S&P 500 were to undercut the “head” at about 4500 and invalidate the inverse head and shoulders pattern, things could get very ugly.
Here are bull and bear cases.
The bull case: Fearful sentiment
The bull case rests on a recovery from an oversold condition and washed out sentiment. The 14-day RSI of the DecisionPoint Intermediate-Term Breadth Momentum Oscillator recently recycled off an oversold condition. In the last five years, there have been 23 such signals and 70% of them have resolved bullishly. Do you want to play the odds?

As well, the NAAIM Exposure Index, which measures the sentiment of RIAs, plunged to 52% last week, which is below its lower 26-week Bollinger Band. Since the inception of this index, this signal has virtually been a foolproof buy signal for equities.

Still not convinced that the market is near a washout bottom? Macro Charts pointed out that option order flow conditions have reached a crowded short reading, which is contrarian bullish.

The bear case: Weak internals
The bears will argue that breadth has deteriorated sharply. The S&P 500 tested resistance while exhibiting negative 5 and 14 day RSI divergences. The NYSE Advance-Decline Line retreated below its breakout level, which is another sign of weakening breadth; net NYSE and NASDAQ highs-lows are negative; and the percentage of S&P 500 and NASDAQ 100 stocks above their 50 day moving averages are exhibiting a series of lower highs and lower lows.

As a counterpoint to the poor breadth readings, Washington Service reports that insider buying has spiked and buying levels are the highest since the March 2020 market bottom. As well, insider selling is below this year’s average. If poor breadth is an indication of broad market weakness, then why are insiders, who are thought of as the “smart money”, buying?

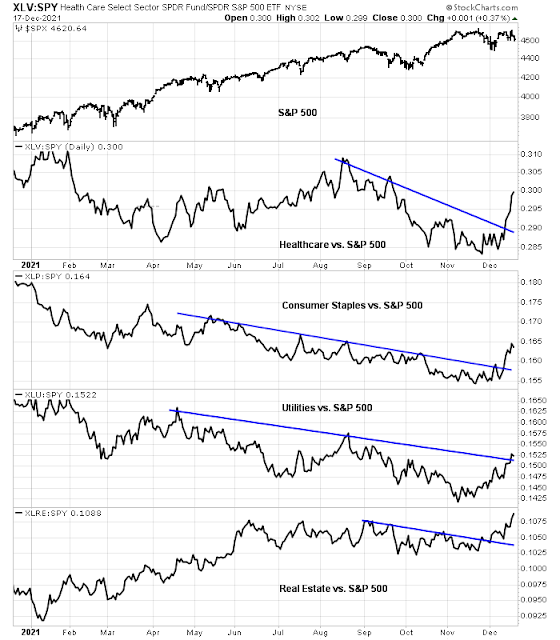
Nevertheless, defensive sectors are staging upside relative breakouts across the board. This is another indication that the bears are seizing control of the tape.
Moreover, equity risk appetite has plunged, indicating a sharp deterioration of market internals.
These conditions call for short-term bullishness and intermediate-term caution. Sentiment is too bearish. In particular, the NAAIM Exposure Index has an impeccable short-term market timing for buy signals.
Be bullish and enjoy some holiday cheer. But don’t overstay the party as the calendar rolls into January.
Disclosure: Long SPXL
My cumulative divergence between the S&P 500 and the NYSE A-D line finally reversed on 21-12-16. (Last significant case 21-08-20). This is promising if sustained, and could it have been a sentiment ‘low’?
A British agency estimates a worst case peak of 2 million Omicron infections a day there by end of December to early January. They have one fifth the American population and are 80% vaccinated. Can you imagine 10 million new cases a day in America? That is a Covid hurricane.
the case numbers in uk and South Africa are not blowing up yet, so hopefully we don’t get a worst case scenario. But if we get a covid storm will the Fed pause?
We just don’t know do we?
Latest data suggest only the Moderna and Pfizer vaccines with a booster shot offers any relevant protection against the new variant.
JNJ, Astrazeneca, etc. do not offer any protection from this new variant.
The US is facing a pandemic of the unvaccinated. Omicron is mild in boosted people with mRNA vaccines.
Is it possible that the members of the NAAIM actually do what they’re supposed to do and lower exposure when risk levels are high? Or are most RIAs wannabe dancers who can’t move to the rhythm of the markets if their lives depended on it?
While anything is possible, NAAIM has been doing the survey since 2006 so I would imagine that they haven’t changed their methodology. Historically, the numbers can swing around a lot.
China Evergrande Group’s two land parcels in Chengdu city, capital of southwest China’s Sichuan province, were taken back by local authority without compensation as the developer has failed to start construction on the land within two years, according to documents released by local government.
Earlier this month, Evergrande’s 8 land plots in Haikou city, Hainan province, were also repossessed for the similar reason.
Just wide-spread pessimism and fear. But let’s see how those folks with real-time big data and powerful computer/algos think. As of this weekend, from Refinitive, the 4Q 2021 and forward four quarters are still increasing. So fundamentally it is OK.
I’m wondering if this is the second COVID bottom? Maybe I’ve gotten too use to buying the dips
Next year, the dips may be a “normal” 10% pull back as money supply gets constrained. Just a hunch.