Preface: Explaining our market timing models
We maintain several market timing models, each with differing time horizons. The “
Ultimate Market Timing Model” is a long-term market timing model based on the research outlined in our post,
Building the ultimate market timing model. This model tends to generate only a handful of signals each decade.
The
Trend Asset Allocation Model is an asset allocation model that applies trend following principles based on the inputs of global stock and commodity price. This model has a shorter time horizon and tends to turn over about 4-6 times a year. The performance and full details of a model portfolio based on the out-of-sample signals of the Trend Model can be found
here.
My inner trader uses a
trading model, which is a blend of price momentum (is the Trend Model becoming more bullish, or bearish?) and overbought/oversold extremes (don’t buy if the trend is overbought, and vice versa). Subscribers receive real-time alerts of model changes, and a hypothetical trading record of the email alerts is updated weekly
here. The hypothetical trading record of the trading model of the real-time alerts that began in March 2016 is shown below.
The latest signals of each model are as follows:
- Ultimate market timing model: Buy equities
- Trend Model signal: Bullish
- Trading model: Bullish
Update schedule: I generally update model readings on my site on weekends and tweet mid-week observations at @humblestudent. Subscribers receive real-time alerts of trading model changes, and a hypothetical trading record of those email alerts is shown here.
Subscribers can access the latest signal in real-time here.
A data and political problem
The S&P 500 experienced an air pocket in late November, sparked by a combination of the news of the emergence of the Omicron virus variant and the Fed’s hawkish surprise. Since then, the Omicron news has been mostly benign. While the new variant is more transmissible, its effects appear to be less severe. Pfizer and BioNTech reported that lab tests showed that a third dose of its vaccine protected against the Omicron variant. A two-dose regime was less effective but still prevents severe illness. With the Omicron threat off the table, the market staged a strong relief rally.
The second threat of a hawkish Fed still remains. As investors look ahead to the FOMC meeting next week, the Fed faces both a data and political inflation problem. The data problem is that inflation surprise is surging all around the world.
The closely watched November CPI report came in in line with market expectations, which was a relief for the equity markets. The S&P 500 responded by rallying to a marginal new all-time high. The Dow and the Transports are holding their previous breakouts.
Despite the market’s relief, there may be further upside pressure on CPI in the coming months. While airfares, used cars, and energy prices are noisy, volatile, and transitory components that have boosted CPI, Owners’ Equivalent Rent (OER) is a large weight in CPI and its outlook is concerning.
While OER (red line) has been relatively tame, it has historically lagged housing prices by about 12 months. If history is any guide, OER should start to rise next summer, a year after housing prices began their upward climb.
While the Fed is in theory independent from Congress and the White House, it nevertheless faces a political problem of rising inflation. This can be summarized by the recent plunge in consumer sentiment. For years, consumer sentiment (blue line) and the unemployment rate (red line, inverted) tracked each other closely. Their recent divergence is an indication that households are becoming less concerned about employment than other economic factors, especially when initial jobless claims printed a half-century low last week. The latest University of Michigan survey tells the story of a dramatic shift in consumer focus.
When directly asked whether inflation or unemployment was the more serious problem facing the nation, 76% selected inflation while just 21% selected unemployment (the balance reported the problems were equal or they couldn’t choose). The dominance of inflation over unemployment was true for all income, age, education, region, and political subgroups.
It can also be explained by the Misery Index, which is the sum of the unemployment rate and inflation (black line, inverted). In the post-COVID Crash era, the Misery Index and consumer sentiment track each other more closely, indicating that households are increasingly concerned about inflation.
These political pressures undoubtedly played a role in the Fed’s recent hawkish pivot. In the wake of Jerome Powell’s Senate testimony, the market is now anticipating that the Fed will announce doubling the pace of its QE taper. At the new anticipated pace, the Fed’s asset purchases will end in March, which allows the Fed the flexibility to begin raising rates at the May FOMC meeting.
While investors will be closely watching the pace of the taper, another key indicator to monitor is the dot-plot and the long-term neutral Fed Funds rate. Former New York Fed President Bill Dudley wrote in a
Bloomberg Op-Ed that he expects three rate hikes in 2022 and the long-term neutral rate should be as high as 2.5%.
For 2022, I expect a median forecast of 0.8%. This would signal three 0.25-percentage-point increases next year – not so many as to require a rate hike in March, but enough to be consistent with the faster taper and the unemployment and inflation outlook.
For 2023, I expect officials to project four more rate hikes, taking the median target rate to 1.8% a year earlier than in the September projections. Such gradual, consistent tightening makes sense once the Fed gets started. But policymakers aren’t likely to anticipate moving more quickly as long as they project inflation to remain below 2.5%.
For 2024, I expect the projected target rate to reach the 2.5% level judged as neutral. Anything less seems hard to justify, given that the economy will have been running beyond full employment and above the Fed’s 2% inflation target for several years.
If the Fed were to follow the trajectory laid out by Dudley, the yield curve would flatten and invert by late 2022 or early 2023, which would be an early signal of a recession – and recessions are bull market killers.
Reasons to be bullish
From a technical perspective, the combination of Omicron news and November CPI print represents a short-term bullish dynamic for stock prices.
The bulls can point to the strong rebound after a series of severely oversold market conditions and panicked sentiment readings. All components of my market bottom models flashed buy signals at the height of the market weakness when the S&P 500 tested its 50 day moving average.
The pullback weakened sentiment readings dramatically. Investors Intelligence bullish sentiment weakened and bearish sentiment edged up. The bull-bear spread tanked.
Similarly, the Citi Panic-Euphoria Model has come off the boil. While readings are still in euphoria territory, they are nowhere as extended as they have been in the past year.
In many ways, the relief rally was no surprise. Historically, the S&P 500 has shown strong returns whenever the VIX Index spiked above 30, indicating fear.
The ensuring rally exhibited strong price momentum. A recent backtest of similar momentum readings showed strong returns. Recently, 80% of S&P 500 stocks were at 5-day highs and the 50 dma was above the 200 dma. There have been only 29 similar instances in the last 30 years. History shows that the market was up an average of 14.3% a year later with a 90% success rate. Average drawdown was only -6.1%.
Notwithstanding those momentum results, the market is undergoing a possible setup for a rare Zweig Breadth Thrust buy signal. ZBT buy signals occur when market breadth surges from an oversold to an overbought condition with 10 trading days. The last day in the window is Wednesday or the day of the FOMC meeting.
Seasonality
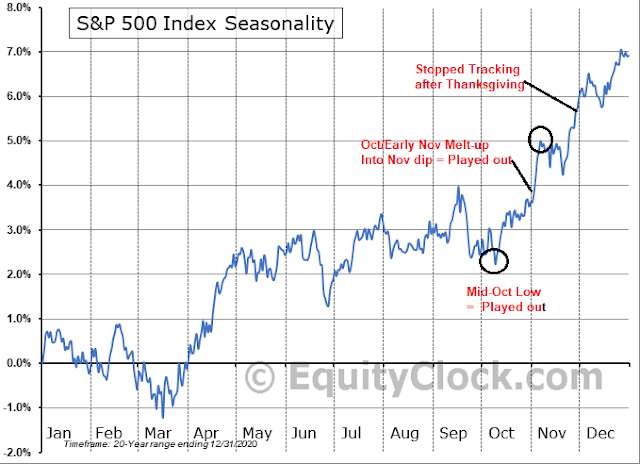
Another consideration to keep in mind is seasonality. Seasonality is only of secondary importance as prices are affected by other factors and seasonality charts only show average returns without any recognition of wide historical variations. This year, the market tracked the seasonal pattern well until Thanksgiving. On average, the market begins to weaken now and begins a Christmas rally about mid-December.
In conclusion, the stock market has shrugged off both the Omicron scare and the Fed’s hawkish pivot scare. My base case scenario calls for further gains until year-end, though traders should be prepared for some FOMC related volatility next week.
Disclosure: Long SPXL


“The ensuring rally exhibited strong price momentum. A recent backtest of similar momentum readings showed strong returns. Recently, 80% of S&P 500 stocks were at 5-day highs and the 50 dma was above the 200 dma. There have been only 29 similar instances in the last 30 years. History shows that the market was up an average of 14.3% a year later with a 90% success rate. Average drawdown was only -6.1%”.
Two of these instances were very very close to the market peaks in 2000 and 2007 (see graph). Based on what you have quoted, Bill Dudley expects yield curve inversion by late 2022/early 2023. Stocks usually peak out six months prior to that point in time and the momentum signal your graph shows may be eerily very close to an impending market top in mid 2022. Does that sound about right?
https://www.schwab.com/resource-center/insights/content/market-snapshot
A rising rate environment is not an immediate death blow to the market. Venerable analyst Liz Ann Saunders discusses three types of rate hike cycles (slow tightening, fast tightening and non-cycles). It appears to me that we could well be in a fast hike cycle from May 2022 (see Cam’s post a few weeks ago, where he shows the probability of rate hike converges to May 2022).
I think the gauntlet has been thrown, next weeks FOMC meeting should confirm this suspicion. If and that is a big if, if Bill Dudley is right, we may quickly find ourselves by Q2-Q3 2022, time frame having to batten the hatches and cut equity exposure.
Any thoughts on this time frame?
Don’t forget that I have been making the case that we are in a mid-cycle expansion. During mid-cycle expansions, rates rise but stocks don’t go down because earnings rise sufficiently to maintain prices, though P/E ratios fall.
I have been calling for a choppy range-bound market in H1 2022, much in the manner of small caps for most of this year.
It would be unusual to see strong momentum persist, but not impossible.
Got it. Thanks.
Let’s keep an eye on the reliable monthly MACD indicator, if indeed you are worrying about timing of recession and beat market.
bear market
Cam,
Here’s a schematic (from Bloomberg) of how the market performs under different types of inflation/tightening regimes…
https://twitter.com/Callum_Thomas/status/1469736422164910081
Would you agree with this?
I think we are in high inflation environment for now. If we stay there, it’s bad news.
Fed maybe is hoping for inflation to cool off by May so that rate hikes may be gradual.
What is fast vs. slow rate hikes?
Slow tightening cycle: the Fed is not tightening at every FOMC meeting.
Fast tightening cycle: the Fed is tightening at most if not all consecutive FOMC meetings.
Non-cycles: The Fed raises rates once or twice but then stops.
Thanks!
Suppose fed starts to hike in March, that puts us ~50 days out….
meaning regardless of which regimes we are in, we can expect another 5% till the top on avg. I am gonna put my lambo order in tomorrow morning.
All bets are off for me until the Fed meeting and the drug company’s scientific assessment of the Omicron. Pfizer saying two jabs equals only 22.5% protection is very disturbing and the early estimate of a spread factor of 3 (every case spreads to 3 others) is also very disturbing. Britain is speeding a lockdown and calling for the public to gear up for a tidal wave of cases. Makes me wonder if American politicians are downplaying the risks knowing that nothing can be done to avoid a bad outcome for the unvaccinated. If an unvaccinated starts to get jabs, to get to a future third dose will take six months of waiting between shots and this is too long to prevent the exponential wave coming at us.
A tweet chain from a member of the Pandemic Data and Analytics team at S.A University of Johannesburg is basically saying deaths due to omicron around 25 times lower than delta and cases are already peaking. I hope we can trust the data they’re using.
twitter.com/pieterstreicher/status/1469743320092102659?s=20
It is likely that, IMO, Fed will speed up the taper timeline but stay noncommittal on the pace of rate hikes. Omicron will spread but will peak and decline like it’s ancestors.
The real question is how inflation behaves and how Fed responds to the incoming data.
I am shocked at the aggressive posture. It’s typical of late stage economic cycle. By most accounts we are still in mid cycle expansion.
BTW on my weather investment season analogy, we are entering ‘Autumn’ because Low Volatility Factor is now outperforming Value, Growth and Small Cap. We are getting closer to ‘Winter’ the bear market.
I call this my ‘Snowbird Investment Strategy’ because I leave stocks when ‘Winter’ arrives like so many Canadians head south to avoid the cold.
Please tell us, when winter’s about to show up 😉
Taking a -0.5% hit on my portfolio here (closing positions in VT/ SMH/ BABA).
Made the wrong call.
Are we transitioning into a bear market, at least underneath the surface of the broad indexes?
Sometimes it’s as simple as the fact that most of my recent trades have been closed for losses. In a bull market, everything works. In a bear market, the win rate declines substantially.
2021 is not 1999, but I’m reminded in some ways of the approach to the 2000 bear market and the mistakes made as former high-flyers pulled back substantially. For instance, a stock that appears to offer an attractive entry after a -50% decline may in fact go on to decline another -90%.
The market has an endless supply of tactics to keep us fully invested until it’s too late. Today’s last-hour ramp followed by an EOD puke is one of them.
The beginning of every bear market in my lifetime was recognized only after the fact. Which is why it’s necessary to play defense ahead of time – and we each have our own set of defensive strategies and/or pattern recognition plays. There is no airtight system.
Looks like sentiment has shifted.
Another late-day ramp. A lot of traders will be front-running tomorrow’s reaction to another Fed Day.