Preface: Explaining our market timing models
We maintain several market timing models, each with differing time horizons. The “Ultimate Market Timing Model” is a long-term market timing model based on the research outlined in our post, Building the ultimate market timing model. This model tends to generate only a handful of signals each decade.
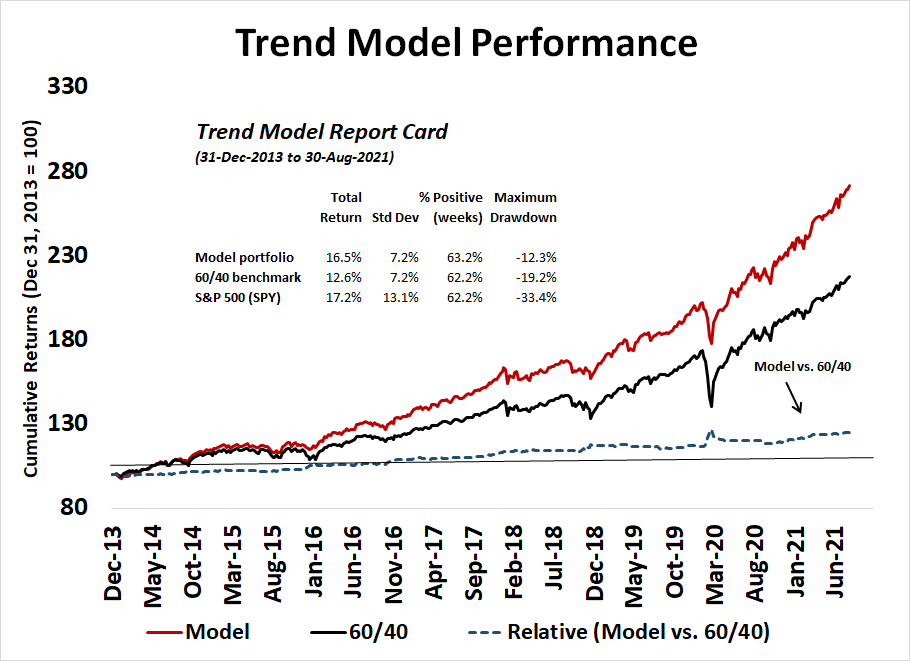
The Trend Asset Allocation Model is an asset allocation model that applies trend following principles based on the inputs of global stock and commodity price. This model has a shorter time horizon and tends to turn over about 4-6 times a year. The performance and full details of a model portfolio based on the out-of-sample signals of the Trend Model can be found here.
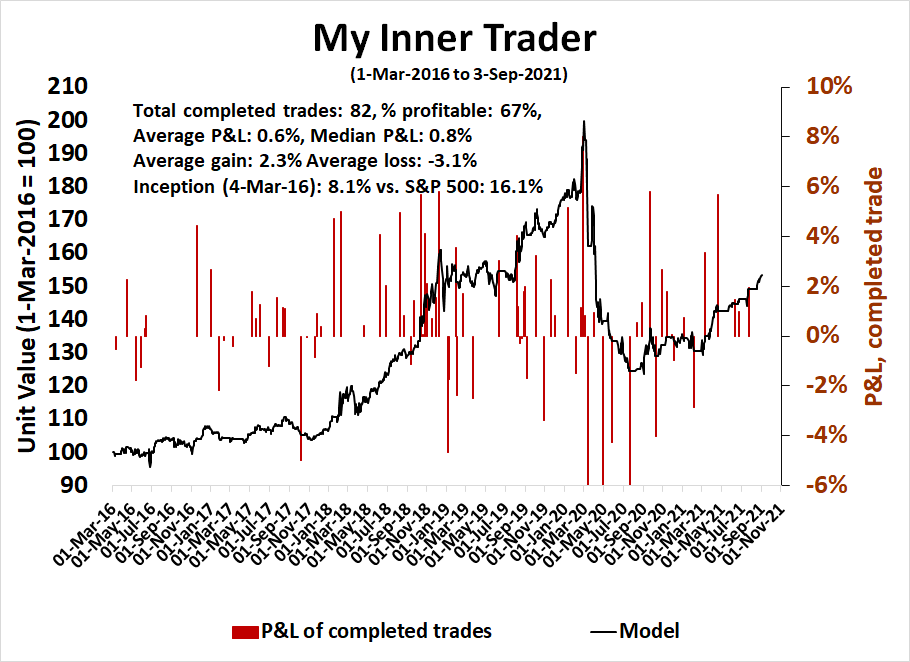
My inner trader uses a trading model, which is a blend of price momentum (is the Trend Model becoming more bullish, or bearish?) and overbought/oversold extremes (don’t buy if the trend is overbought, and vice versa). Subscribers receive real-time alerts of model changes, and a hypothetical trading record of the email alerts is updated weekly here. The hypothetical trading record of the trading model of the real-time alerts that began in March 2016 is shown below.
The latest signals of each model are as follows:
- Ultimate market timing model: Buy equities
- Trend Model signal: Bullish
- Trading model: Bullish
Update schedule: I generally update model readings on my site on weekends and tweet mid-week observations at @humblestudent. Subscribers receive real-time alerts of trading model changes, and a hypothetical trading record of those email alerts is shown here.
Subscribers can access the latest signal in real-time here.
Cautiously bullish
Last week, I alerted readers to a possible rare Zweig Breadth Thrust buy signal (see The Zweig Breadth Thrust Watch). Unfortunately for the bulls, the ZBT failed to materialize, but the S&P 500 remains on an upper Bollinger Band ride while flashing a series of “good overbought” readings on the 5-day RSI. Historically, such advances have not stalled until the 14-day RSI becomes overbought.
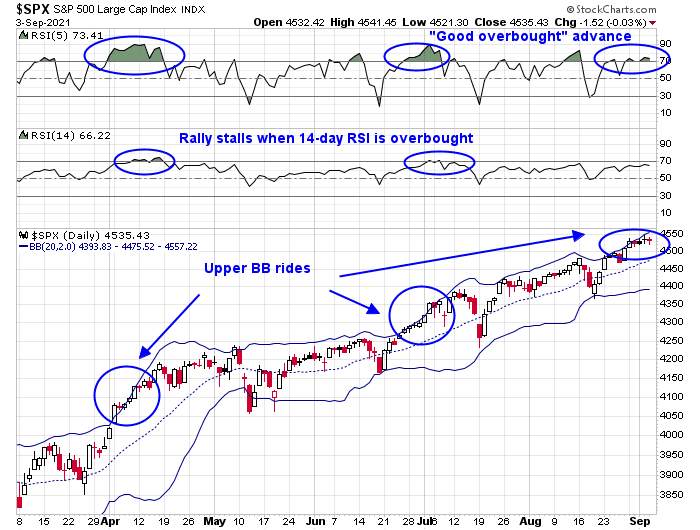
You can tell a lot about the tone of the market by the way it reacts to news. The bears had a golden opportunity to seize control of the tape when presented with a huge Non-Farm Payroll miss on Friday. Instead, the S&P 500 closed roughly flat on the day.
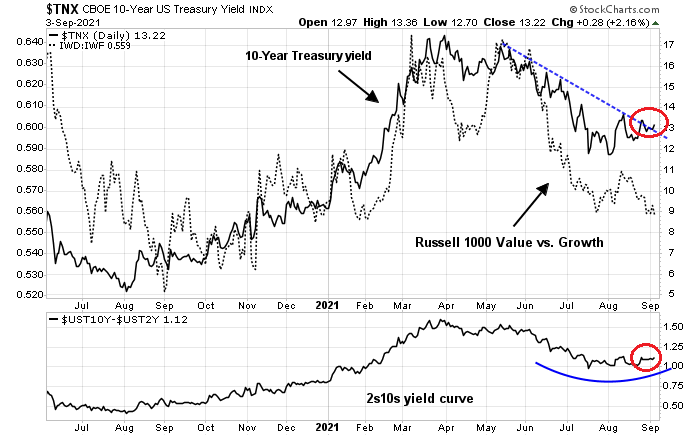
A possible inflection point
Here are some important charts that give some clues on future market leadership. First, what’s the direction of the 10-year Treasury yield? The 10-year Treasury Note has been testing a falling trend line and it is correlated to the value/growth cycle. A rising yield would be the market’s signal that it expects stronger economic growth. Already, the yield curve is bottoming and starting to steepen, which is another indicator of better growth expectations.
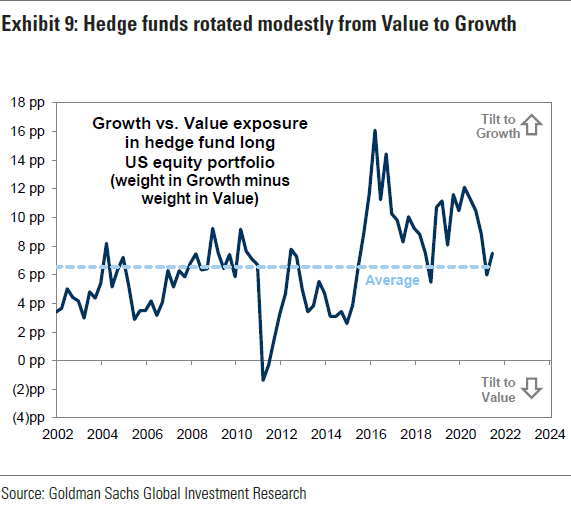
Recent estimates of hedge fund positioning show that the fast money crowd has unwound its value tilt from last year. The value and reflation trade is no longer a crowded trade and readings are now neutral.
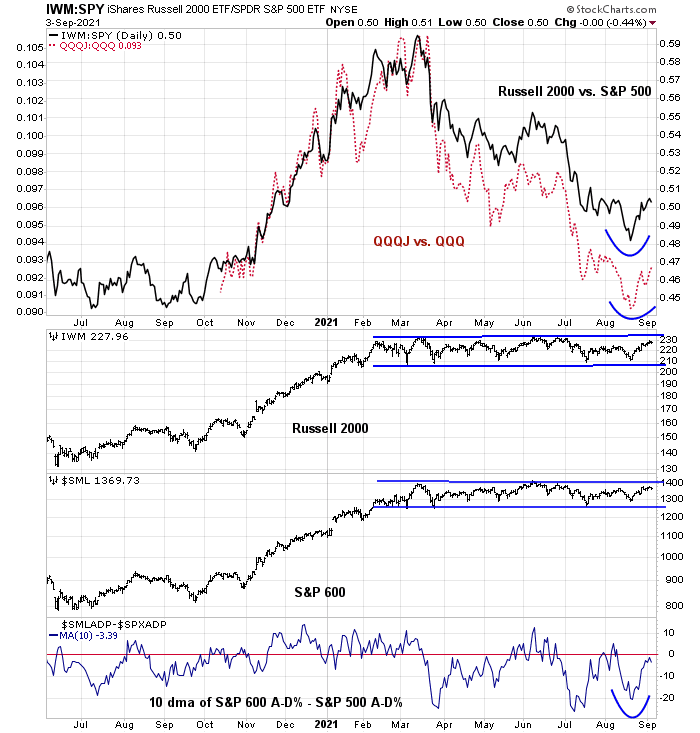
In addition, a sustained market advance may need small-cap stocks to lead the next leg upwards. The relative performance of small stocks is improving and breadth internals (bottom panel) is constructive. However, the Russell 2000 and the S&P 600 remain range-bound.
Small-caps are poised for an explosive rally. Callum Thomas at Topdown Charts pointed out that small-cap fund flows indicate investor capitulation.
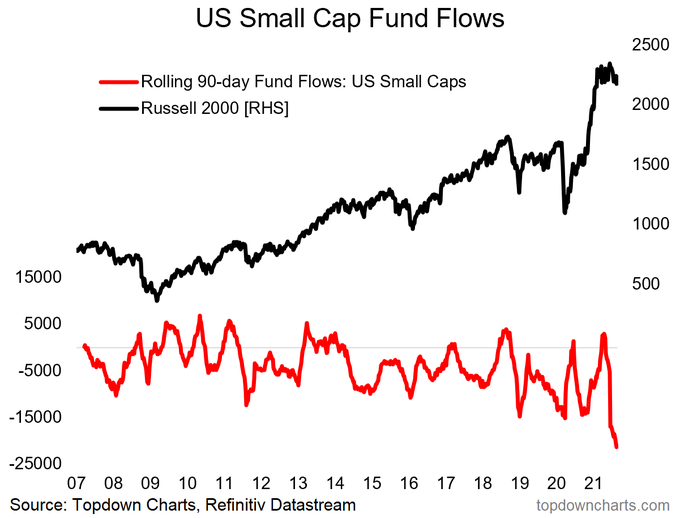
The stage is set. What will light the fuse?
More upside potential
Tactically, the current advance can go a little further. While the NYSE and NASDAQ McClellan Oscillators are better at timing bottoms than tops, neither are overbought yet.

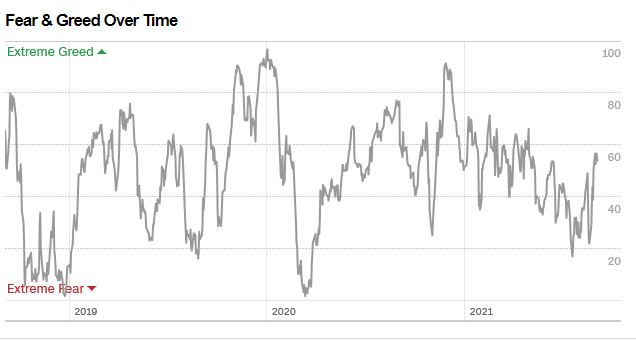
Sentiment models such as the Fear & Greed Index are nowhere near euphoric territory.
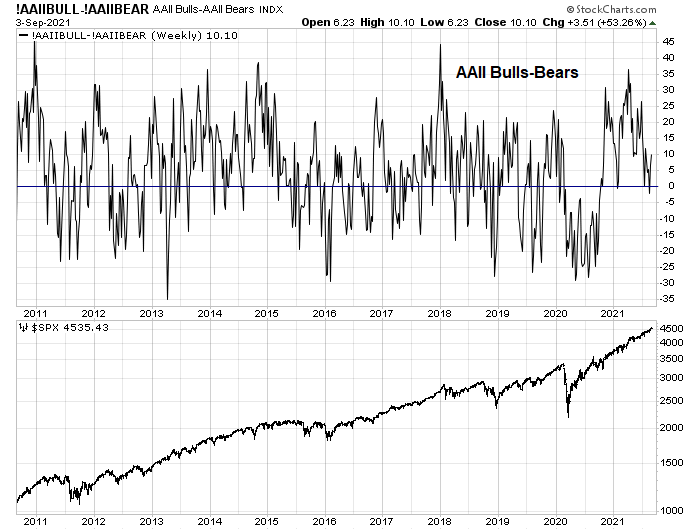
Similarly, the AAII Bull-Bear spread is showing a neutral reading.
As well, Helene Meisler’s (unscientific) weekly Twitter poll shows that net bullishness in retreat despite the market’s slow grind-up last week. This looks like a classic case of the market climbing the proverbial “Wall of Worry”.

In conclusion, the stock market is undergoing a “good overbought” momentum-driven advance. Readings are not overbought yet indicating further upside potential. In addition, cross-asset internals are suggestive of a possible value and growth inflection point ahead in favor of value and cyclical stocks.
Disclosure: Long SPXL
Quant analysts work with indexes mathematically with no thought of the narrative happening to the individual companies within the indexes. (Of course, that is not Cam.) They do what is their strength, which is taking ‘on average’ historical ‘on average’ data to produce better than ‘on average’ alpha over a multi-cycle, multi-decade long term future.
My Tactical Factor Research of Factors within a business/stock market cycle does look at the narrative of what is happening to the companies as the economic and investor sentiment environment evolves and tries to make sense of it.
The Value Index is made up of economically sensitive companies. When a recession hits they, as a group, fall much further than Growth or Low Volatility (I’ll leave out the other French/Fama Factor ‘Small Company’ in this post). They usually fall much further than they should. Weak companies going into the recession, go to the brink of bankruptcy (some fail) and their stock price gets decimated. At the bear market low, the government steps in to save the day (plus the vaccine November 9) and Value explodes up and leads Growth and Low Vol (Nov. 9 Value went up over 10% as Growth fell 2% that day.) All Value stocks soar with the worst companies doing best since mathematically they start from a much lower price. That process ended, in my opinion, in the spring. Since then investors have been digesting the new economic realities and evaluating companies rationally after their mad rush to buy bargains ended. Looking at the sideways movement of the Small Cap indexes shows this process. The crappy companies are being re-rated back down and the good up. So far it is and balanced dynamic and the general index goes sideways.
In the spring, we expected a return to a ‘normal’ economic that would allow economically sensitive Value companies to predictably march higher. But these companies are facing a shit-show of forces; Covid Variant uncertainty, supply chain extreme problems (auto sales plunge from 17 million to 13 almost overnight), consumer sentiment plunges month over month the most in history, extreme inflation of cost-of-goods hitting margins, Chinese and Far East customers going into recessions, government gridlock in getting infrastructure and social support passed, no consumer borrowing at the banks, new consumer habits post-pandemic to be adapted to (example, will executives be flying like they used to since first class is a huge part of airline profits). This is a new and much more uncertain future that will be analyzed company by company, industry by industry. So being selective is vital.
When will the Value Index break out? The stocks are super cheap but these new challenges are enormous. By the end of 2022, I expect companies will have adapted and the Value stock indexes in general will be much higher (carrying general indexes along with them higher). Some individually will shine sooner and do great. Buying some when temporary problems makes a given Value stock a bargain could work but is very difficult. This is all capitalism in action.
But I expect on an index basis, we are now in the Growth phase of the Tactical Factor Cycle which goes like this Bear Market Exit – Value/Small Cap – Growth – Low Volatility – Exit Bear Market. The Low Vol period happens when economic stressors start showing up and investors start shifting to Defensive stocks even as the S&P 500 still is rising. There are few signs of that happening, just a lot of worry. Party on!
The Pure Growth ETF (RPG) is made up of companies whose earnings as a group went up 20% in 2020 when Value ETF (VLUE) went down 12%. Owning this index means you own companies that aren’t faced with the challenges of Value companies. But of course, its valuation is expensive. What ever you do, don’t look at a long-term chart of it. It’s like standing on the rooftop ledge of a skyscraper looking down, it hits our instinctive fear of heights. I’m like the puny safety belt that is around your waist when you look down the 100 floors to the pavement below when I say my research says Growth will outperform the other Factors until Low Vol overtakes it and will make you a decent rate of return until then. I’m whispering in your ear as you look down from on high, with your gut in knots, “It’s okay, trust me.”
OK. Then again, a reasonable alternative is to simply exercise a little patience.
A quick note on the observations about ‘government gridlock in getting infrastructure and social support passed’ – it may be instructive to read views of Senator Joe Manchin, a moderate Democrat. Infrastructure bill is being held hostage to trillions more in borrowings. If one believes that deficits and debt do not matter, then why raise taxes?
Well, we are in a bubble. So it makes sense ironically (when in a bubble nothing does) that growth will get the attention because the price changes are more dramatic. I think value will only truly outperform after the bust when the euphoria is gone. There may be brief episodes, but until people start looking at shares as an investment in future earnings (and dividends as return of money) I think the chasing of Ponzi style returns will continue.
You are missing the most vital point of my strategy, regardless of what you own during the bull market, you MUST, exit during the bear market. Picking great stocks is extremely hard and the future of stock picking to harvest alpha is getting harder. We have satellites watching Tesla parking lots and AI monitoring Internet chats. Missing cyclical drawdowns is easy. I have done it four times since 2000 and can send you newspaper articles published at the bottoms in 2001, 2008, 2016 and last year you subscribers saw it when I exited two days after the peak. Missing 30-50% drawdowns is helps your long term returns much more than stock selection. It is easy because nobody tries. People talk about about it but everyone is on a hair trigger to buy the dip when a bear market is in play.
The investment industry is geared to convincingly investors to leave their wealth in the markets at all times. They say it is impossible to avoid drawdowns and then get back in. That is not true. My record proves it.
Markets in this century have gone from one Fed liquidity driven boom/bust cycle to the next in obvious slow motion, yes obvious, to anyone who cares to see its consequences for stocks. The next bust after this massive liquidity bubble could be the mother of them all and dwarf picking stocks that do a few percentage points higher than their peers.
Let me offer a simple example of an indicator that proves my point. I watch many to gauge investors sentiment, valuation, factor rotation and economic conditions. But let’s look at one in economic conditions, the CCC Junk Bond Spreads from the St. Louis Fed. Take the time to watch them. They will send them free to you daily. Take a look at a long term chart back decades. The spreads widen dramatically during bear markets when you obviously should NOT buy the dips and stay in cash. Then they fall for years to signal safe bull market conditions where you stay more or less fully invested and confidently buy the dips. See what i mean, simple. Will it work when the current bubble pops? YES,YES,YES. To me that alone will help your long term returns more than figuring out how Apple will navigate the next decade.
Yes, the concept is simple. But execution is anything but. Which is exactly why many (if not most) investors would benefit from a financial advisor.
One analogy might be the diet/exercise routine that we all try to maintain. The concept is simple. But execution obviously requires the kind of discipline that most people lack, and they will often rely on coaches to stay the course.
I would guess that all of Ken’s clients have done well, and that most of them understand why they have done well. However, I doubt more than a few of them would have been able to execute the financial/trading equivalent of ‘eat less and exercise more’ on their own.
Ken, what most annoys me about my investing during 2020 was not taking the opportunity to make a large strategic asset allocation to VNQ. In April-May 2020 the risks to the sector appeared to be insurmountable. Does your system include an allocation to US REITs, and if so what changes to your long term allocation did you make, based on what signals?
Thanks so much for your lengthy and thoughtful posts here.
Chuck, I track 114 ETFs every weekend on a momentum basis. That includes EWRE the Real Estate ETF (mainly REITs) and SCHH a REIT ETF. When any ETF sector, country or factor outperforms the Equal Weighted S&P 500 ETF (RSP) is becomes a buy possibility. The REITs have been outperforming but like you, I have avoided them because of the negative narrative.
So my system flags investments but needs a judgement beyond that. If you were more inclined to heed the REIT signal, you would have had the support of the group continually flashing green on a momentum basis as it went up and up even as commentators hated it.
From a Factor analysis basis, after a bear market, the things that went down the most, recover the most even if their fundamentals are bad. It’s just a function that they collapsed more than they should have and then the mathematics of small numbers results in a high % gain on the recovery.
‘Omar’ (The Wire) has passed away.
Will there be a change in character this time – which IMO boils down to whether we see downside follow-through tomorrow.
We have trouble in the Chinese high yield credit markets (no surprise after Evergrande’s issues have been telegraphed for god knows how long), industrials warning on profit (no surprise, we all know they have to face higher costs), vehicle sales and consumer confidence falling off a cliff and the treasury probably running out of cash as well. Just funny that all this didn’t matter while the “big money” managers were on vacation.