Preface: Explaining our market timing models
We maintain several market timing models, each with differing time horizons. The “
Ultimate Market Timing Model” is a long-term market timing model based on the research outlined in our post,
Building the ultimate market timing model. This model tends to generate only a handful of signals each decade.
The
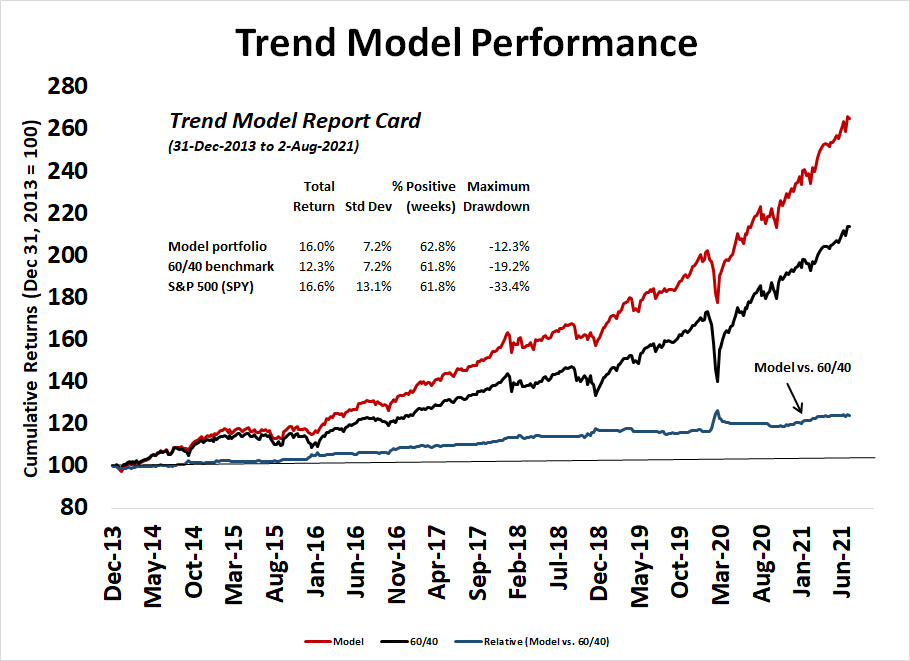
Trend Asset Allocation Model is an asset allocation model that applies trend following principles based on the inputs of global stock and commodity price. This model has a shorter time horizon and tends to turn over about 4-6 times a year. The performance and full details of a model portfolio based on the out-of-sample signals of the Trend Model can be found
here.
My inner trader uses a
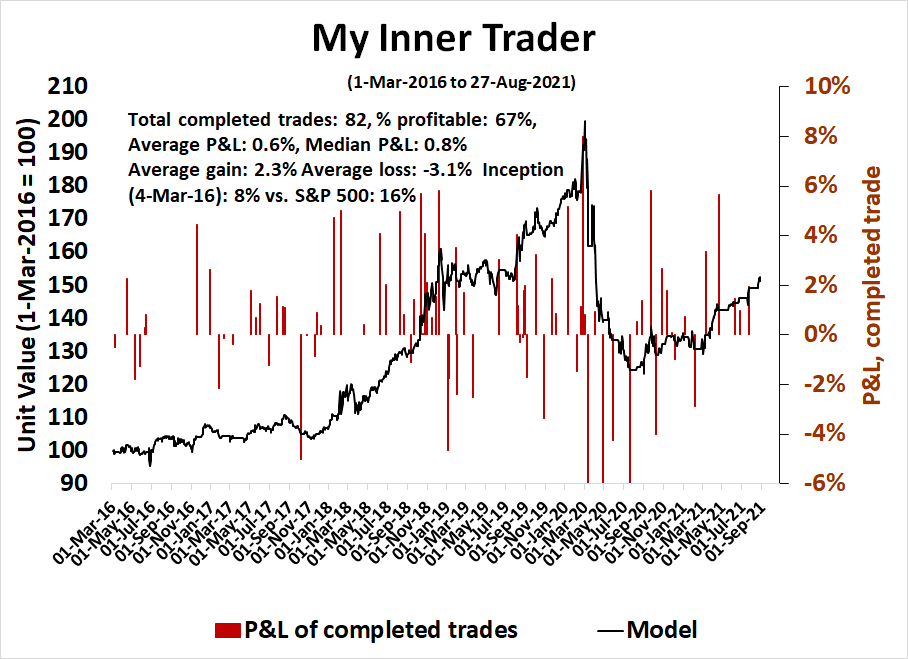
trading model, which is a blend of price momentum (is the Trend Model becoming more bullish, or bearish?) and overbought/oversold extremes (don’t buy if the trend is overbought, and vice versa). Subscribers receive real-time alerts of model changes, and a hypothetical trading record of the email alerts is updated weekly
here. The hypothetical trading record of the trading model of the real-time alerts that began in March 2016 is shown below.
The latest signals of each model are as follows:
- Ultimate market timing model: Buy equities
- Trend Model signal: Bullish
- Trading model: Bullish
Update schedule: I generally update model readings on my site on weekends and tweet mid-week observations at @humblestudent. Subscribers receive real-time alerts of trading model changes, and a hypothetical trading record of those email alerts is shown here.
Subscribers can access the latest signal in real-time here.
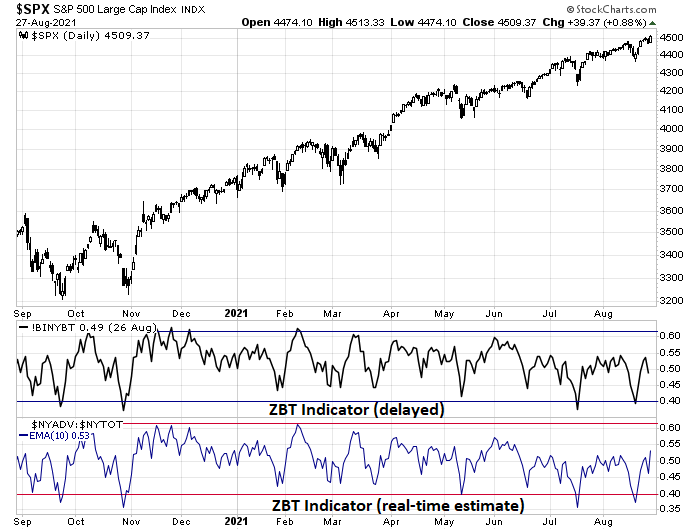
A possible ZBT buy signal
The Zweig Breadth Thrust buy signal is a rare momentum buy signal that only occurs once every few years.
Steven Achelis at Metastock explains the indicator this way (emphasis added):A “Breadth Thrust” occurs when, during a 10-day period, the Breadth Thrust indicator rises from below 40% to above 61.5%. A “Thrust” indicates that the stock market has rapidly changed from an oversold condition to one of strength, but has not yet become overbought.
According to Dr. Zweig, there have only been [sixteen] Breadth Thrusts since 1945. The average gain following these fourteen Thrusts was 24.6% in an average time-frame of eleven months. Dr. Zweig also points out that most bull markets begin with a Breadth Thrust.
The ZBT window began on Friday August 20, 2021. It has 10 trading days, or until September 2, 2021 to flash a ZBT buy signal.
Besides a possible ZBT buy signal as an indicator of powerful price momentum, here is what else I am watching.
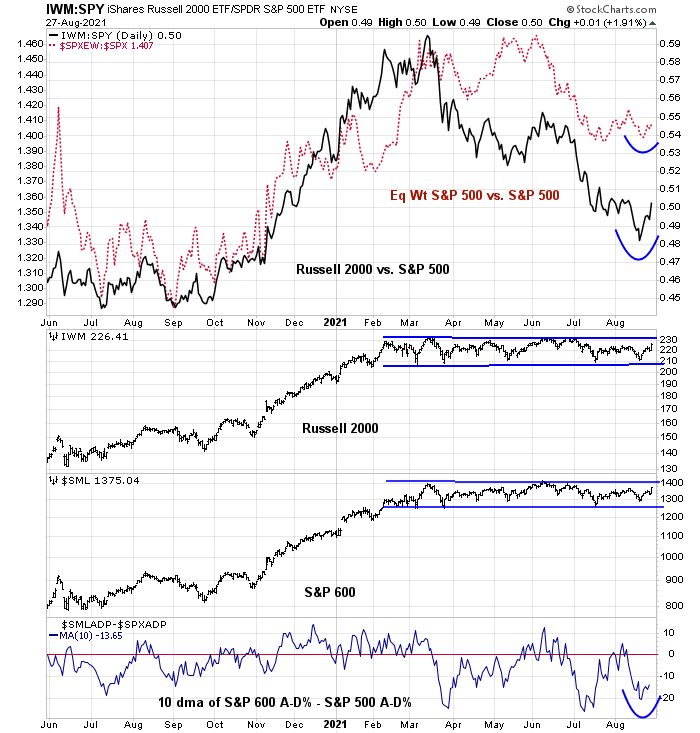
Risk appetite indicators
In particular, I am monitoring for signs of risk appetite. As an example, the high-beta small cap indices remain range-bound, but their relative performance is improving. As well, internal breadth (bottom panel) is showing a turnaround. I interpret these as constructive signs for the bull case.
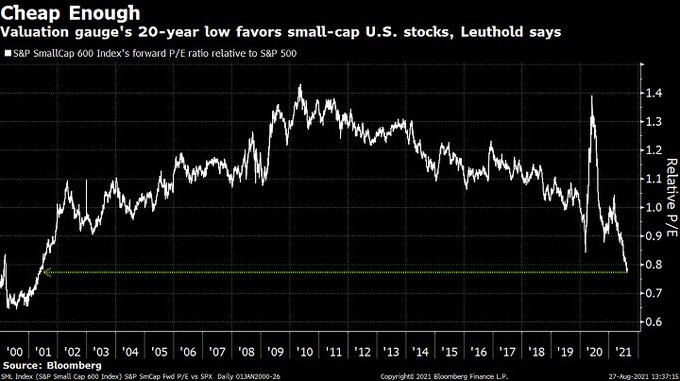
The relative performance of small cap stocks is an important beacon of the cycle in light of the vast gulf in relative valuation.
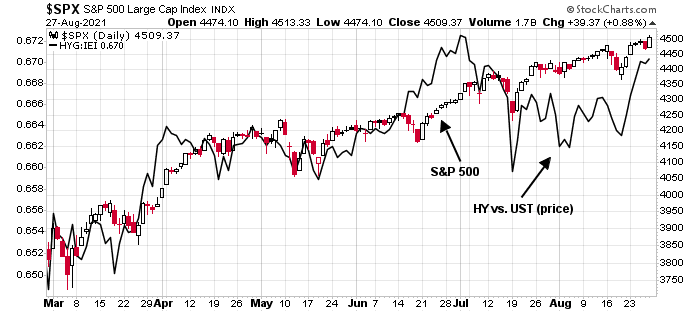
Credit market risk appetite, as measured by the relative price performance of junk bonds against their duration-equivalent Treasury counterparts, is also turning up.
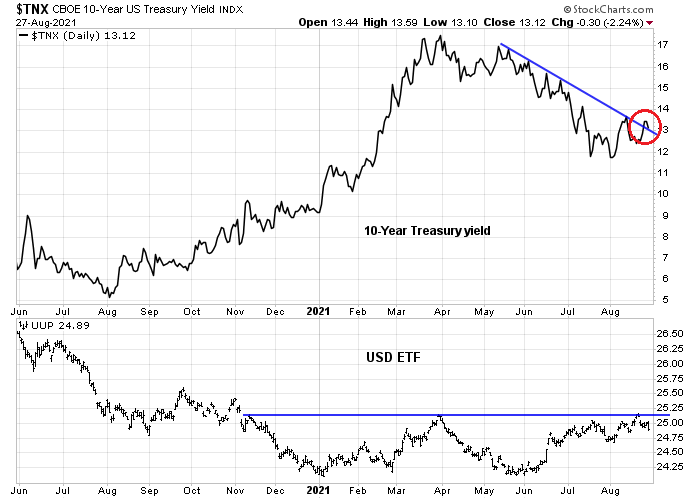
The 10-year Treasury yield is testing its falling trend line, which is bullish for the cyclical and reflation case. However, the USD Index is testing resistance and an upside breakout would be bearish for cyclicals. Which way will the market turn?
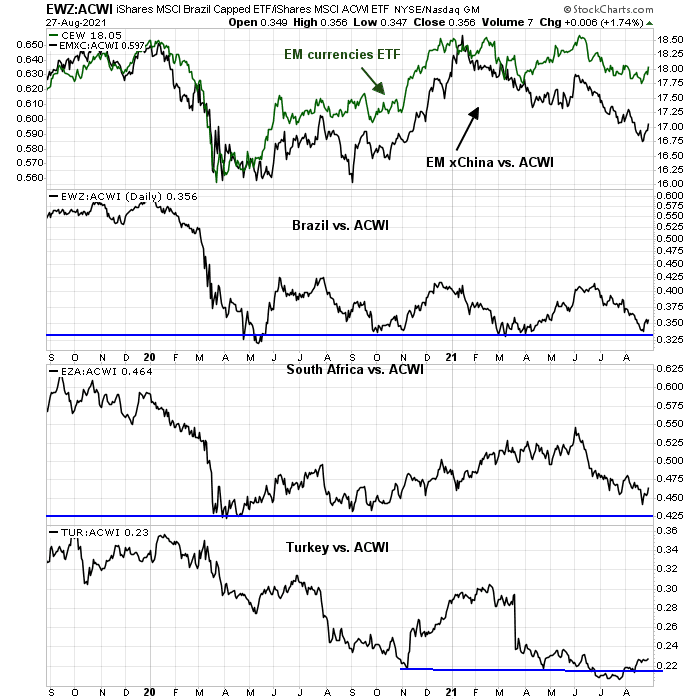
If the USD were to strengthen further, the first to feel the effects would be the fragile EM countries with large current account deficits. How would their stock markets behave?
Even if the market fails to flash a ZBT buy signal, these cross-asset indicators serve as possible confirmations of a bullish tone to the market.
Value and growth
Another important indicator of market direction is the relative performance of value stocks, which are more cyclically sensitive, to growth stocks. Value has been trying to bottom out against growth in the past few weeks, but relative internals (bottom two panels) remain weak. Better relative performance of value would be an important indicator that the reflation bulls have seized control of the tape.
There are hopeful signs.
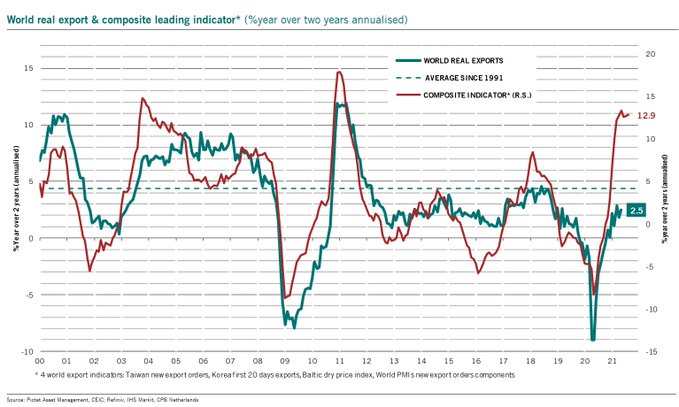
Patrick Zweifel of Pictet Asset Management pointed out that global trade is turning up, largely owing to resilient trade data from South Korea and Taiwan.
As well, COVID-19 hospital admissions appear to be peaking, especially in problematical jurisdictions like Florida, Texas, and Arkansas. These are also bullish signs for a cyclical rebound.
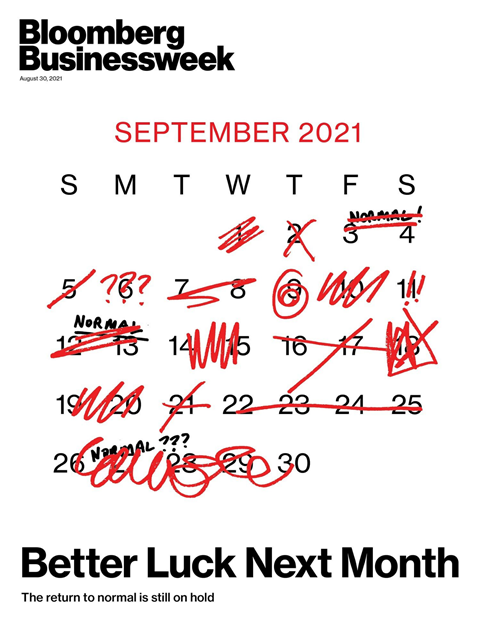
In addition, this Bloomberg Businessweek cover is a classic contrarian magazine cover indicator that is bullish for the cyclical and reflation trade.
Seasonal tailwinds
The cyclical and reflation trade may start to enjoy a period of positive seasonality. Let me explain what may be a complicated but important cross-asset relationship.
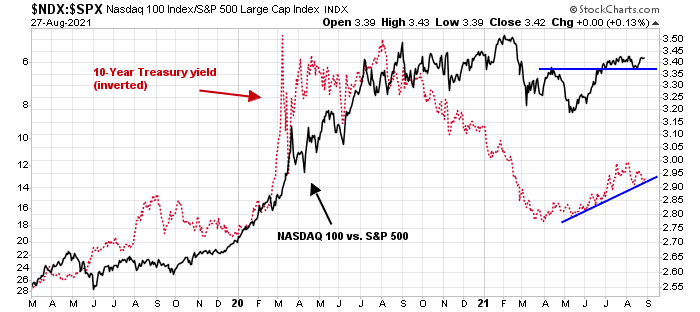
Much of the value and growth relationship depend on bond yields. The relative performance of the growth-heavy NASDAQ 100 has been correlated to the 10-year Treasury yield.
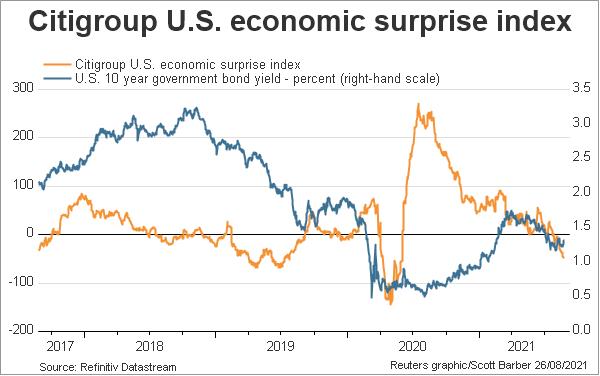
The 10-year Treasury yield is correlated to the Economic Surprise Index (ESI).
However, the ESI Index has shown a high degree of seasonality and it is poised to turn up.
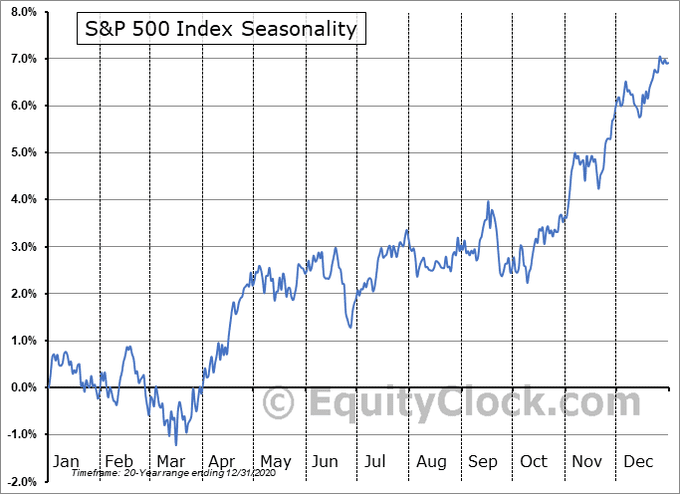
In addition, the S&P 500 is poised for a period of positive seasonality after some volatility in September.
In conclusion, the market may be on the verge of an important Zweig Breadth Thrust buy signal, which would be a powerful and bullish indicator of price momentum. Even if the ZBT buy signal were to fail, other indicators makes me constructive on the outlook for US equities.
Stay tuned.
Disclosure: Long SPXL


There’s skepticism in the rally due to all the negative news happening: delta cases rising, Fed tapering, supply chain delays, new lock downs, etc. Lots of perma-bears are also in disbelief at the continued extent of the rally.
Still holding long.
‘According to Dr. Zweig, there have only been [sixteen] Breadth Thrusts since 1945.’
I interpret the sixteen in brackets to mean that there have in fact been only sixteen occurrences between 1945 and present day, or about once every five years. Definitely few and far between!
The most amazing ‘risk on’ happenings last week were the relative plunge in Defensive sectors (especially Low Volatility) and the violent liftoff of Resource Value stocks. This was the exact opposite of the previous week’s performance when Resource Value plunged after falling since May. The previous week drop in commodity resource seems to me to mark a ‘give up’ sentiment low. The plunge in Defensives is a kick-start to stop worrying and be optimistic.
The other thing I liked about last week is that it was an everything rally with Value and Growth doing well rather than having one up while the other falls.
A good sign was the Banks lifted off solidly. Why not? Powell says reducing QE won’t lead to higher Fed Funds. That means low Fed Funds as the taper leads to higher long rates. Great for banks.
Powell has shown us a tranquil path into the future as he grooms his resume for a job extension. We can stay spooked by our own shadows or follow the path.
I have understood your posts to convey the thesis that value should massively outperform growth over the expansion phase of the current business cycle. Are you now suggesting that skies are clear and blue for both growth and value to do well?
The Factor market cycle can be compared to the four seasons; Winter (Short Momentum), Spring (Value), Summer (Growth), Autumn (Low Vol).
We are transitioning from Spring to Summer so a mix of Value and Growth along with their cousin Quality wins the day. Once, Value and the economic recovery are fully appreciated, the shift to Growth will happen (ESG as well). This is the sweet spot of the economic recovery, the Summer when memories fade of the harsh winter behind us and all is good.
The most important thing every cycle is to miss Winters (bear markets). There are no signs of Winter on the horizon. We will see a shift to Low Vol outperformance (Autumn) as investors start to worry about Winter coming. That will give us a lead time to prepare for Winter storms.
I call my clients Investing Snowbirds because they avoid winters. We are having a big belated celebration on Wednesday because we missed the Covid Crash. We would normally have done this soon after the Crash but we waited for us to be vaccinated. We also partied at the bottom of the Tech Crash in November 2001, the GFC in December 2008 and the Commodity Crash of 2015 in January 2016 when we missed those Winters.
Thanks! So, we should be underweight value and overweight growth?
Moving in that direction for sure.
Value now needs to be selective. The crap Value stocks goes up more in the Spring since they crashed more in the Winter. Now they sort themselves out on their merits.
You know it’s all crazy.
I was looking at a 100 year chart of the Adline for the Dow, interesting that there were only 2 times it went negative, the depression and the 70s. Maybe a true bear back then. Now you can say the Adline will never go to 0 again. Never is a long time. Interestingly, during those 2 periods there were sentinel events with gold, 1933, and 1971…what will they do now?
I think it boils down to speculative moods vs wanting a return on money. The bond market it all about return on money, and some day we will return to a mood of wanting an income stream and not speculating. Think about it! We have been in a speculative mood for 40+ years…some people will get a wake up call.
My son wants to write covered calls on AAPL, which is fine (for a small % of your wealth). I showed him a chart of CSCO which is just getting back to it’s Dotcom levels. I’m not sure why it is so incredibly hard to cut losses and ignore the siren call of “if you wait I will go back up so you can get out unscathed”, but it is a powerful one.
Yes, I think short term we go up, may we get a ZBT and blast off…good….but it may be the last blast.
Oh, maybe Covid receding will help…..but then after the party, the grim realization that now in the past Covid era, things are not so great, and the federal pursestrings are in a knot (my way of saying the Dems no longer have majorities)….umm, disappointment.
Just look at a 100 year chart of the Dow or S&P, and you can see the aberration…something is off….but I did say a few months ago the S&P could go to 5000.
It’s crazy
What some say is the Fed has distorted the price of money….I think they are right…this is why we have Pet rock nfts,bankrupt companies hitting all time highs (AMC). What happened to “hard earned money”? We will have a reckoning of hard lost money….stay alert…keep an eye on credit spreads..the bonds
I hear you and agree totally. Thanks for your thoughts.
Opening a day trade in TIP (iShares TIPS).
Taking the small gain while I still have one.
KRE (re)testing Friday’s lows – taking a swing here.
XLF – ditto.
And another swing at TIP.
All positions off at/near the closing bell. Slightly green for the day.
Still bearish.