I was recently asked my opinion on what a safe withdrawal rate for a deferred-tax pension plan managed with the Trend Asset Allocation Model.
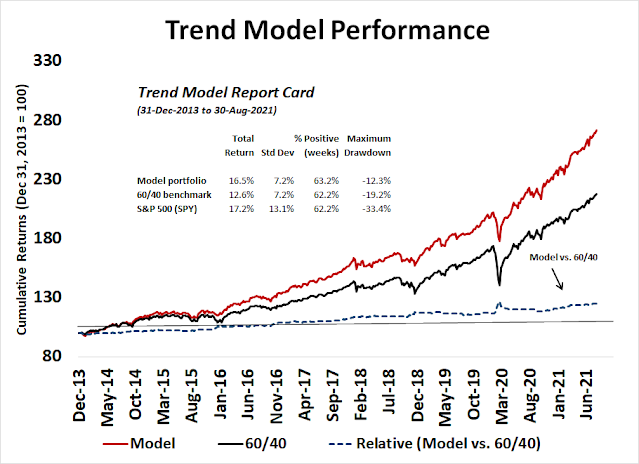
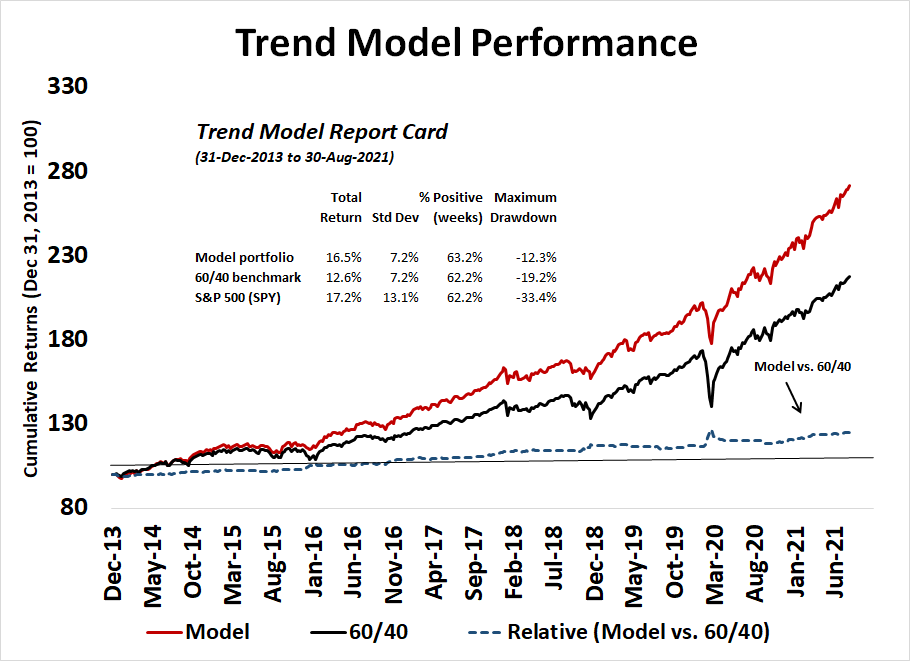
As a reminder, the Trend Model has shown equity-like returns with balanced fund-like risk. The latest update of the model shows another strong month, with a one-month return of 2.5% compared to 1.7% for the 60/40 benchmark and a YTD return of 18.0% compared to a 60/40 return of 12.8% (full details here). Model returns are based on out-of-sample signals, though based on a hypothetical asset mix.
The base case
Let’s begin with a base case analysis. In 1994, Bill Bengen originated the 4% rule, which has become the industry standard recommended annual rate of withdrawal. Since then, Bengen indicated that a 4.5% withdrawal rate as a way of keeping up with inflation.
I believe that Bengen has made a critical error in his analysis and the 4.5% withdrawal rate may be overly aggressive because of low rates. Bengen used historical return data to model withdrawal rates when interest rates were much higher during the backtest period. Today, the 10-year Treasury yield is about 1.3%. If we add in Aswath Damordan’s equity risk premium estimate of 4.4%, equities can expect to return 5.7% in the long run.
So I made some basic assumptions in modeling a base case scenario:
- Bond yield and expected return 1.5%
- Equity return 6.0% (4.5% equity risk premium)
- Use of low-cost index funds
- A 60/40 portfolio with a 8% standard deviation volatility
- Inflation 2%
- Expected time horizon 25 years (life expectancy of 90 assuming retirement at 65)
- The withdrawal rate is defined as a percentage of the initial value of the portfolio, adjusted for inflation. For example, if we apply a 4% withdrawal rate to a $1 million portfolio, the withdrawal in year 1 is 40K, and 40K + inflation in year 2, etc.
In an average case, a reasonable real withdrawal rate would be 3.0% to 3.5%, or 5.0% to 5.5% on a nominal basis. However, an investor using an average case runs the risk of running out of money at the end of the 25 year time period.
I modeled a worst case analysis, where the portfolio takes the worst drawdowns during the initial years and enjoys the best returns in the later years. Under those conditions, the safe withdrawal rate is about 1.5% real, or 3.5% nominal.
Sensitivity analysis
If we assume that the pension plan was to realize equity-like returns with balanced fund-like risk using the Trend Asset Allocation Model, the number improve. In an average case, the safe withdrawal rate is 4.0% to 4.5% real, or 6.0% to 6.5% nominal. In the worst-case analysis, the corresponding figures are 2.0% to 2.5% real, or 4.0% to 4.5% nominal.
There are many moving parts to this analysis and your mileage will vary. How much risk you want to take between the average case and the worst case is up to you. There are many portfolio simulators available. Unfortunately, they all use historical data but there haven’t been instances where interest rates begin at such low levels, which would substantially reduce return assumptions.
I made my study using US market assumptions. Arguably, investors can realize better long-term equity returns with a globally diversified equity portfolio.

As another illustration of sensitivity analysis, John Rekenthaler at Morningstar modeled the effects of differing assumptions on withdrawal rates using a portfolio simulator. Although I disagree with some of his basic assumptions, such as a portfolio return of 7%*, this study nevertheless illustrates the effects of changes in return and portfolio volatility assumptions on withdrawal rates.
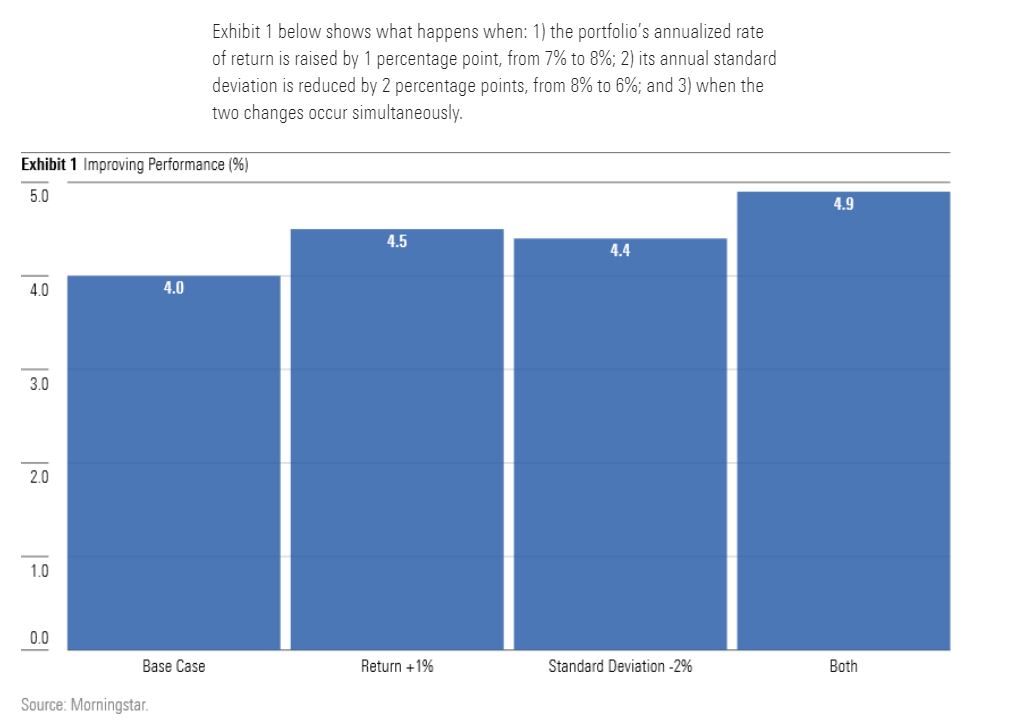
*A 60/40 portfolio with a 1.5% bond market return translates to a whopping expected equity return of 10.7% – which is far too aggressive.
In conclusion, I have conducted a study of the safe withdrawal rate using relatively conservative assumptions with a base case scenario of no alpha, and a more aggressive scenario using the Trend Asset Allocation Model. Limited sensitivity analysis also outlines the risk and return trade-offs that investors will bear given different return and volatility scenarios.
The rest is up to you. Your mileage will vary.
https://www.cnbc.com/2021/08/31/home-prices-surged-in-june-shattering-another-record-sp-case-shiller-says.html
Those numbers began to show up in Zillow estimates in July. Just unbelievable.
Cam, thanks for the objective theory which assumes a rational investor.
Dalbar’s continuing study of mutual investor behavior shows a 2.9% underperformance due to behavioral errors at market turning point over the last 20 years. Recently it is almost 5%.
https://www.marketwatch.com/story/americans-are-still-terrible-at-investing-annual-study-once-again-shows-2017-10-19
GMO who I think is the most credible firm on projecting future investment performance says the S&P 500 with have zero return over the next 10 years. They put the bond rate of return low as rates rise to offset income.
So, combining the two we have a negative rate of return for the average investor or at best a zero return if the stock market does its normal gain with investors messing up. That is the real world of human biases.
I must say even we more knowledgeable investors fall prey to our biases.
The solution is to abandon buy-and-hold strategies and adopt tactical asset allocation to avoid drawdowns (bear markets or investment Winters in my seasonal investing lingo).
This is easy. I’ve missed the last four crashes this century. Easy like crossing those crevices those Everest climbers have to cross on horizontal ladders. Just don’t look down!
BTW that 2.9% underperformance is EVERY YEAR not total.
Thanks Cam for writing on this topic. I have read a lot on this topic, would encourage those interested to develop their own models for SWR based on your risk tolerance. For most this will fall into 3-4%.
One of the best detailed series on SWR can be found at https://earlyretirementnow.com/safe-withdrawal-rate-series/
Great link – thanks!
Reopening a position in TIP (TIPS).
Taking a swing at WFC.