The trader Alex Barrow recently observed that the sentiment backdrop is setting up for a bond market rally.

While Barron’s is not as reliable as The Economist as a contrarian magazine cover indicator, the stars appear to be lining up for a counter-trend rally in bond prices. Here is what a potential bond market means for the other major asset classes.
Bond market rally ahead?
Notwithstanding Barrow’s sentiment model observation, a number of other indicators are pointing to downward pressure on bond yields and upward pressure on bond prices. The Citi Economic Surprise Index, which measures whether economic indicators are beating or missing expectations, has been falling. Growing growth disappointments should act to depress bond yields.

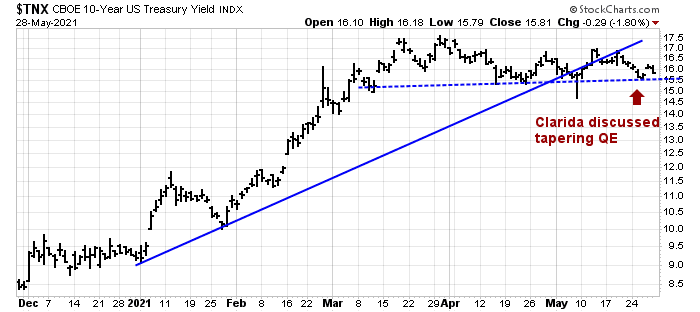
You can tell a lot about market psychology by the way it reacts to the news. Fed vice-chair Richard Clarida raised the possibility of a QE taper in a Yahoo Finance interview.
“It may well be” that “in upcoming meetings, we’ll be at the point where we can begin discuss scaling back the pace of asset purchases,” Clarida said Tuesday in a Yahoo! Finance interview. “I think it’s going to depend on the flow of data that we get.”
In response, the 10-year Treasury yield fell on the news. From a technical analysis perspective, the behavior of the 10-year yield is constructive for bond bulls as it violated a rising trend line and it is in the process of testing an important support level.
History shows that bond yields have fallen whenever the Fed tapered. This a counterintuitive result but tapering has not been bearish for bond prices.

The bond market’s reaction can be explained by an acceptance of the Fed’s full employment narrative. The low-income employment recovery is still lagging, which is an indication that the Fed will remain dovish for some time.

Transitory inflation fears
The bond market was briefly jolted Friday when Core PCE, which is the Fed’s favorite inflation indicator, spiked to an above expectations level of 3.1%. However, George Pearkes of Bespoke Investment Group pointed out that only five categories accounting for 3.2% weight in expenditures generated nearly two-thirds of the PCE surge.

The Fed is likely to shift its focus from Core PCE to Trimmed Mean PCE, which remains tame.
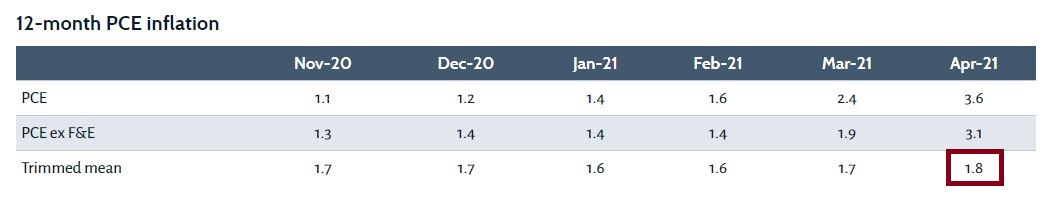
In short, price increases are not widespread and can be explained by supply chain bottlenecks. This is what “transitory” inflation looks like.
Growth stock counter-trend rally ahead
While it’s difficult to make a call on the direction of the S&P 500 based on a possible bond market rally, market internals are likely to shift, especially in light of this highly bifurcated stock market environment.
Growth stocks have long been thought to be high duration instruments. That is to say, they tend to be more sensitive to changes in interest rates. Investors should therefore expect that falling bond yields to benefit growth stocks over value stocks.

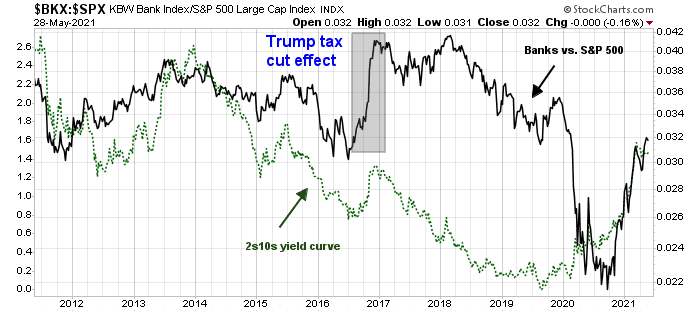
Financial stocks, which comprise a significant portion of the value stock universe, don’t perform well if bond yields are falling. Falling bond yields should flatten the yield curve, as the short-end is already pinned at zero or nearly zero. In the past 10 years, the relative performance of bank stocks has been correlated with the shape of the yield curve. A steepening yield curve has historically boosted bank shares because they have a tendency to borrow short and lend long. This tight relationship diverged in 2017 because of the Trump tax cuts, which raised banking industry profitability.
Indeed, the performance of the Rising Rates ETF (EQRR), which is overweighted in the value and cyclical sectors of Financials, Energy, Materials, and Industrials, has begun to underperform the S&P 500. Investors should therefore expect a pause in the reflation and cyclical trade should a bond market rally begin to materialize in earnest.

The market breadth of value against growth is also signaling a turn towards growth stocks. The spread of percentage bullish on point and figure charts and percentage above their 50 dma are all moving against value towards growth.

So far, the long-term trend of a value turnaround remains intact. The analysis of value and growth ratios by market cap band shows that mid and small-cap value stocks are the most vulnerable to a value/growth reversal owing to the steepness of the recent performance of value stocks in those market cap band groupings.

The possibility of a counter-trend relative rally by growth stocks does not negate my long-term bullish outlook for value stocks. Nothing goes up or down in a straight line. The history of the value revival in the wake of the dot-com bubble shows that there were brief interruptions in the value rally. I expect that any growth reversal is just a brief interruption. While traders could position themselves for outperformance by NASDAQ and speculative names, investors could regard such an episode as an opportunity to lighten up on their growth positions and rotate into value.

USD and gold
A falling bond yield also has important implications for the USD and gold prices. The yield spread between Treasuries and other major currency debt instruments has been narrowing, especially against Bunds. Further downward pressure on the UST yields will put downward pressure on the USD Index, which is already testing a key support zone (bottom panel). This is greenback bearish. Since gold prices tend to be inversely correlated with the USD, it is by implication gold bullish.

From a technical analysis perspective, both gold and gold mining stocks have staged upside breakouts from multi-month flag formations, which are bullish continuation patterns. In addition, gold prices are also highly dependent on real rates. TIPS prices (red dotted line, top panel) have been rising steadily and they are forming a bullish divergence. As well, TIP vs. IEF (7-10 year Treasury ETF, grey line, bottom panel) have been rising in lockstep with inflation expectations. I interpret all of these conditions as bullish for gold prices.

In conclusion, the market is setting up for a bond market rally of unknown magnitude and duration with the following implications for other asset classes:
- Bullish for growth stocks over value stocks;
- Expect a pause in the cyclical and reflation trade, which is highly correlated to value;
- USD bearish; and
- Gold bullish.
Tactically, I would watch for a definitive upside breakout in bond prices as the bullish trigger.

Disclosure: Long GDX
I believe the softness in Value is situational within a few key industries and not a factor shift from Value to Growth. The last two weeks has seen a major ESG attack on the oil majors, Shell, Exxon and Chevron with board seat going to green activists. Energy stocks have done poorly. Last week saw a very acrimonious senate hearing with big banks with Elizabeth Warren ripping into them. The Dems are not a fan of big banks. Also we have seen some sticker shock weakness in some areas as commodity cost pressures are hitting some manufacturers. Most of this is transitory.
What did explode higher to, IMO, kick off a new up-leg in its secular commodity bull market was Resource Value. All types of mining surged. Lithium ETF LIT was a big winner after lagging other miners for the last few months. Timber ETF (WOOD) was the only commodity industry that stumbled for obvious reasons. Gold Miners GDX held its recent gains which is very positive.
If we were seeing a major shift from Value to Growth, I wouldn’t expect this extreme strength in Resource Value.
The other incredible thing that happened last week was Defensive sectors plunged in relative performance. The Low Vol ETF, Utility ETF and Staples gave back all the performance gains they had seen recently. When they were doing better, it worried me that the market was setting up for a dip and bonds an uptick. But now that the Defensives are stumbling, it tells me we are starting a new Value driven leg higher and bonds could take a leg down to continue their bear market.
I expect big, surprising employment gains early in June to worry bond investors and also the size of the Budget is mind-blowing. Home prices are soaring and that leads to a growing sense of inflation even if the Inflation Index is tame. And how can you trust a government calculated inflation index that has Home Price inflation at 2.1% YOY (equivalent rent I know) when home prices are up over 12%. Whatever the stats say, people are FEELING inflation.
Based on what you have written here, would Bond yields have reason to go up in the near term (say one year horizon), inflation remaining stable or simply being ignored by the Fed.
I believe that in the short run, Fedspeak about tapering is designed to keep a lid on inflation expectations. Beyond six months, we’ll have to see if the price pressures are indeed transitory.
If they’re not, then bond yields will have to rise.
We’ll just have to watch how the data develops.
Biden continues to enact legislation to reduce income inequality and promote social justice. He favors unions to bolster the bargaining power of working-class Americans. Many companies have already raised the minimum wages. These wage-related cost pressures (at lower income levels) will prove to be stickier. Once up, wages for permanent employees rarely go down. All of these additional dollars are also likely to be spent in purchasing goods and services raising overall demand.
I think in view of the widespread shortages we are witnessing in many industries, the businesses will move away from just-in-time inventory to holding a larger inventory of their inputs, and building a resilient and redundant supply-chain. That should also increase the amount of capital they need to invest in their inventory and capex to diversify and in-source their supply chains – raising the cost of doing business which they have to pass onto their customers.
On the other hand, the technology – driven by automation, AL and machine learning – and globalization will continue to be deflationary.
Looks like the prices of goods will continue to drift lower while the prices of services will rise upwards?
What’s the net effect on inflation six months down the road? I guess we’ll wait for the data.
The chart of 10 year rates is misleading. It shows a rise from extreme low rates last year and then going sideways at a high level. The picture looks like a downswing is more likely.
If we had a long term chart let’s say back to 3% rates in 2018, the current picture would be a rise from a 2020 extreme low with a sideways consolidation now before the next leg higher in rates. The consolidation would appear sufficient for the next leg up to start. That is the economic narrative I see occurring over the next year and the breakout to the upside is now.
My bet is we see 2.25% before we see 1.25% or even 1.5% by Independence Day. That means momentum trends persist favoring Value, loving Resource Value and disliking Regular Growth while hating Innovative Growth. This starts now. Never let it be said I’m not willing to take a clear position.
Last week Bloomberg ran a piece which contains a graph indicating that 50% of the rise in resources investing inflow is due to speculation. The rest is real supply and demand. I think it is legitimate seeing the degree of speculation in meme stocks and cryptos. If we examine all the mining stocks price charts of say the last 5 years, then we should at least question why such a huge price increase in such a short period of time recently.
Yes there is an inflation factor because of money supply increase. Yes there is supply bottlenecks. Yes there is front running of Biden budget plan. But it just looks way over the top. How much better than 2019? It does not look sustainable.
Then a cursory look at M1/M2 velocity should tell us there is no way it is going to be a gangbuster. It should have a rebound in velocity to reflect the pent-up demand being met. And then it will resume the secular decline representing an uninspiring GDP growth. No matter what we do just the fact that there is so much debt will immediately put a very low ceiling on long-term rates. Maybe it will be OK. Treasury Dept can always sell to the only buyer who has an infinite supply of digital printing ink.
In the meantime, join the bubbles. Follow the narratives. Make money and get out TOO EARLY.
Nothing goes straight up or down. I am making a case for a tactical pause of 2-3 weeks where growth>value.
An interesting post, thoughts, and bold forecasts. Time will sort out the winners and losers. My travel and interactions since early April through NY and upper Midwest have been interesting. Vaccinated people are somewhat more cautious than non vaccinated people. Still wearing masks, dining outdoors more than indoors. People have money. But not rushing out to spend it immediately. A friend who is an executive at a major airline doesn’t expect travel to return to prepandemic level till late 2022.
The ‘pent up demand’ may trickle out more slowly than anticipated giving time for bottlenecks to get resolved.
I am beginning to think that inflation is transitory and bond yields may consolidate.
Resource stocks – there are three metals that have a longer term tailwinds. Cobalt, lithium and copper. Used in batteries, EV, and wind turbines. This is a mega macro trend for the coming decade. Play the momentum game or stay invested. I am doing the latter.