Preface: Explaining our market timing models
We maintain several market timing models, each with differing time horizons. The “Ultimate Market Timing Model” is a long-term market timing model based on the research outlined in our post, Building the ultimate market timing model. This model tends to generate only a handful of signals each decade.
The Trend Asset Allocation Model is an asset allocation model that applies trend following principles based on the inputs of global stock and commodity price. This model has a shorter time horizon and tends to turn over about 4-6 times a year. The performance and full details of a model portfolio based on the out-of-sample signals of the Trend Model can be found here.

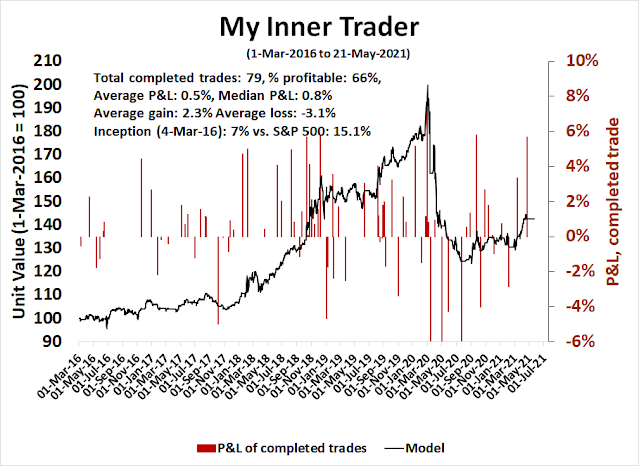
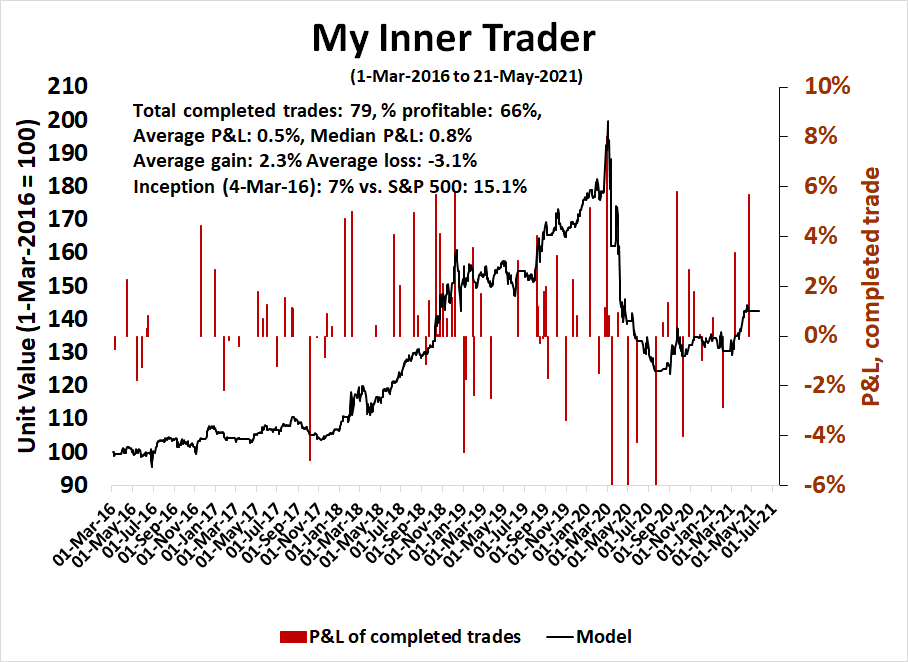
My inner trader uses a trading model, which is a blend of price momentum (is the Trend Model becoming more bullish, or bearish?) and overbought/oversold extremes (don’t buy if the trend is overbought, and vice versa). Subscribers receive real-time alerts of model changes, and a hypothetical trading record of the email alerts is updated weekly here. The hypothetical trading record of the trading model of the real-time alerts that began in March 2016 is shown below.
The latest signals of each model are as follows:
- Ultimate market timing model: Buy equities
- Trend Model signal: Bullish
- Trading model: Bullish
Update schedule: I generally update model readings on my site on weekends and tweet mid-week observations at @humblestudent. Subscribers receive real-time alerts of trading model changes, and a hypothetical trading record of those email alerts is shown here.
Subscribers can access the latest signal in real-time here.
A slow-motion pullback
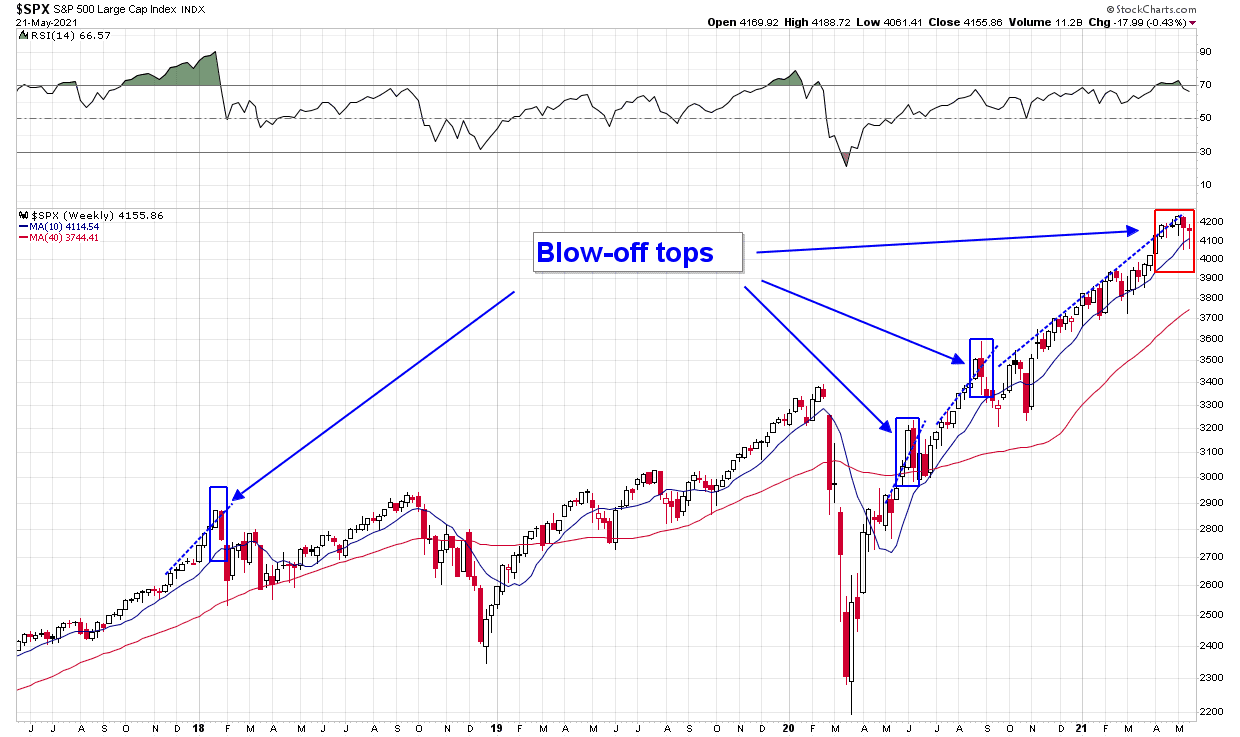
I have been writing about the possibility of a blow-off top ever since the S&P 500 rose above its rising trend line (see A blow-off top ahead?). In the past, blow-off top episodes were characterized by a spike upwards in one week, followed by a precipitous drop the next week.
This time, the S&P 500 experienced a slow-motion pullback as it visited the site of the 50 dma during two consecutive weeks.
Is the pullback over?
The bull case
Here is the bull case. The S&P 500 ticked off all of my bottoming model criteria, except for a lack of fear as measured by the term structure of the VIX. Is that enough for a bottom?

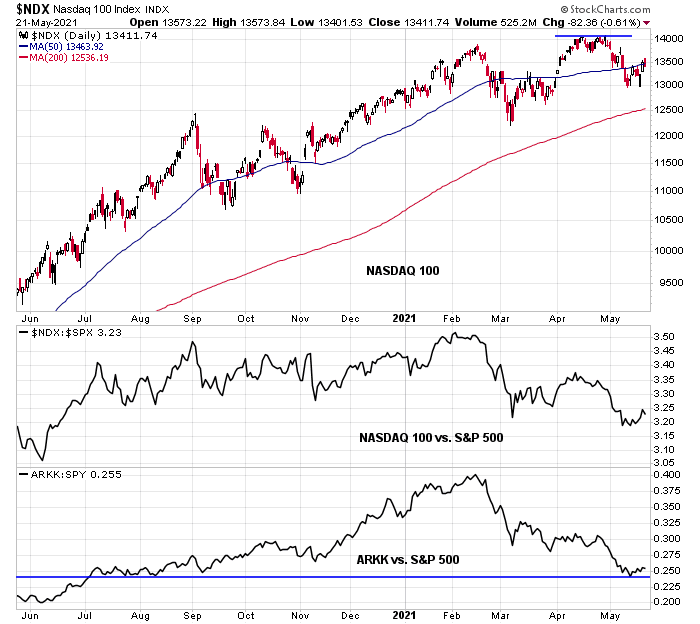
The NASDAQ 100, which was one of the worst-hit parts of the market, exhibited a positive RSI divergence. It has since rebounded and trying to regain its 50 dma. As well, the high-octane ARK Innovation ETF bounced off a relative support level against the S&P 500 and it recovering.
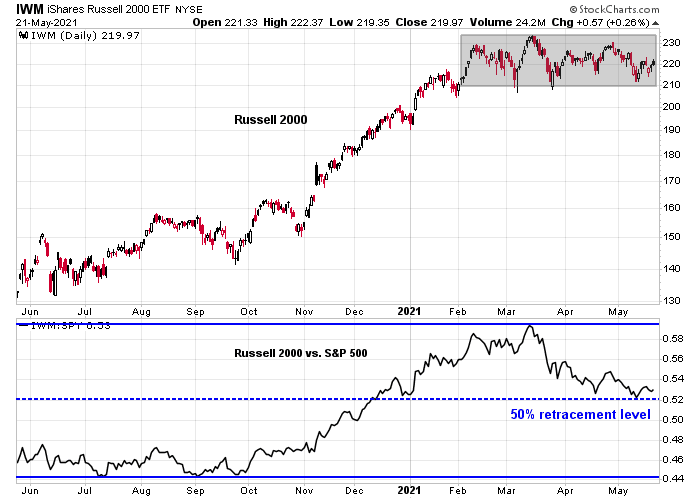
The small-cap Russell 2000 has been mired in a trading range, but its relative performance against the S&P 500 bounced off a 50% retracement level. I interpret that as a constructive sign for this high-beta portion of the market.
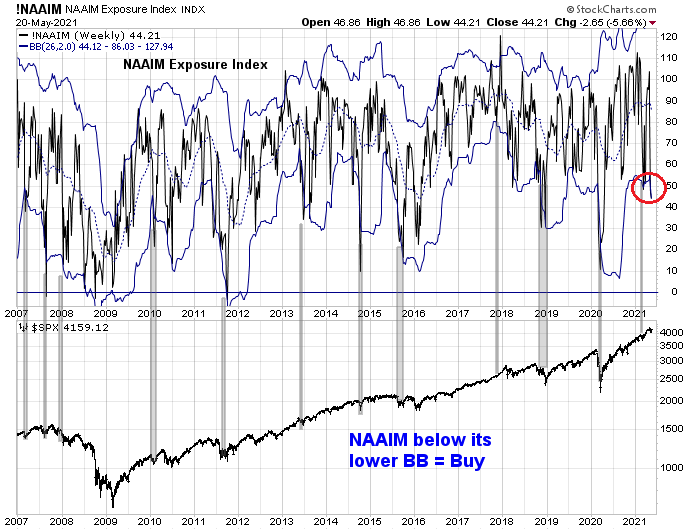
The market is also on a NAAIM buy signal. The NAAIM Exposure Index measures the opinions of RIAs who manage individual clients’ portfolios. In the past, a decline of this index below its 26-week Bollinger Band has been a reliable buy signal that indicates low downside risk.
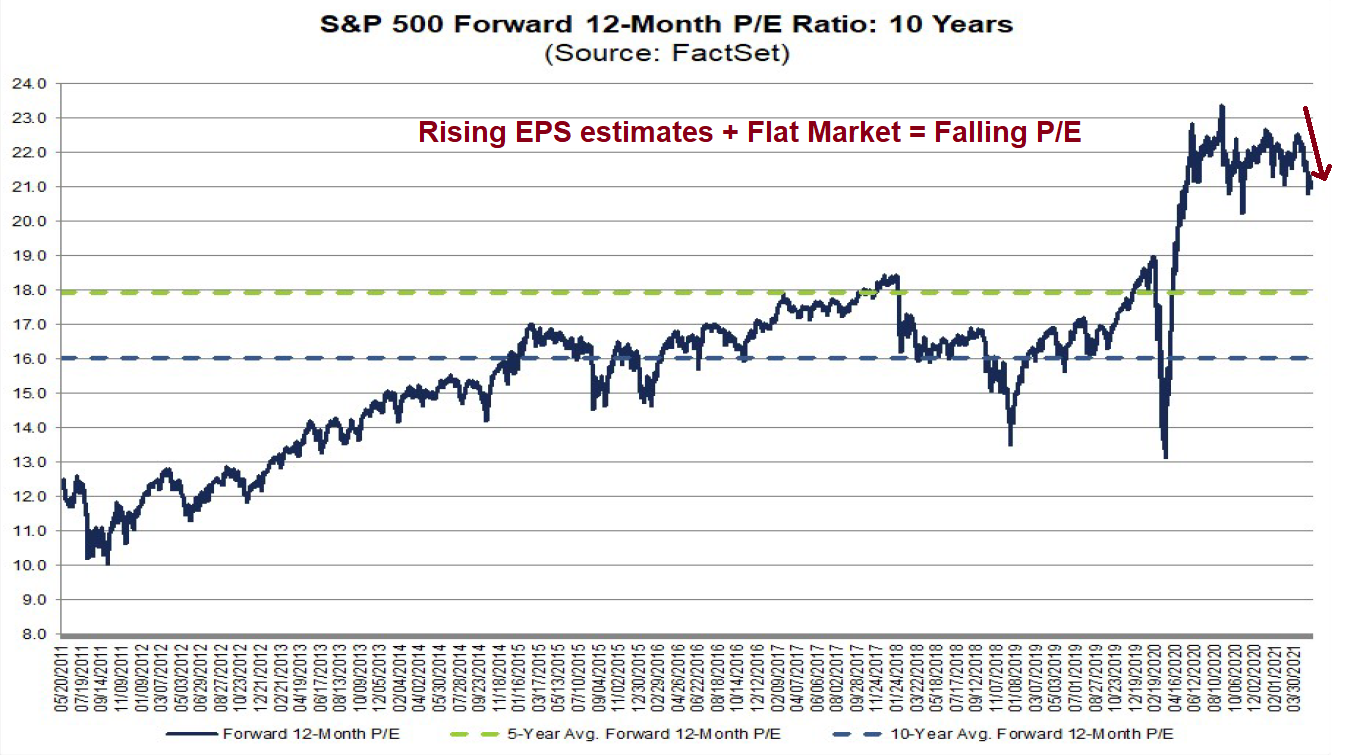
From a fundamental perspective, earnings estimates have been surging as an indication of fundamental momentum. Everything else being equal, rising estimates translates to lower forward P/E ratios and more attractive valuations.
The bear case
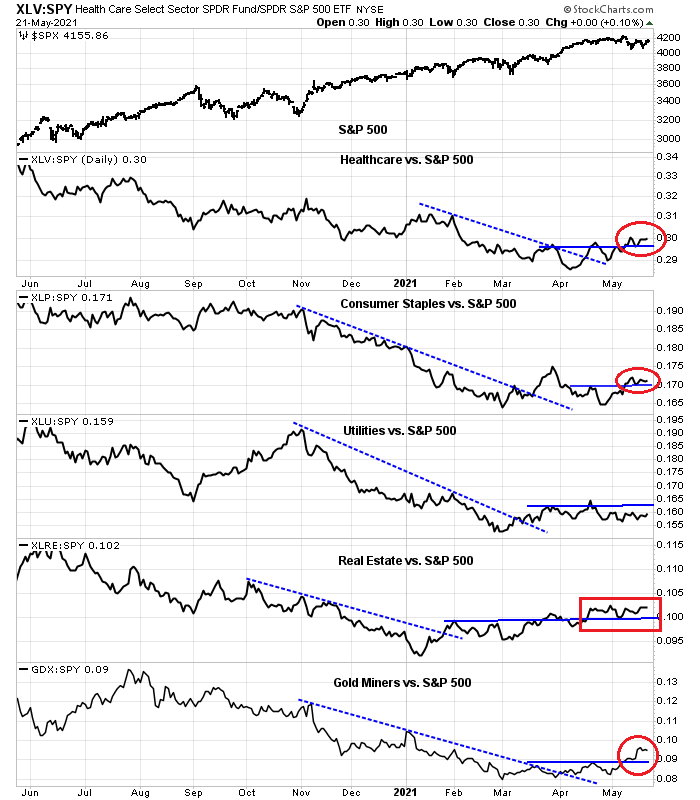
On the other hand, the bears also have a case for unfinished business to the downside. Despite the stock market rally, the relative performance of most defensive sectors remain above their relative support levels. This is an indication that the bears haven’t lost control of the tape.
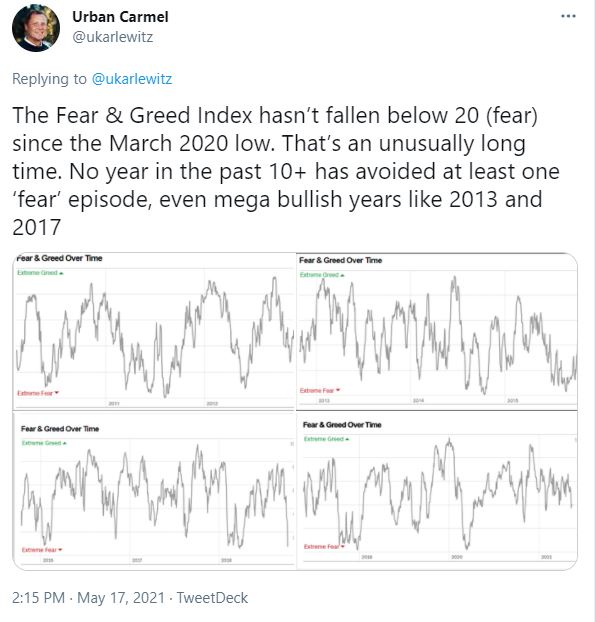
Urban Carmel pointed out that the market is overdue for a pullback and fear spike. The Fear & Greed Index hasn’t fallen below 20 since the March 2020 low, which is an unusual condition.
As well, J.C. Parets recently contrasted the somber tone of the New Yorker cover from March 2020 at the time of the market bottom, to the optimistic tone of the latest cover. If the first cover represented a contrarian buy signal, does this mean the May 24, 2021 cover is a contrarian sell signal?

The verdict
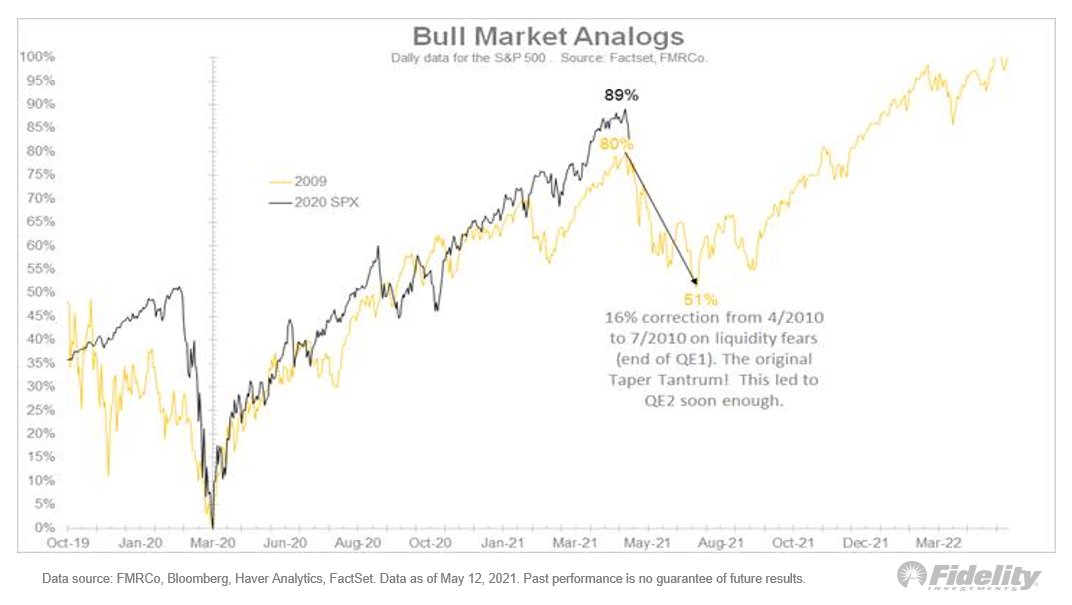
What’s the verdict, bull or bear? Jurrien Timmer at Fidelity has compared the trajectory of the stock market recovery to the market surge in the wake of the 2009 bottom. If the market were to follow the same path, the S&P 500 is due for a 16% correction.
Bear in mind, however, that history doesn’t repeat itself. It just rhymes. There is no doubt that the market is due for a pause, but the inconclusive nature of the bull and bear debate leads me to believe that investors are due for a period of choppiness in the coming weeks and possibly months.
My base case scenario calls for a range-bound market. Tactically, the market was oversold and it was due for a relief rally. I am open to the possibility that the market could test the old highs and make marginal new highs. I would monitor these bullish tripwires as signals that the bulls have regained control of the tape:
- A wholesale violation of relative support by the defensive sectors of the market.
- The VIX Index decisively falls through its 20 dma, which would be a signal of bullish momentum.
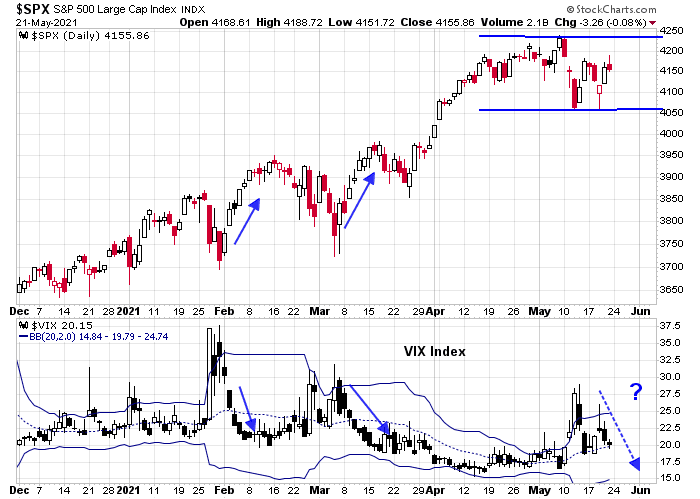
On the other hand, if the VIX maintains support at its 20 dma, expect a sideways choppy market and a possible retest of the S&P 500 50 dma.
Disclosure: Long SPXL
Dear Cam: what is your take on commodities? If commodities have a positive trend in 1 to 2 years, it should impact emerging markets stocks. The question refers to yesterdays´ post.
The S&P 500 has been in a slow motion blow-off top but as I keep saying, under the hood we have had a massive blow-off peak and fall of Growth Factor generally and especially the crash of Innovative Growth as seen in ARK falling almost 40% from $160 to $100. Value Factor stocks have been chugging along up nicely and keeping the general S&P Index looking tame.
When I see technical analysis, I compare what happened technically to the narrative at the time. The four blow-offs Cam has shown in the first chart are a great exercise for that from a Factor analysis narrative basis. Here are my thoughts on what was happening at the times.
2018: This was a surge in positive sentiment from a weird 2017 market that was up so consistently that is had the fewest 1% daily moves ever. Positive sentiment kept building as stocks, especially Growth stocks had soared and then there was the tax-cut that sent investor optimism from high to bubbly. This was unsustainable and we had a severe correction. High Beta Factor stocks plunged most including Growth. The correction was stiff but quick and Growth got its mojo back and markets did well until the Fed raised interest rates and the last quarter of 2018 was a bear.
June 2020: Coming off the March bear low, the Reddit crowd and speculators in general jumped into the depressed Value stocks that had been murdered. This led my Value indexes to soar to the Feb. high in a flash. This was extreme amateur investing at its worst and Value stocks fell back badly and stayed down until October. But and it’s a huge BUT, growth and especially Innovative and Stay-at-Home growth stocks (FAANGs) kept rising and rising and rising. So here, if you used the “Blow-Off Top” strategy of selling the S&P 500 general market after the June 2020 top, you would have missed the great runup in Growth and ARK.
Sept 2020: This was the Blow-Off of Stay-at-Home highly weighted in the S%P 500 stocks. These have underperformed since then but there was a handoff to Value that began and accelerated hugely when the November 9, Vaccine Miracle TWIST Day arrived. Selling the Stay-at-Home winners and buying cheap Value that had gone down and then sideways from the June “Blow-off” was better than just avoiding the general market again after a Blow-Off.
Current Blow-Off: This is a top in the bubble of Innovative Growth, SPACs and possibly even Crypto. The weakness is spreading to other Growth Factor areas especially in popular technology names that have solid earnings rather than a concept. These good growth companies likely got caught up in the Innovative bubble and need a correction. Value is holding in well and going up and in my opinion, just like other “Blow-Off Tops” where either Growth or Value peaked while the other marched onward and upward, I expect Value to keep going as the economy reopens and continually surprises us with how profitable will be for company earnings. My suggestion is to avoid the trap of buying Innovative Growth now that it’s down and seems a bargain. There is no earnings support and it’s impossible to put the blind confidence back together now that it has been crushed. With no earnings, you only have diamond hands to take those stocks higher. Here is one caveat on Value, the Resource Value sector could easily have a sharp correction since the stocks copper miners to lumber and agriculture have gone parabolic. I expect them to be much higher in future but they could rattle our nerves for a few weeks.
Ken, what you have written here reminds me of mini version of year 2000, when tech blew up, everything else blew up less!
What bothers me is that the market has been going up for 12 years, so unless one looks at really long term charts there is an inherent bias in all the technical and momentum indicators. So for now these things might work, until of course they don’t work. Isn’t that a saying?
It’s never really different, because human nature takes eons to change, but when has the government sent out trillions of dollars to the general public?
I think that for many things like lumber or copper there truly was a drop in supply (either getting the resource, processing or delivering because of lockdowns) and this led to a rise in prices. How long will this last?
When things open up, what will we see?
Maybe what we are seeing is reflecting a loss of faith in fiat currencies and so money is moving to where future value and utility will be found. If this is true then the market will go up for years. During the German hyperinflation, the stock market did well until the currency stabilized, but now we have global fiat currencies being printed, so this could last a lot longer than what happened in Germany.
As an aside, what has impressed me is how they have managed to keep the price of GameStop so high. How come it hasn’t crashed back to where is started from? They say that bubbles pop and quickly retrace, so was GameStop not a bubble? Or is it going higher because there are still shorts trapped? Maybe it’s time to look at some insanely out of the money calls, after all, if bitcoin can go to the moon, why not GameStop? Look at the daily chart, one can argue there is a cup and handle. I know that GME in the 1000s is insane, but if there is a belief that deep pocket shorts are trapped and will be forced to capitulate, there could be herding. I don’t own GME, never have, never will, but I am eying the chart and would consider some calls if a breakout should appear imminent. Prices are insane though
I think there are a lot of mini bubbles. Pump and dump Reddit driven stocks like GameStop. Crypto. A
I don’t think the overall market is yet in bubble territory. I think a lot of people are looking for them and thus they are “there”.
While comparisons to Germany are hyperbole in my opinion, there is a dark swan event in taking borrowing so far that our reserve currency status becomes jeopardized. But what is the real probability of that? Extremely low because there are no real viable alternatives.
What is most key in my mind is what are we getting for our money? What is the real return on those investments. And are they investments or giveaways? That is the discussion to be having.
That is just my point. There is a good review on Weimar Germany and it points out how not only was there this huge war reparations cost, there was an import duty that was awful. Basically impossible to get out from under, and the German currency was not a world reserve currency.
What we have now is the dollar, the euro, the renminbi and others are being printed, so there is no alternative.
I find it striking that gold has gone nowhere from it’s 2011 peak, why? Maybe bitcoin has drawn off money that would have gone into gold? Gold is not all that useful, the stockpile of gold for industrial and jewel crafting purposes can last a lifetime or 2. So aside from the manic pouring of money into cryptos and SPACs and whatnot, where can money be placed? So if investors are quietly placing money in stocks or commodities that are useful and have limited stockpiles because the thinking is that the fiat printing will continue indefinitely, it makes sense that the market is not overpriced. In the past if inflation went above 2% the market did not do well, but in those days rates would rise, and the market would eventually go up when that inflation had worked through the system, only now I think that they are looking at rates being stuck or if they go up there will be massive sovereign printing, so that current stock prices adjusted for future dollars purchasing power is lower than appears to be.
No doubt there will be some serious tremors in the market on the way.
In other words QE or MMT or whatever may go on for years and years.
Look at the pension fund bailout, no doubt the first of many. Who gets punished? The companies that did not adequately fund them? Nope. So what about public pensions? Social security?
But I think that there will be serious volatility in the future, and gosh, a crash that lasts more than a month.
When that happens I want so silver positions. Silver is useful, it gets used up and is not so easy to find, unless they find silver asteroids to mine or to extract from the ocean cheaply, or we stop using electricity in which case we have bigger problems.
While it might be hard to calculate future inflation, because they play around with cpi etc, the sovereign deficits and money printing is more tangible, and if we see it just going up and up….what will stop that? You think all us greyhairs will want Soc sec and medicare stopped? I don’t think so.
If the SPX tanks and gets to 1500 or so (the top of 2007 and 2000) you know, a pullback and the monthly copoc turns up is another thing I am waiting for. I might not be alive by then lol, and it may never happen.
Right now it is not in the interest of the world powers to exercise fiscal responsibility. That will change one of these days/years, but not now.
What is a good Canadian ETF to buy? Thanks.
EWC is the MSCI Canada Index which is a great way to participate.
EWC is at the top of my country ETF momentum performance ranking and doing better than all the US indexes (NASDAQ, Russell 2000, S&P 500 and S&P 500 Equal Weight)
Closing COIN premarket.
Closing RIOT.
Paring back on QQQ/ GDX/ EEM.
Paring back on SMH/ XLK.
Reopening NIO/ QS/ PLTR/ VIAC.
Adding to PICK.
Closing ASHR/ EEM.
Closing QQQ.
Closing SMH/ XLK.
NIO off.
PLTR/ VIAC off.
Fantastic morning.
All positions off here for a +0.53% overnight gain for the portfolio.
Credit to Cam for my positioning in QQQ/ SMH/ XLK (where I booked the bulk of today’s gains).
KRE.
XLE.
Taking profits on KRE/ XLE.
Taking swings at XLE/ KRE/ PICK.
VIAC/ PLTR
Taking minor losses on all positions. Good read on the markets today.
Another swing at KRE.
Ditto on PICK.
Restarted a position in XLE as well near the close.
Plan to hold KRE/ PICK/ XLE overnight.
Adding positions after hours in NIO/ PLTR/ QS/ JETS/ VIAC.
Reopening a position in BABA after hours.
Taking premarket profits in JETS/ PLTR/ NIO.
Closing VIAC.
Closing QS.
Closing XLE/ KRE/ PICK for minor losses.
Reopening a position in COIN.
Closing COIN.
Plan A is to remain cash while awaiting the selloff I still think lies around the corner.
There is one asset class that looks attractive at current levels.
TLT.
Taking a swing @ 139.5x.
TLT off @ 139.6x.
That’s called closing a position (TLT) just in time!