Preface: Explaining our market timing models
We maintain several market timing models, each with differing time horizons. The “
Ultimate Market Timing Model” is a long-term market timing model based on the research outlined in our post,
Building the ultimate market timing model. This model tends to generate only a handful of signals each decade.
The
Trend Asset Allocation Model is an asset allocation model that applies trend following principles based on the inputs of global stock and commodity price. This model has a shorter time horizon and tends to turn over about 4-6 times a year. In essence, it seeks to answer the question, “Is the trend in the global economy expansion (bullish) or contraction (bearish)?”
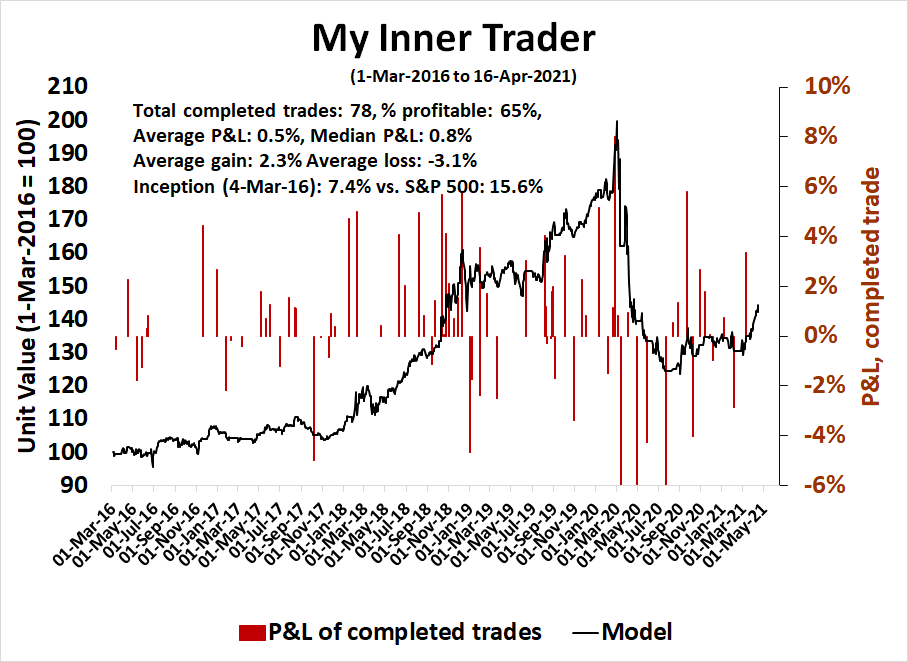
My inner trader uses a trading model, which is a blend of price momentum (is the Trend Model becoming more bullish, or bearish?) and overbought/oversold extremes (don’t buy if the trend is overbought, and vice versa). Subscribers receive real-time alerts of model changes, and a hypothetical trading record of the email alerts are updated weekly here. The hypothetical trading record of the trading model of the real-time alerts that began in March 2016 is shown below.
The latest signals of each model are as follows:
- Ultimate market timing model: Buy equities
- Trend Model signal: Bullish
- Trading model: Bullish
Update schedule: I generally update model readings on my site on weekends and tweet mid-week observations at @humblestudent. Subscribers receive real-time alerts of trading model changes, and a hypothetical trading record of those email alerts is shown here.
Subscribers can access the latest signal in real-time here.
Setting up for a blow-off top
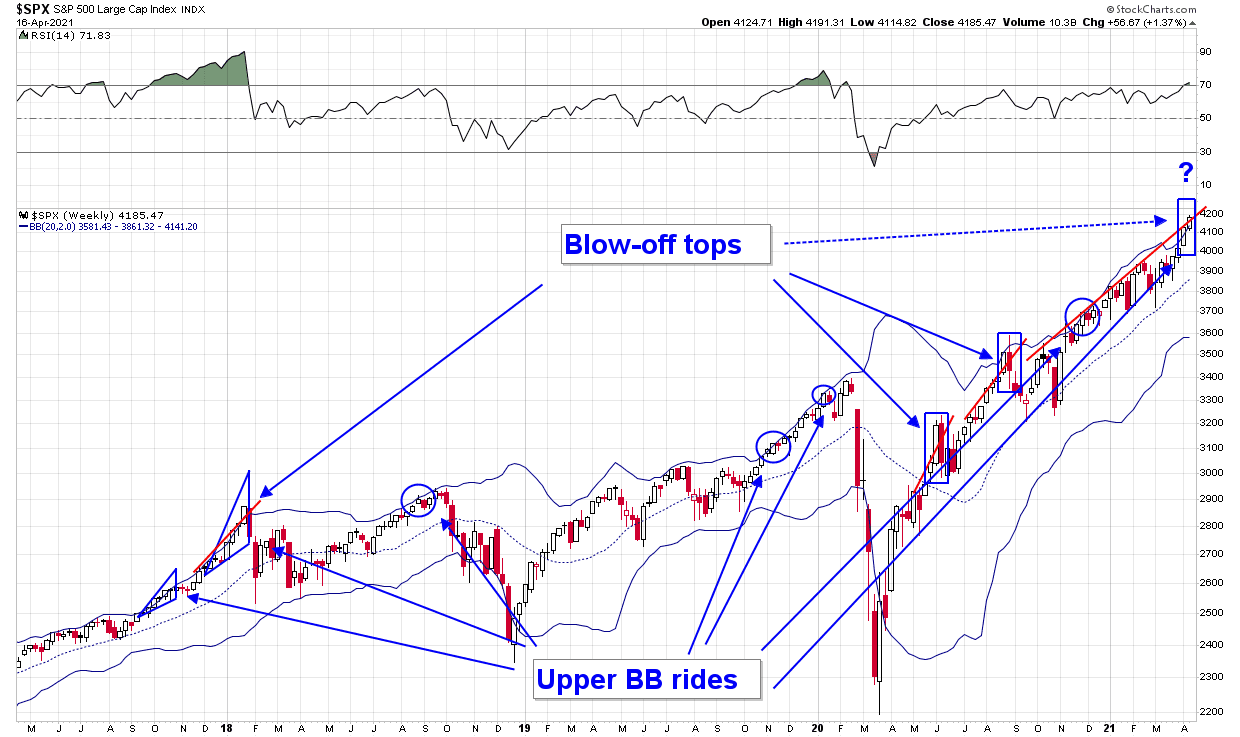
The S&P 500 has been rising steadily since late February. As the stock market advanced, readings became increasingly overbought. The S&P 500 has spent two consecutive weeks above its weekly Bollinger Band (BB). Past upper BB episodes have tended to be signals of positive momentum. that led to further gains. The market spent several months on an upper BB ride in late 2017 and early 2018 before it finally topped out.

It appears the S&P 500 is undergoing another melt-up, with a blow-off top ahead. In the last four years, overruns of a rising trend line have been signals of an imminent blow-off top that lasts no more than two weeks.
A closeup look at the S&P 500 daily chart shows more details. The index has overrun rising trend line resistance, which happened twice since the March low. The market topped out after prices went parabolic within a week of the overruns.
Sentiment not stretched
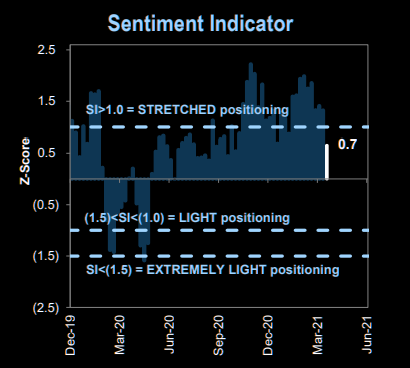
While the recent historical evidence points to a market top in the middle of next week, the rally could run a little further because a number of key sentiment models are not overly stretched. In particular, the Goldman Sentiment Indicator, which measures positioning instead of just opinion, took a step back from “stretched” territory indicating further room for equities to advance.
Time for a pause?
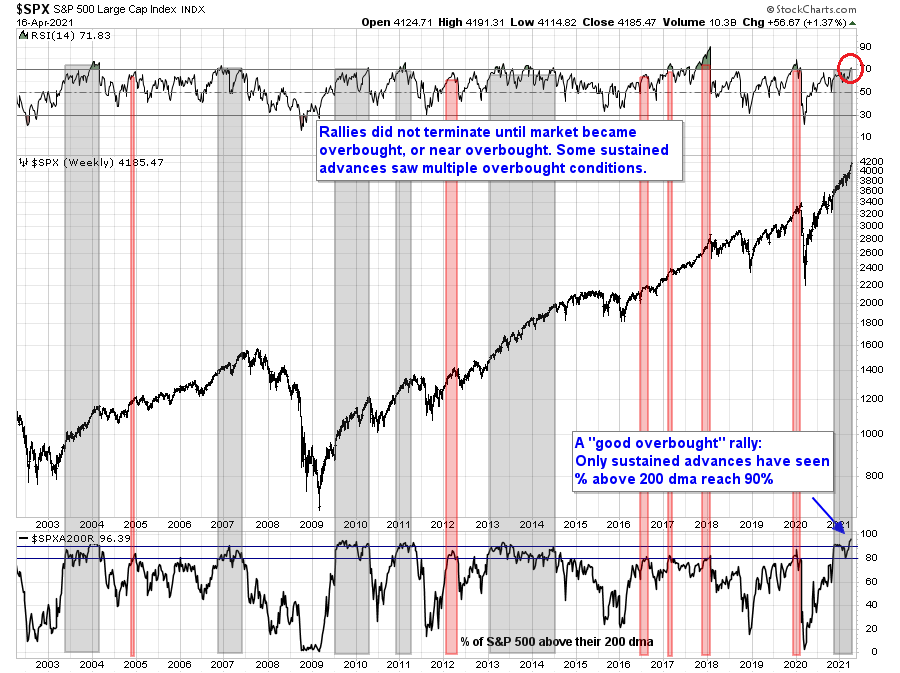
The big picture points to a temporary pause in the advance. I have highlighted this analysis in the past. The percentage of S&P 500 stocks above their 200 dma is well over 90%, and such readings have been “good overbought” signals that resolved in steady multi-week advances. The rallies usually did not pause or terminate until the 14-week RSI cross the 70 overbought level, which it did last week.

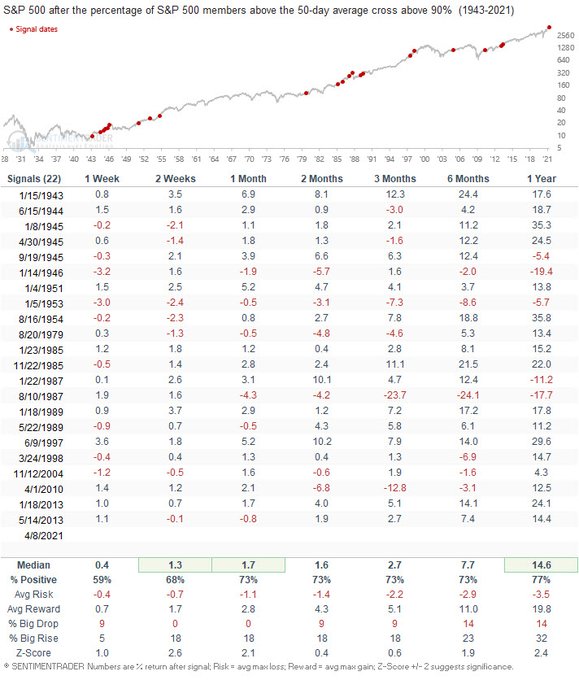
As for the timing of a top, my working hypothesis is the next one or two weeks. Technical analyst
Dean Christians recently pointed out that “the percentage of S&P 500 members trading above their respective 50-day moving average registered an overbought momentum buy signal on the close of trading on 4/8/21. The table below contains all signals that occurred at a 252-day.” As this signal was triggered on April 8, 2021, the historical study (n=22) shows that returns peak out between two weeks and a month after the signal. If history is any guide, this puts the timing of a peak sometime in late April or early May.
A rotation update
- An opportunity to lighten up on growth stocks;
- An opportunity to buy into value stocks;
- A bond market rally; and
- A possible bullish setup for gold and gold stocks.
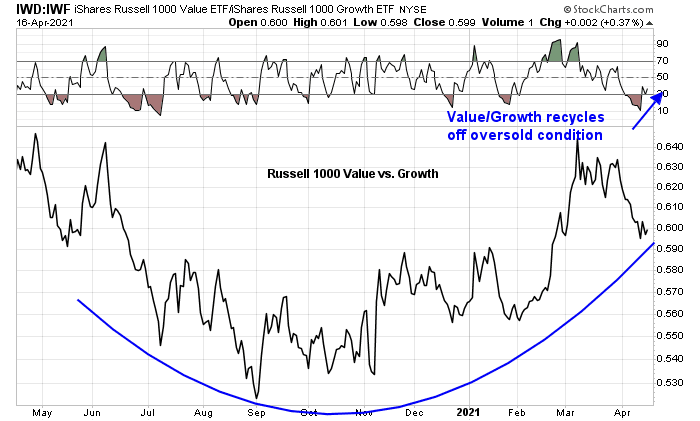
Those setups have generally worked well. First, I had pointed out that value stocks had become severely oversold against growth stocks and due for a rebound. The value/growth ratio has recycled off an oversold reading and value appears to be headed for renewed leadership after several weeks of relative weakness.

I also observed that the bond market was poised for a rally, and bond price duly rebounded. You can tell the character of a market by the way it responds to news. Last Thursday, initial jobless claims dropped by an astounding -193,000, blowout prints in retail sales, NY Empire Manufacturing, and Philly Fed Manufacturing. The market reaction was a decline in the 10-year Treasury yield. Bond yields appear to be ready to fall and prices appear to be ready to rise. The risk is this is just a countertrend move and yields are tracing out bull flags they way they did in the last few months.
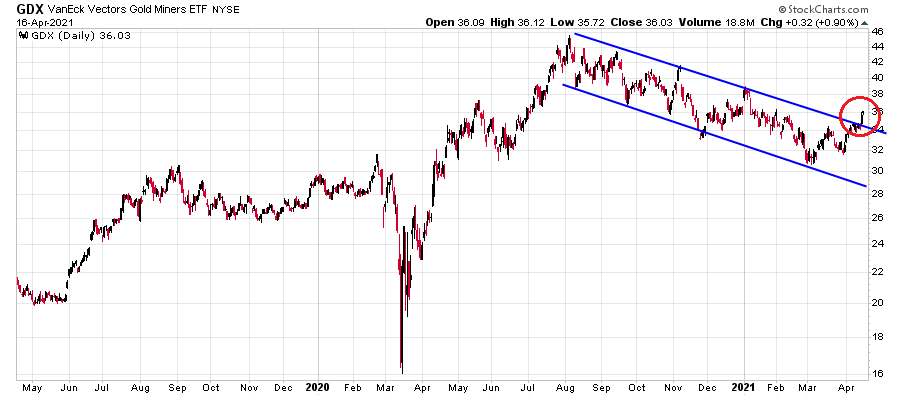
Lastly, I had highlighted a bull flag in gold mining stocks (GDX). GDX staged an upside breakout from the bull flag – a buy signal.
Waiting for the top
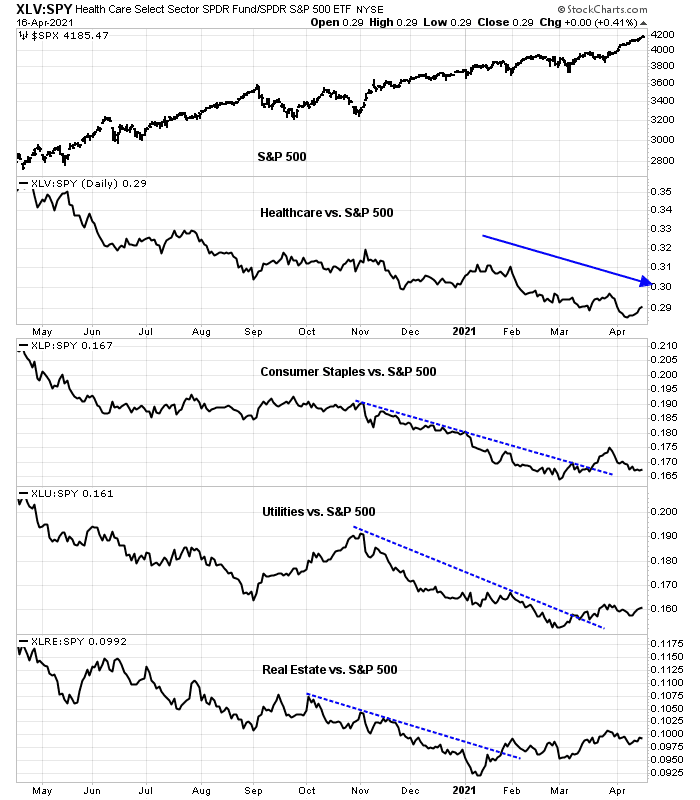
My base case scenario calls for a possible buying frenzy that traders should sell into. There is no need to panic just yet. The relative strength of defensive sectors have mostly bottomed out and they are trading sideways. However, none have begun relative uptrends that would be cautionary signals.
Despite my caution, I expect any weakness to be no more than 5-10%. This is still a bull market. Both the Dow Jones Industrials and Transports have achieved fresh all-time highs, which are classic Dow Theory buy signals indicating the long-term trend is up.
Investors should view any weakness as buying opportunities. Traders should be positioned for a possible blow-off top, followed by a sharp pullback of no more than 5-10%.
Disclosure: Long IJS


I am seeing the same thing in my Factor research. Low Volatility has been catching up to the other three emotional Factors, Growth, Small Cap and Value. You can see this also in the Utility Index leading recently. This tells me professional investors are shifting defensively for the first time in this big run since the November Vaccine Twist day.
Most investors are watching the FAANGs having a rebound for risk-on rather than this possibly more important ‘caution-on’ shift.
If we were going to have a longer term shift to Growth, I would have expected the Innovative Growth area to surge after being in the doghouse for a month. But no, since the Growth relative low on March 4th, the ARK types have actually lagged. A sign, this blow-off top may be a continuation of the bubble-unwinding in these stocks that may have started. I will say that I’s not a luddite that thinks these amazing companies MUST fall. The pandemic has accelerated many changes and Cathy Wood might be right. If my momentum studies support a renewed run, I’ll be there. It’s just not happening.
The background big picture is still not showing a Factor or Big Picture top with a bear market to follow. Junk spreads are low and not rising. A minor 5% correction may happen at anytime. I’d be surprised with Value sectors that they would have a 10% dip from here. The fragile ones like Energy have already done much more than that and are more likely going to go up than down.
The basic growth stocks, as calculated in the equal weight Growth index I’ve constructed are starting to separate from the Innovative Growth component. They are rising in a sedate, non-blow-off manner.
China has entered a bear market Factor profile. This is weighing on the regional Far East emerging stock markets while at the same time India and Brazil are having a pandemic inspired dip. Will this weakness spread to the developed markets (North America/Europe) where vaccines are racing them bullishly to herd immunity? Key question.
Cam-
Your working hypothesis of a 1-2 week advance followed by a decline overlaps with Helene Meisler’s view of a decline beginning in late April – how one plays a blow-off top probably comes down to risk tolerance.
Gold/miners and bonds. Yes, it was your April 11 post that gave me the confidence to take trades in both last Wednesday. The only reason I exited both positions on Thursday was the outsized one-day moves – I’ll be looking for reentry points.
Looks like it may be best to avoid emerging markets/China in favor of more promising returns elsewhere, and I might consider replacing what have been reflexive trades in EEM/FXI/ASHR with trades in GDX/RYPMX/RYGBX instead.
Re ‘renewable electrification and EV adoption-‘ I am usually one of the last consumers to switch to new technology. My wife spent several months last year researching both, and we’re taking the plunge this year – she made a convincing case based the amounts we will save on utility bills/fuel purchases + the fact that tax credits/rebates will soon diminish/expire.
By the way, for those of you in the market for an EV – Tesla isn’t necessarily your best option. Test drive an Audi e-tron. The overall construction of the vehicle/ attention to details are superior to that in a Tesla, and don’t let the sticker price deter you – tax credits/rebates will easily take 15-17k off the MRSP. Many of the same rebates will no longer be available on a Tesla.
How does Audi self driving compare with Tesla?
You know that there are no self-driving cars, don’t you?
I have a friend who is a much sought after AI expert and he tells me that there are many hurdles before we get to a fully autonomous vehicle.
Yes, sure, agree, self driving is a misnomer. Having said that, Tesla gets pretty close FWIW.
I think we should stop using the term “AI” just to avoid being looked at as fools. Everyone from any good robotics, computer vision, pattern recognition graduate program the last 20 years would agree. In fact just about any layman with a basic level of cognitive skills (which AI does not possess) would be able to understand that.
Let’s set aside discussing the complexity of hardware/software required for self-driving. There are two things immediately rendering self-driving cars an albatross.
1. Pricing. Perhaps a few very rich folks can afford it.
2. Insurance. No underwriters, no business.
We made the same distinction to our son, who is in the market for a Tesla. Their so-called Autopilot option is an advanced driver assistance program, not a true driverless system.
I have no interest in Autopilot, as I enjoy driving and based on anecdotal reports would never cede control of the driving experience to a software program. I would definitely be among the last consumers to adopt something like that.
https://www.marketwatch.com/investing/fund/cowz/holdings
Interesting value ETF.
Their top two holdings are VIAC and DISCA!
For gold positions, is it better to accumulate GLD or GDX or both?
If both, in what proportion? Thanks.
GDX as it had the breakout
Thanks. Is price of GDX usually correlated to GLD??
GDX is the turbo-charged version of GLD, for more or less the same reason(s) PICK would outperform the prices of the underlying metals->parabolic rises in profit margins. Mining costs are fixed. Any price increases in the material(s) being mined go straight to the bottom line.
You might see even better returns with GDXJ (junior miners), but of course the volatility cuts both ways.
Junior silver miners (SILJ) may outperform even junior gold miners (GDXJ).
https://cryptonews.net/en/551746/
I don’t know how BTC traders get any sleep.
I’m interested in investing in a nickel miner. Any recommendation?
Bloomberg Analysis of infrastructure package:
https://www.bloomberg.com/professional/blog/u-s-infrastructure-package-industry-impact-report/?utm_medium=social&cmpid%3D=socialflow-twitter-economics&utm_content=economics&utm_campaign=socialflow-organic&utm_source=twitter
Which trade would make more sense to profit from the potential pullback?
A SPY put option or VXX call (both with late May expiration)?
I’d buy the SPY put if you are so inclined. Don’t get too cute with derivatives.
Roger that.
I am a pure retail investor, but I have a rather large amount committed in the market. Could you give me a suggestion of where to go to get familiar with puts in general and the math of puts and calls.
Thanks,
RAS
As a start, try:
https://www.investopedia.com/options-basics-tutorial-4583012
https://www.fidelity.com/bin-public/060_www_fidelity_com/documents/Introduction_to_options_part1_Webinar.pdf
Thanks!
Using the BTC sector as a barometer of risk appetite, it appears to be risk off in early morning trading – but that’s just the kind of curve ball the market likes to throw before it takes off.
QS/ VIAC/ DISCA.
PLTR.
IQ.
GDX.
Adding to QS.
TSLA.
Closing VIAC.
Paring back on QS.
Closing GDX.
Adding to TSLA.
Opening a position in ARKK.
VTV/ XLE/ KRE here on intra-morning pullbacks.
Ditto for IJS/ XLI.
Adding back to QS.
Reopening VIAC.
JETS.
Reopening GDX.
Out of all flyers (QS/ VIAC/ DISCA/ TLSA/ ARKK) for an overall loss. Probably a good read on sentiment.
Out of ALL positions.
Taking minor losses before they turn into anything more serious. When the market is extended, my (mental) stops are tight.
Reopening QS/ PLTR. Opening NIO.
AA/ X.
GDX.
XLE/ KRE.
QQQ.
IWM.
VIAC/ DISCA.
Reopening BABA.
GDXJ.
XME.
Reopening IQ.
COIN.
Adding to VTV.
Reopening a spread of index funds at the close.
VTSAX/ RYGBX/ RYPMX/ VEMAX/ RYZAX/ RYEIX.
Cam, You highlighted the risk of China demand as the headwind to the material stocks. China’s Credit Impulse has turned down materially over the last few months, and can pose a significant threat to metal demand.
Thoughts?
http://materials-risk.com/chinas-credit-impulse-running-on-fumes/
Thanks!
That’s exactly the risk that I highlighted. So far the rest of the world are strengthening but a China slowdown is a definite short term risk.