It is said that the only free lunch in investing is diversification. That’s especially true for US-based investors in light of the elevated valuations of US equities.
With that idea in mind, let’s take a quick tour around the world to see where the opportunities are, and where they’re not. Geographically, the world is divided into three major trade blocs consisting of North America, Europe, and Asia, which is represented by Japan in the developed markets and China within emerging markets. For measurement purposes, the performance of each country or region is benchmarked to the MSCI All-Country World Index (ACWI) and returns are all measured in USD.
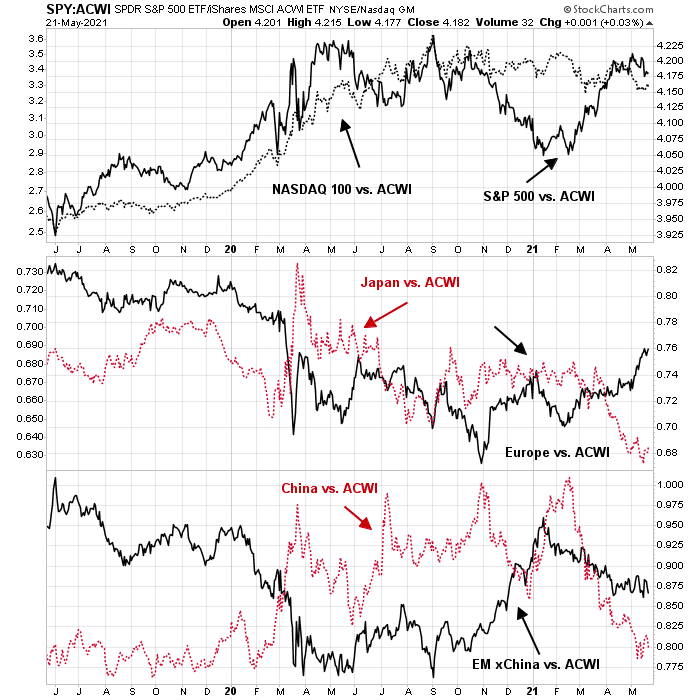
The analysis of relative performance shows that there are few clearly defined market leaders. The US has been a mixed bag. The growth-heavy NASDAQ 100 had been going nowhere against ACWI since last summer. The S&P 500 weakened against ACWI in November, recovered, but it has consolidated sideways in the last two months. Of the other regions, Japan has been weak, and so has all of the emerging markets (EM). Europe has begun to perk up in the last month.
Let’s examine each of the regions in more detail. The analysis will mainly be from a technical analysis viewpoint for price signal indications of relative changes in growth patterns and outlooks.
US: The threat from taxes
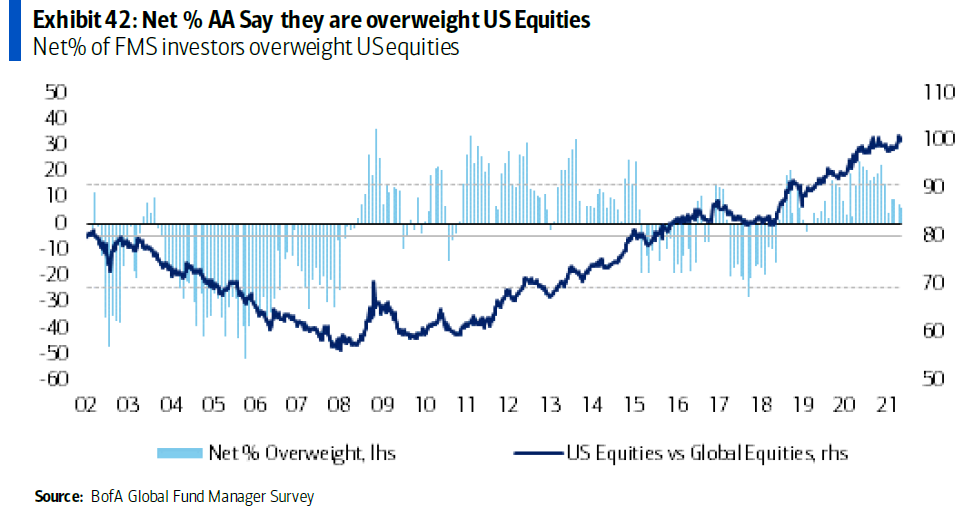
Starting with the US, the latest BoA Global Fund Manager Survey shows that managers are overweight this important region, but weights have been falling. Readings are neutral but there is a valuation overhang that threatens this market.
There is another long-term reason to be cautious on US equities: tax increases. The political consensus is turning against laissez-faire economics, and the pendulum is swinging to the left. Former Reagan staffer
Bruce Bartlett recently wrote about “trickle-up economics” as a replacement for the supply-side philosophy that took hold during the 1980s.
I believe that we are at the threshold of a fundamental change in our popular economic thought, that in the future we are going to think less about the producer and more about the consumer. Do what we may have to do to inject life into our ailing economic order, we cannot make it endure for long unless we can bring about a wiser, more equitable distribution of the national income.
As well, a
NY Times article highlighted the threat of a schism in the Republican Party to business interests. As the GOP becomes divided between the traditional Republican wing, which is losing power, and the Trump wing, which is becoming ascendant, who in Washington will speak up for companies when issues like taxes and income redistribution are discussed? Influence is slowly being draining away from the providers of capital and toward the providers of labor.
Republicans in Washington and around the country have soured on big business, joining Democrats in expressing concern that corporations wield too much influence. The shift has left corporate America with fewer allies in a tumultuous period for American society and the global economy.
The erosion of support is evident in opinion polls, on cable news and in political campaigning. It is the continued outgrowth of a populist surge among liberal and conservative Americans alike, but it is particularly pronounced on the right and often linked to the grievances of white voters on racial issues.
Republican voters nationwide have grown angry over what they perceive as unwelcome intrusions by corporate leaders into hot-button political debates, including decisions by large social media companies like Facebook and Twitter to remove former President Donald J. Trump from their platforms.
For US investors, diversification away from their home countries is becoming more and more important.
Europe: The value play
Looking across the Atlantic, Europe can be divided into two major groups, the UK and the eurozone.
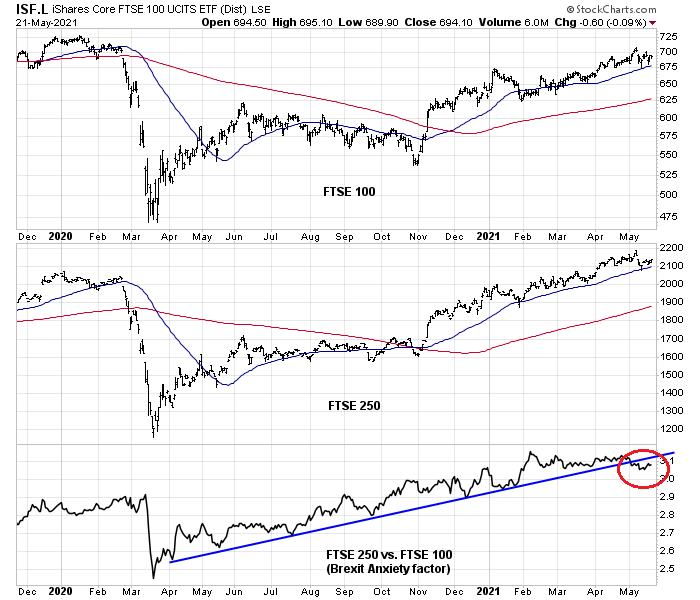
I had been bullish on the UK in the past, but recent events have made me take a more neutral view. Uncertainty is looming over the Irish question in the post-Brexit environment, which is leading to rising tension in Northern Ireland and the specter of a return of the Troubles. As well, the threat of another Scottish Referendum has the potential to tear the country apart. While both the large-cap FTSE 100 and midcap FTSE 250 are trading above their respective 50 and 200 dma, which indicates uptrends are in place, the FTSE 250 to FTSE 100 ratio has violated a rising relative uptrend and it has begun to consolidate sideways. Consequently, I am taking a more neutral view of UK equities.

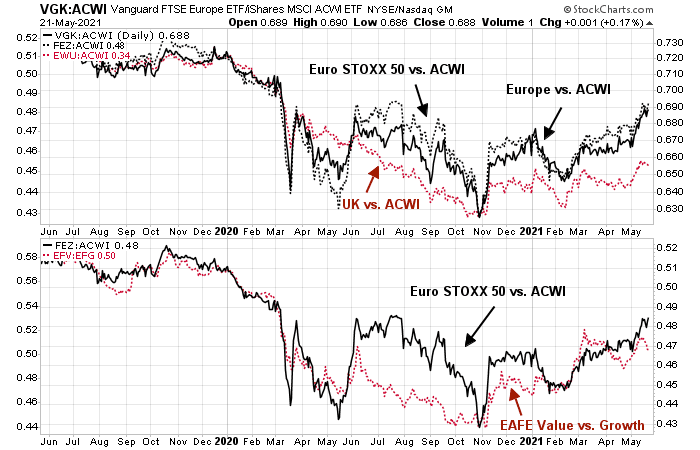
The following chart summarizes the relative performance of European equities against ACWI. Europe and the eurozone have outperformed the UK and ACWI. However, the bottom panel shows that the relative performance of the eurozone, as measured by the Euro STOXX 50, is highly correlated to the value-growth cycle of the EAFE Index. In short, buying the eurozone amounts to an explicit decision to buy value stocks.
While I am bullish on value investing as a theme, investors should be aware of their implicit exposure if they were to buy eurozone equities.
China: A decelerating economy
Turning to Asia, I have already shown that Japan, which is the largest developed market in the region, is lagging. Avoid.
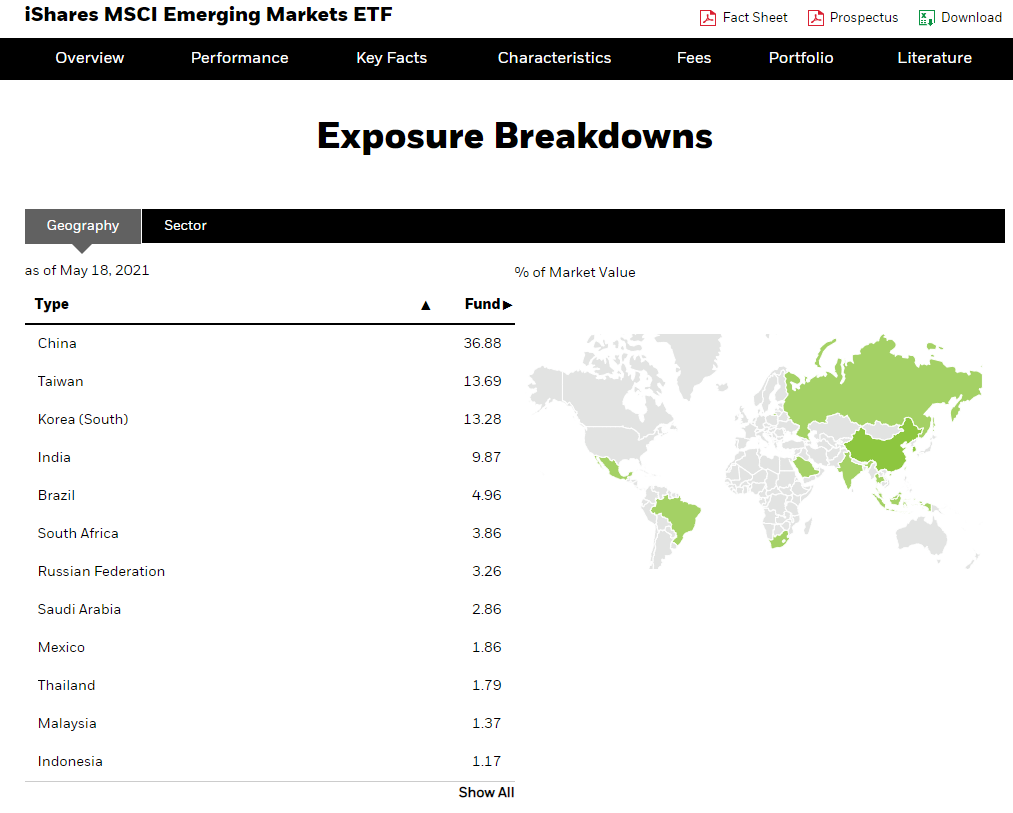
The rest of Asia is mostly weighted in EM. EM equities are mostly in Asia, with China at 38% of EM, followed by Taiwan, South Korea, and India, which make up a total of 72.7% of the index.
With China driving the outlook for Asia, the immediate outlook is cloudy. There are numerous signs that Chinese economic growth is decelerating. There is a well-documented leading relationship between credit growth, as measured by total social financing (TSF), to GDP growth. TSF is dropping quickly, which should lead to a deceleration in GDP by H2 2021.
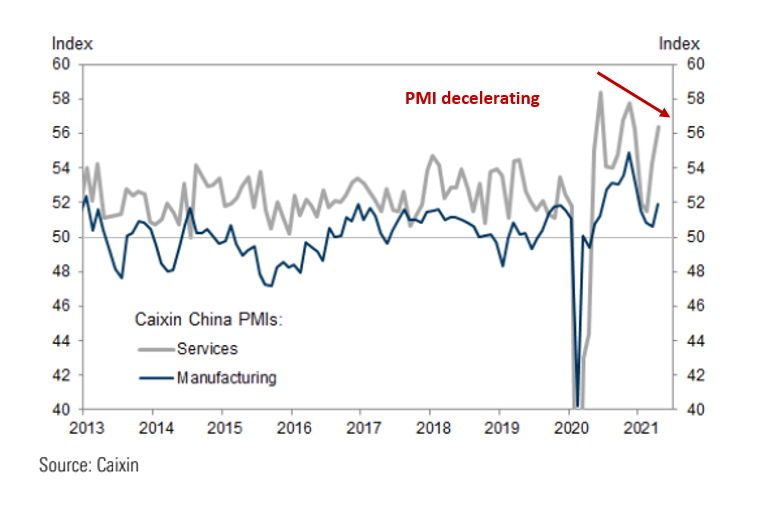
The latest release of Caixin PMI shows that both manufacturing and services PMI are above 50, indicating expansion. However, there is a trend of PMI deceleration since last summer.
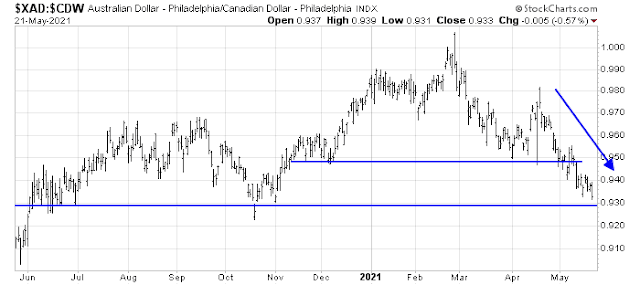
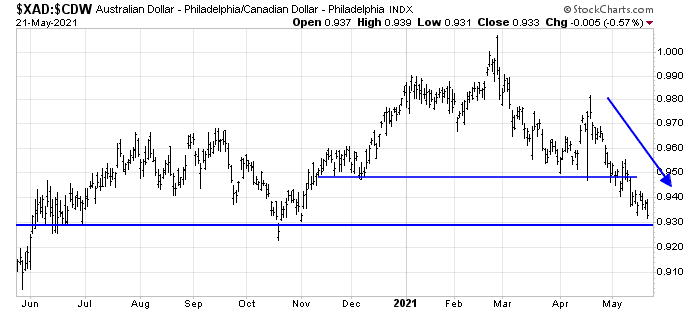
Indirect market-derived signals are equally troubling. The AUDCAD exchange rate is an important indicator of the relative economic strength between China and the US. Both Australia and Canada are major commodity exporters. Even though trade ties between Australia and China have diminished recently, Australian exports go to Asian countries that are more sensitive to the Chinese economy. By contrast, Canada’s trade is more tied to the US. The AUDCAD exchange rate has been weakening. It violated an important support level and it is now approaching secondary support.
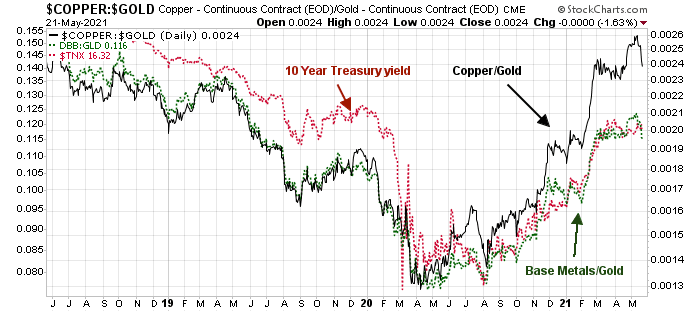
Similarly, the copper/gold and base metal/gold ratios, which are important global cyclical indicators of commodity demand, are rolling over. In response to the recent surge in commodity prices, Beijing announced that it will strengthen its management of commodity supply and demand to curb “unreasonable” increases in prices. Oil, copper, iron ore, and virtually all commodities tanked in response to the announcement.
The real estate market represents an important destination for Chinese savings. Long-time readers will know that I monitor the price-performance of the shares of major Chinese property developers, which are highly levered, for signs of stress in China’s financial system.
Bloomberg reported that Beijing is cracking down on excessive leverage through the shadow banking system by real estate companies:
A tightening of Chinese developers’ use of secretive funding is threatening to curb growth in the world’s second-largest economy.
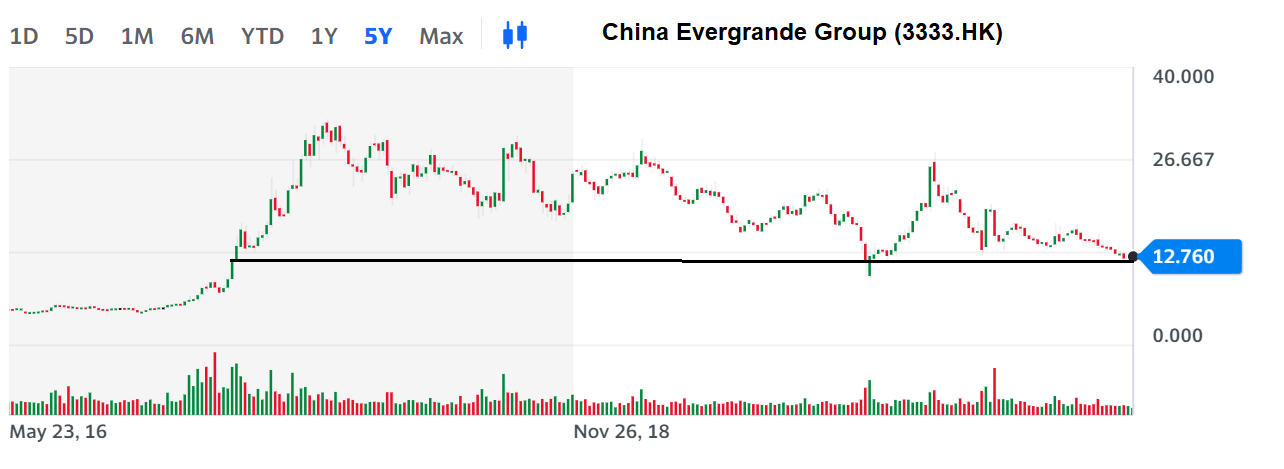
For years, China’s property developers have drawn on shadowy pools of capital to fund their projects. Now, government scrutiny is reining in that system, after already curbing traditional avenues of funding. Debt-laden developers including China Evergrande Group will likely need to scale back growth and resort to other means such as equity financing and spinning off more assets for financing to avoid defaults.
“Polarization among Chinese developers will deepen this year, and more developers are likely to suffer from debt failures,” said John Sun, co-managing partner at Aplus Partners Management Co, which focuses on private equity and credit investments. Weaker developers “will need to sell assets to fight for survival, while some will likely default on their debt.”
That hunt for new funding is adding pressure on the nation’s cash-strapped developers, which already account for nearly 27% of the more than $20 billion of missed bond payments this year, according to data compiled by Bloomberg. The constraints will dampen investment in property and the pace of construction activity, Macquarie Group’s China analyst Larry Hu predicts.
The charts of selected major developers, such as China Evergrande (3333.HK), China Vanke (2202.HK), and Country Garden Holdings (2007.HK) have all weakened to test major support levels. The good news is these stocks are holding support, which does not indicate rising stress. The bad news is the simultaneous tests of technical support may indicate an implicit PBOC put, which represents a form of intervention that masks the market signal from share prices.
Other EM: The beat of their own drummers
While investors may view EM equities as a bloc, they all have their own unique characteristics and each can march to the beat of its own drummer.
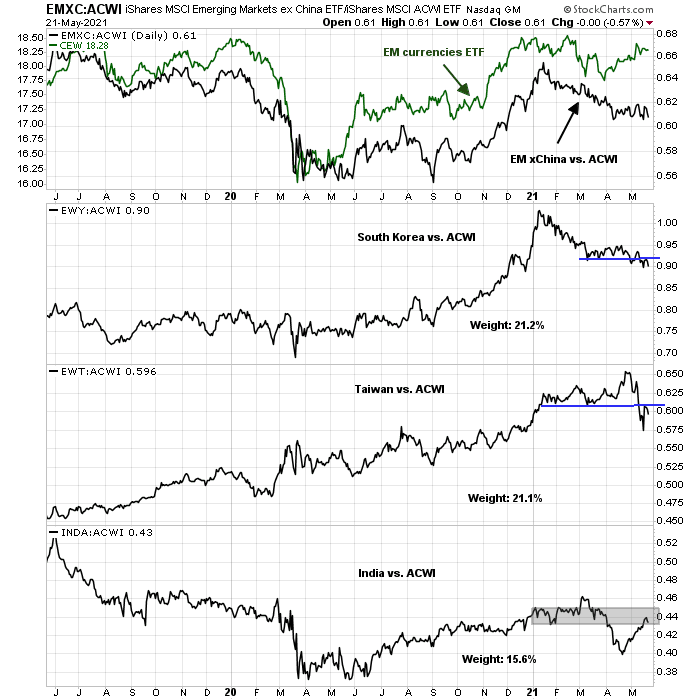
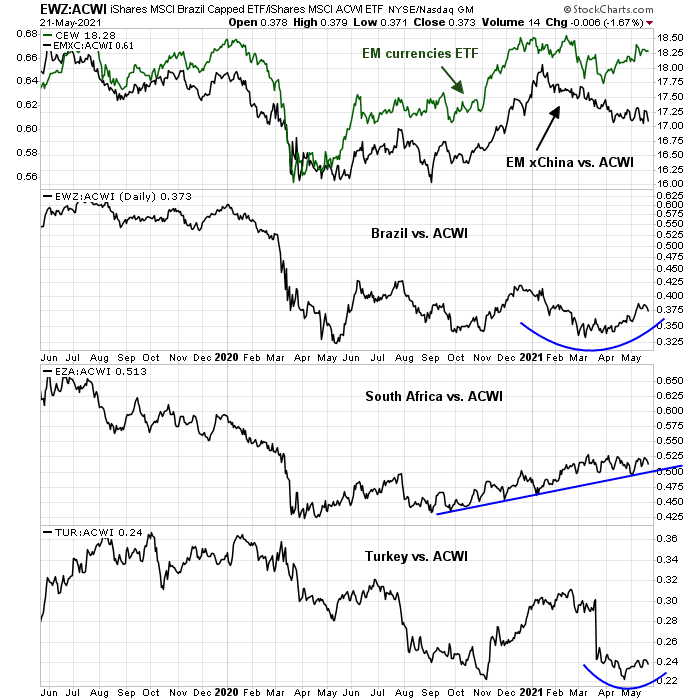
The relative performance of other major EM countries outside China is relatively unexciting. EM xChina (EMXC) has underperformed ACWI this year, and a divergence is opening between EM currencies and the relative performance of EMXC. The two largest countries in the index, South Korea and Taiwan, breached relative support levels and they are now rallying to test relative support now turned resistance. The third-largest, India, had to contend with a severe COVID-19 outbreak. The worst may be over, and Indian equities have rallied to test a relative resistance zone.
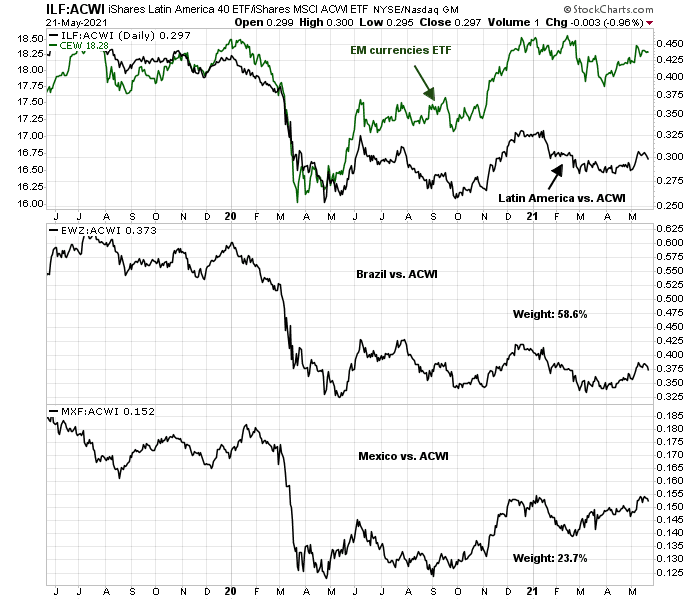
Latin America is a highly concentrated region. Brazil makes up 58.6% of the index and Mexico is second at 23.7%. The relative performance of the region has shown a high correlation to EM currencies and can be regarded as a play on EM currency strength and USD weakness.
The fragile EM countries with high current account deficits may offer some speculative but idiosyncratic value. Brazil, South Africa, and Turkey are either bottoming against ACWI, or exhibiting relative uptrends.
The world through a value/growth lens
Before concluding our investor’s trip around the world, I would like to highlight some unique analysis from All Star Charts, which countries by their value and growth exposure based on sector weights.

The growth countries are no surprises, consisting of Taiwan and South Korea, based on their high exposure to the semiconductor industry. As well, China is categorized as growth. So is the US, Israel, whose companies are mostly NASDAQ-listed technology stocks, and high-flying Vietnam. At the other end of the spectrum are a handful of small frontier markets. I would also highlight that two of the fragile EM countries, Brazil and Turkey, have high value style exposures, though investors should be cautioned about the specific risks of high current account economies.
Investment summary
In conclusion, the investor’s tour around the world revealed a number of opportunities and regions to avoid.
- US: Under threat from high valuation and the prospect of greater re-distribution government policies.
- Europe: Eurozone stocks are showing leadership qualities, but they are highly correlated to the value style.
- China, Japan, and Asia: Avoid. The Chinese economy is slowing.
- Emerging Markets: Selected opportunities available in Latin America as plays on USD weakness, and fragile EM economies as value plays.
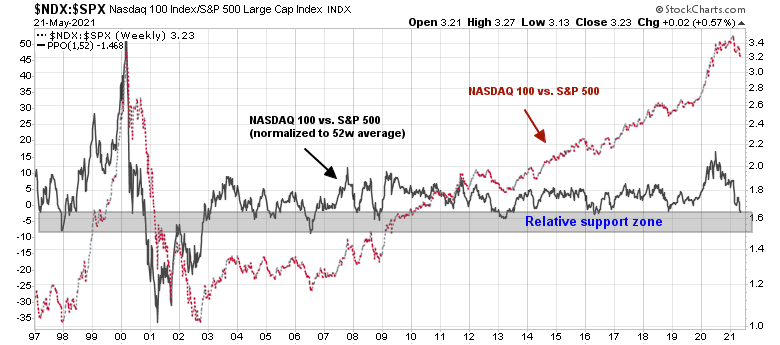
The one caveat for investors is decisions on country and region weights in a global portfolio amount to taking exposure in either the value or growth investing style. From a tactical perspective, the jury is out on whether value or growth will be the next leadership. The analysis of the NASDAQ 100 to S&P 500 ratio as a proxy for the relative strength of growth stocks shows that growth has been on a tear since 2007 (dotted red line). However, growth has begun to roll over. The black line shows the relative performance normalized on a 12-month basis. The growth stock skid is reaching a relative support zone where the deterioration has been arrested in the past.

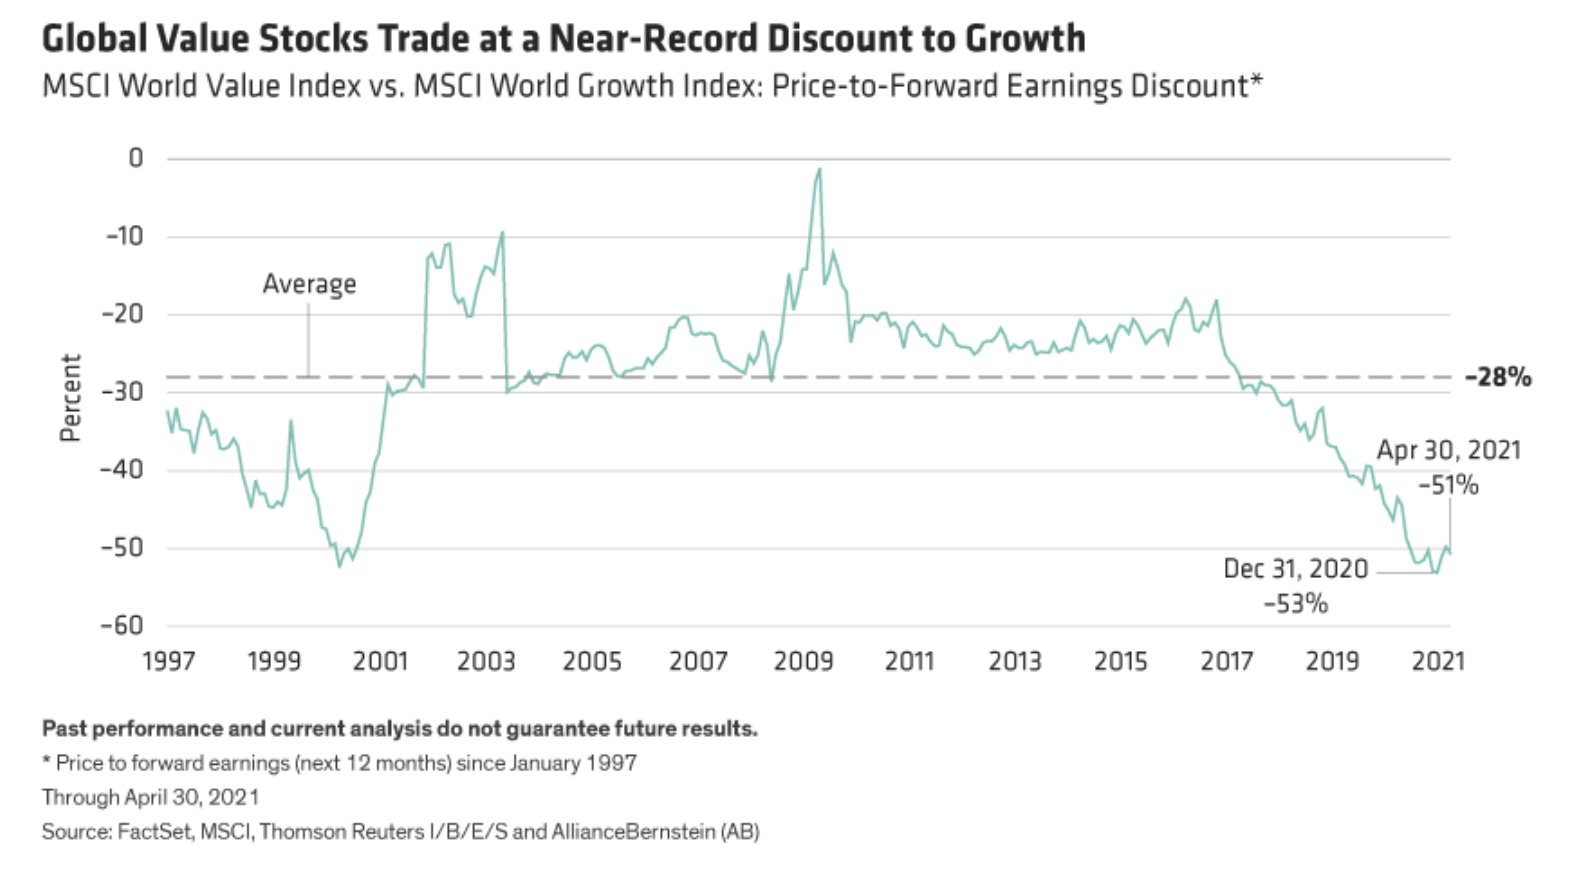
Longer-term, however, the outlook for value stocks is bullish. The global value discount to growth is near a historic low.
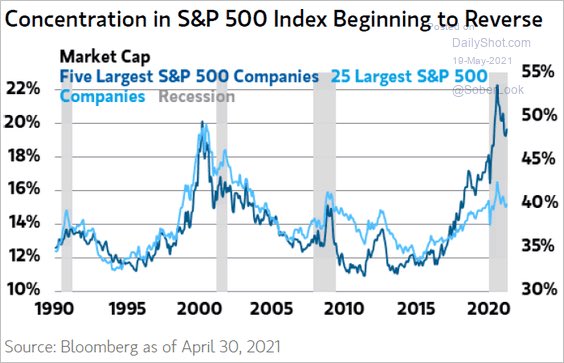
The trend of growth stock dominance is also turning. Remember the FANG+ stocks? Their concentration in the S&P 500 is beginning to reverse, which is a long-term bullish indication of value over growth stocks.


Talking about countries, Canada is at the top of my country ETF momentum performance list. America will be coming out of Covid first and Canada benefits. The Loonie is now the strongest developed world currency and that helps keep inflation in check since food and goods imports are huge. Canada tends to go on multi-year outperformance and underperformance periods. It looks like the start of multi-year outperformance.
There has been an amazing performance surge in Low Volatility/Defensive ETFs over the last week with Healthcare Providers IHS leading. Makes sense.
Gold is also rising from the dead. Cryptocurrencies are stumbling badly and I sense that institutions are moving back to gold. I note that GDX the senior miners is doing much better than GDXJ the junior miners. This tells me that speculators are not the driver. It is institutional. The tens of millions of dollars of ransomware payments we made in Bitcoin. Governments are moving to stop the anonymous movement of money. Yellen is talking of making crypto payments of over $10,000 reportable like with currency transactions in banks. China is outlawing Bitcoin for commercial transactions. The handwriting may be on the wall.
The strength of the CAD is going to be a headwind for those of us in Canada investing abroad, or even in domestic resource extraction companies.
Ken, Good to see you getting more optimistic on gold and GDX.
I use momentum but to buy something I must have a reasonable narrative that jives with the price action. This is especially true of any sector like gold that is underperforming from a six month lookback price action basis and is only recently starting to be a leader from the last intermediate market low (using March 4, 2021 now).
Gold has underperformed terribly over the last six months and from the November Vaccine Twist. When/if I own it now, it must keep doing well or I’ll sell at the first sign of problems. I don’t trust sectors that are underperforming on a six month lookback. On the other hand, with long term outperformers I give the benefit of the doubt when they experience short term weakness.
Hi Ken:
There use to be a standing joke in the Soy Bean and Corn Pits in Chicago known as the La Nina effect. When prices went up the traders would joke that is what caused it. For those who don’t know what it is:
https://farmdocdaily.illinois.edu/2020/12/the-impact-of-preseason-la-nina-episodes-on-corn-and-soybean-yields-in-brazil-and-argentina.html
In almost cases news and analyst have to justify a fundamental reasons for prices going up. Once a trend develops it tends to gather more and more participants which leads to more and more fundamental justification which can be more more bizarre. For example gold going up because of the Diwali season in India.
George Soros said it best ” ride the trend even if it is for fallacious reasons”. Not exact words.
I remember the day when the powers that be came out with a new rule that the rowdy traders in the futures market pits had to start wearing ties on the trading floor. They complied but many wore them around their heads not their necks.
So, to add International Ex-US value, what do the readers feel about the choice of VXUS/VYMI combination? Thanks.
My wife uses VXUS in her portfolio. I use VYMI ( and VYM) in my dividend sleeve of the portfolio. Low expense ratio, good stewardship from Vanguard.
Question for pundits: There is around 20 Trillion $ worth of bonds with negative yields. How much would the US Fed let ten year yields rise to?
Sure, the answer is that it depends on inflation. Even if inflation rises to say 3.5%, would the ten year rise past say 2%? Thanks.
European rates are also going up.
Fed has no control over UST10Y. Back in Q4 2018 when 10Y rises to 3.25, Market collectively determined recession was soon coming and we had a quasi bear in SnP500. Now let’s have a very crude approximation using M2 velocity to determine what 10Y would look like when Market will have tail spin again. It’s about 2.5 using today’s numbers.
As for the 20T, nobody knows. We don’t anything about these holders. But bonds probably stay quiescent for a while. 10Y and 5Y breakevens are dropping as of last week. So Market expects moderation of inflation. Short-term supply problems will be worked out and we will be back to something like 2019, in an environment of secular decline in long bond yields.
Even M2 velocity is in big secular decline. People just put money under mattress or in socks. It happens when demographics is graying. Risk taking decreases.
Dear Cam: what is your take on commodities? If commodities have a positive trend in 1 to 2 years, it should impact emerging markets stocks