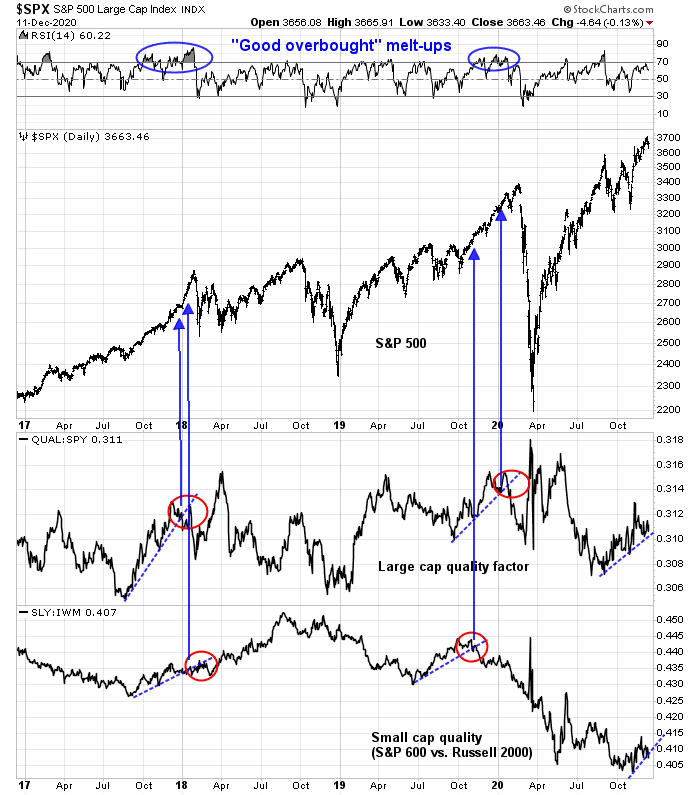
In late 2017, the stock market melted up in a FOMO (Fear Of Missing Out) stampede as enthusiasm about the Trump tax cuts gripped investor psychology. The market corrected in early 2018 and rose steadily into October, though the advance could not be characterized as a melt-up. In late 2019, the market staged a similar FOMO stampede and the rally was halted by the news of the pandemic spreading around the world.
In each of the above cases, the Fear & Greed Index followed a pattern of an initial high, a retreat, followed by a higher high either coincident or ahead of the ultimate stock market peak.
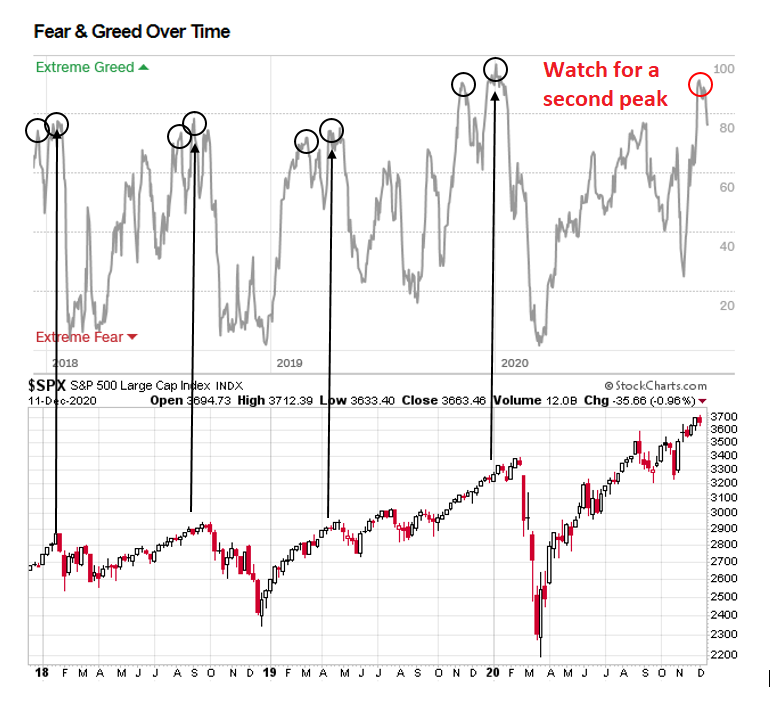
Could we see a similar year-end melt-up in 2020?
A new cyclical bull
It’s starting to look that way. Evidence is emerging that the stock market is at the start of a new cyclical bull. Exhibit A is the Dow Jones Industrials Average and Transportation Average. Recently, both made fresh all-time highs. That’s a Dow Theory buy signal, a classic indicator of a new bull market.

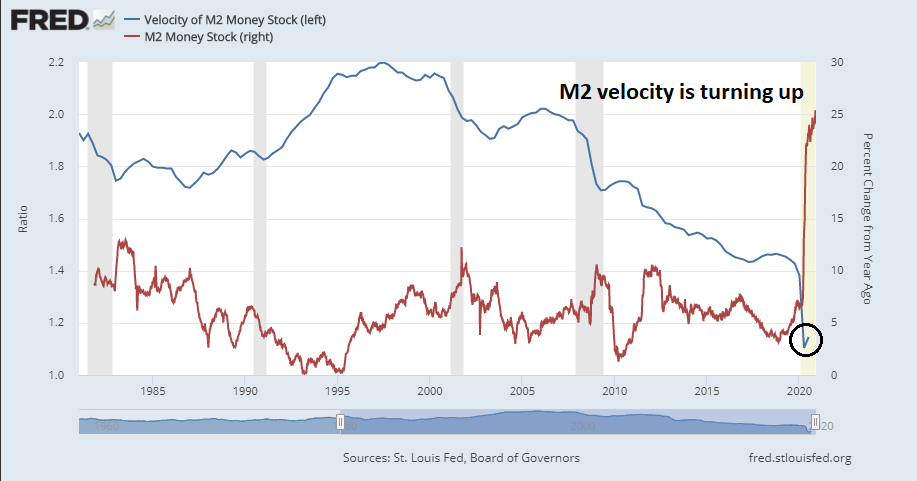
The economy is starting to turn up from a top-down macro perspective. The tsunami of monetary stimulus has produced a surge in M2 growth, it was an open question of when any of the money growth would affect the economy. M2 monetary velocity is finally turning up. This is a signal of a growth revival. (Recall PQ = MV).
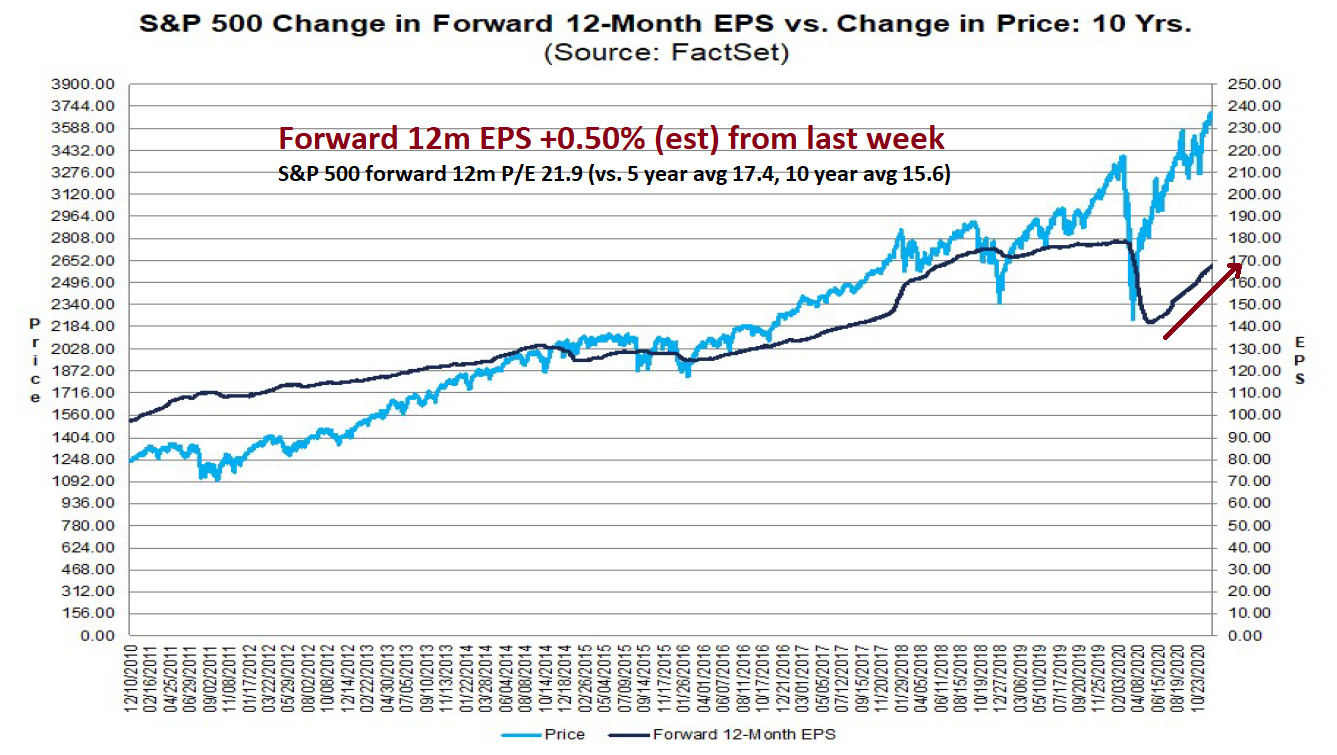
The latest update from FactSet shows that earnings estimates are recovering strongly.
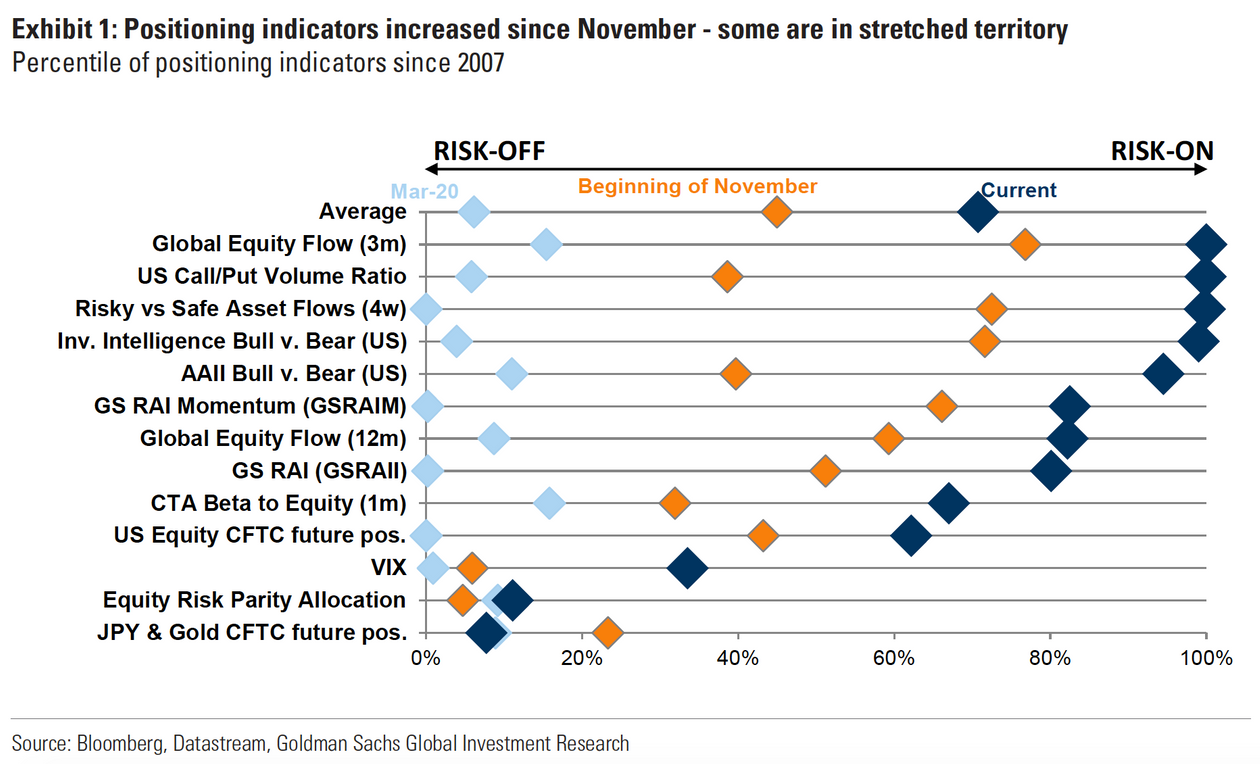
Marketwatch reported that Goldman Sachs strategists headed by Alessio Rizzi believe that a sizable correction is not on the immediate horizon. To be sure, many sentiment indicators are at historical highs, but that should not be a major concern because of the positive macro environment.
Rizzi and his team said that indicators like put/call ratios tend to provide the most useful signals of where the market is moving when they are extreme, and that “that bullish positioning levels tend to remain strong for a long period if macro remains supportive.”
The macro environment may be headed in that direction. The European Central Bank increased stimulus on Thursday, and Treasury Secretary Steven Mnuchin is offering a $916 billion stimulus package to Congress to try to break a legislative deadlock.
In other words, buy the dip!
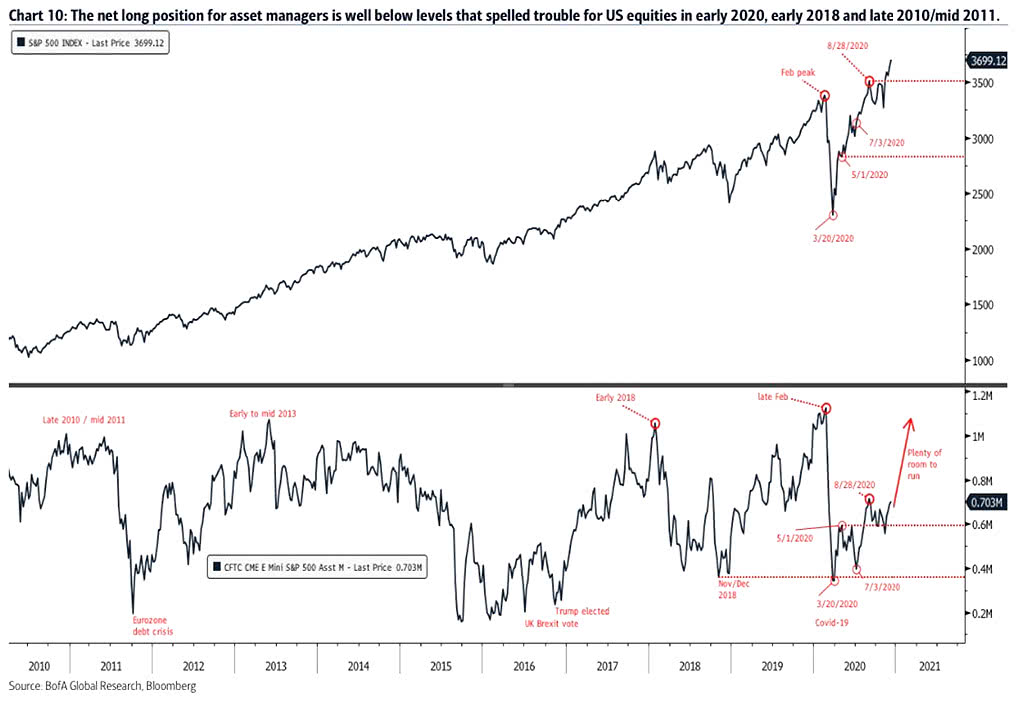
Supportive positioning
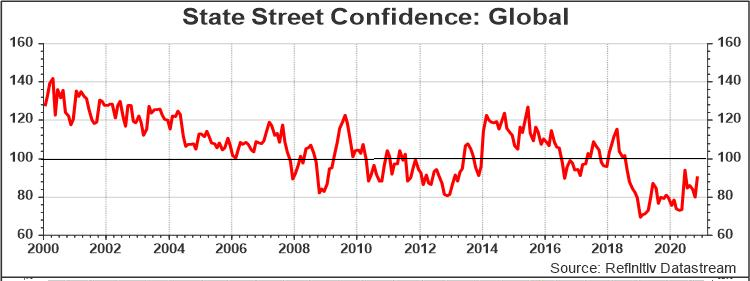
Indicators of institutional positioning are supportive of further market gains. John Authers recently highlighted the results of a “global survey of institutions by Natixis SA, which interviewed 500 managers” which found an unexpected level of guarded cautiousness among respondents.
Of these, 79% don’t expect GDP to have recovered to its pre-Covid levels by the end of next year, making them more bearish than typical sell-side researchers…There is a belief in a rotation toward value, but that co-exists with a belief that geopolitical tensions will worsen, amid rising social unrest, as democracy weakens. Both socially and economically, the people running very large institutions plainly believe the market is ahead of itself in expecting the effects of the pandemic to soon be vanquished:


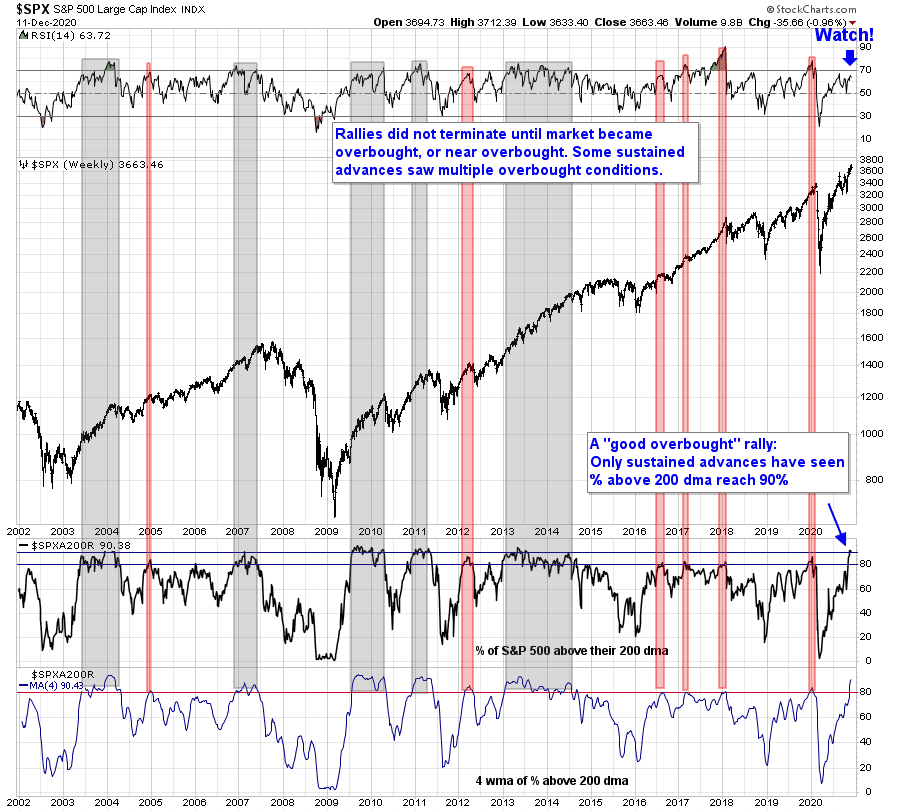
Market internals are bullish
I think there’s still quite a bit of skepticism on main street about the economic recovery.
From a personal experience, I’ve noticed more recruiters reaching out to me for interviews on Linkedin. Layoffs at my company have also stopped after three rounds of layoffs and pay cuts across the entire company between March and October.
Still long into the end of year.
I am an optimist and stayed almost fully invested throughout 2020. I have shifted the portfolio for global cyclical rebound.
Having said that, what are the chances for first quarter economic dip? They are not trivial. Economic restrictions in California, NY/NJ and Illinois and other places will have an impact. First quarter has generally been a soft spot in many of the business cycle recoveries. Falling dollar raises the prospects of higher inflation and interest rates. Biden will change policies that may not lead to economic growth (regulations in particular).
I find myself a more cautious investor at this time, notwithstanding Cam’s FOMO rally and Ken’s momentum indicators.
There may be a chill in q1, we are seeing some slowdown in tech sales right now, however as the vaccines are more widely available and a combo of Biden and a tighter Senate (think split in GA leading to only one GOP Senator needing to defect, and there are four potential candidates) and you end up with more disaster recovery spending. At the same time the Fed is pumping away.
Not to say there can’t be a correction, but those are powerful forces that will bring money off the sidelines. I’m cautiously bullish.
All good points. Mr. McConnell holds the key to what comes for a vote. One Senator can gum up the works. There has been excess Money Supply for most of the year (funds over what is needed for growth) so Fed adding more may not be helpful on the margin. Fiscal package can boost spending immediately.
No one, including Cam, talks about how expensive the market is. IPOs doubling, tripling in a month or two. A new normal?
The definition of ‘expensive’ can be elusive. We all know that there have been extended periods where PE rations were in the single digits, and also when they’ve continued at high levels longer than anyone could imagine. Ken also recently linked Shiller’s excess CAPE yield paper – might the valuation process be in an early phase of evolving into more useful models? Sure – it wasn’t that long ago that Shiller introduced the CAPE model.
Street estimates for Q1 are coming down, but still rising for all the other periods.
https://twitter.com/HumbleStudent/status/1337788310694014977
https://www.project-syndicate.org/commentary/making-sense-of-soaring-stock-prices-by-robert-j-shiller-et-al-2020-11
The (real) earnings yield may be higher than 4%.
https://twitter.com/CiovaccoCapital/status/1337908440023199745
Cam, The graph of M2 Velocity you show immediately turned down on shorter time frame graphs and is modestly falling now.
Not an expert in Cape Ratio but my understanding is that the future expected returns are low when Cape ratio is high and vice versa particularly when inflation has been low. The ECY may partly explain current high valuations but is silent about future expected returns. Nor does it say anything about expected short term outcomes.
Cape has lot of data and research about it’s predictive ability. What do we know about the new measure? Anyone?
https://www.brandes.com/docs/default-source/brandes-institute/2018/the-cape-ratio-and-future-returns-a-note-on-market-timing.pdf
The data is very clear in the above paper. Higher CAPEs indicate lower subsequent returns. That said, also note the data on non-US markets.
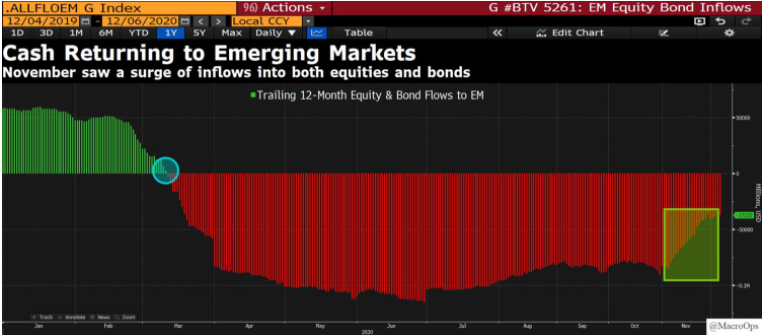
Skewing portfolios to small caps, non-US markets, US value groups, commodities/cyclicals etc. may be the blue print going forward as these are cheaper segments of the markets. Both Cam and Ken have written extensively about this.
What is not clear here is the relationship of “real” EY (earnings yield) and subsequent returns. This is the first time in living history where central banks have been successful in flogging “real” EY to where they are today. See Professor’s Shiller’s paper from Project syndicate in my previous post.
Ask the question, what happens to EY if ten year treasury goes down to -2 or -3 or -5 percent? Did you think five or ten years ago that US ten year yield, today would be -1%? What makes one believe that ten years from today it will not be @ -5%?
The current EY is close to 4.7% (based on S&P 500 earrings of 176$ per share and S&P 500 at 3700). Real EY would be 5.7%. What we are seeing here are market circumstances akin to January/February 2020, before the Pandemic. At that time, we were expecting 176$ per share of S&P 500 earnings. Presuming the pandemic is in the rear view now, what would be the Earnings for 2021, or 2022 or 2023? Assume that GDP grows at say 3% for these years, which may suggest market growth at say 6%.
http://genwp.com/blog/stock-market-returns-gdp-growth#.X9XvJC2ZPEo
More dollars to purchase the same amount of growth/profit?
Each Trillion US$ buys less incremental GDP growth.
https://www.thoughtco.com/zeros-in-million-billion-trillion-2312346
We are dealing politicians who have no idea what they are doing, no idea about the zeros after 1.
Spot on about Cape Ratio.
I was wondering about the new ECY measure. Does it have similar characteristics?