Preface: Explaining our market timing models
We maintain several market timing models, each with differing time horizons. The “Ultimate Market Timing Model” is a long-term market timing model based on the research outlined in our post, Building the ultimate market timing model. This model tends to generate only a handful of signals each decade.
The Trend Asset Allocation Model is an asset allocation model which applies trend following principles based on the inputs of global stock and commodity price. This model has a shorter time horizon and tends to turn over about 4-6 times a year. In essence, it seeks to answer the question, “Is the trend in the global economy expansion (bullish) or contraction (bearish)?”
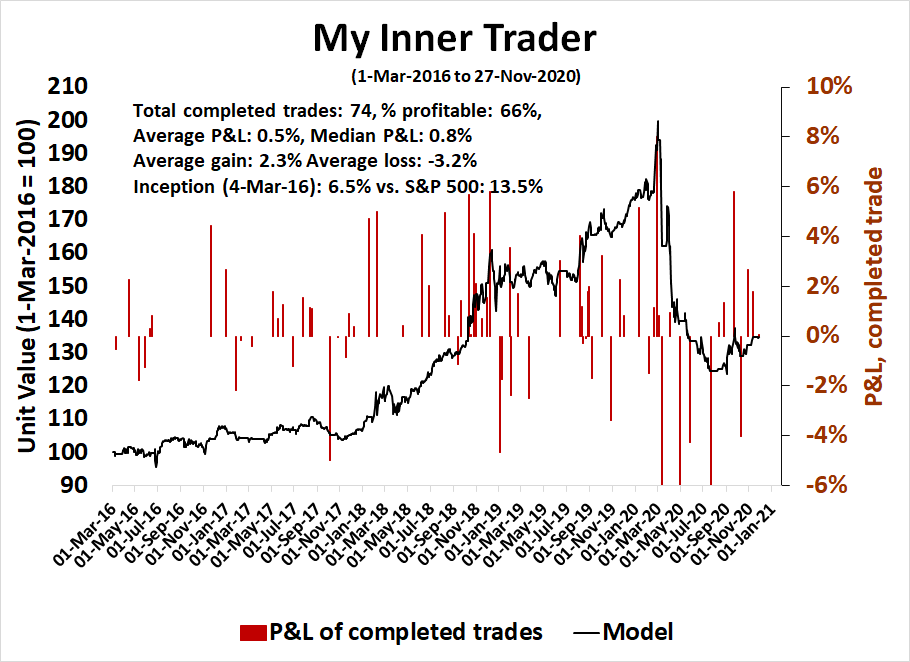
My inner trader uses a trading model, which is a blend of price momentum (is the Trend Model becoming more bullish, or bearish?) and overbought/oversold extremes (don’t buy if the trend is overbought, and vice versa). Subscribers receive real-time alerts of model changes, and a hypothetical trading record of the email alerts are updated weekly here. The hypothetical trading record of the trading model of the real-time alerts that began in March 2016 is shown below.
The latest signals of each model are as follows:
- Ultimate market timing model: Buy equities
- Trend Model signal: Bullish
- Trading model: Neutral
Update schedule: I generally update model readings on my site on weekends and tweet mid-week observations at @humblestudent. Subscribers receive real-time alerts of trading model changes, and a hypothetical trading record of those email alerts is shown here.
Subscribers can access the latest signal in real-time here.
The proverbial Wall of Worry
While I remain intermediate-term bullish, the short-term outlook is less certain. Market sentiment is becoming a little frothy, and the market is vulnerable to a setback should any negative catalysts were to appear.
The bulls will say that the market is just climbing the proverbial Wall of Worry. The bears contend that it is nearing a Slope of Hope. What’s the real story?
What I am worried about
The market can correct at any time, but that doesn’t mean that it will. Here are the major potential problems that I am worried about.
- Excessively bullish sentiment
- Fund flows and positioning vulnerabilities
- Fiscal cliff and double-dip recession risk
Let’s consider each of these issues.
Too euphoric?
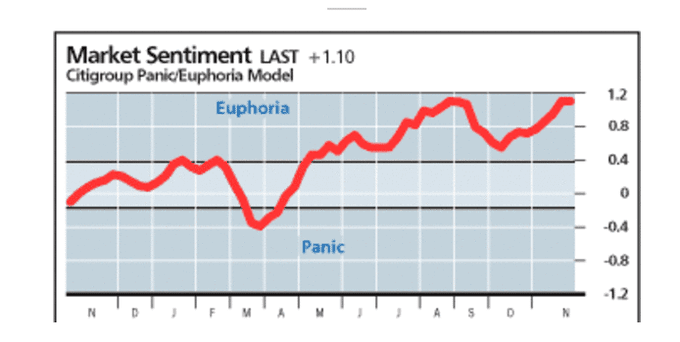
The most obvious area of concern is sentiment. Sentiment surveys are becoming increasingly giddy, which is a concern for the bulls. The Citi Panic/Euphoria Model is back at the euphoric highs seen last August.
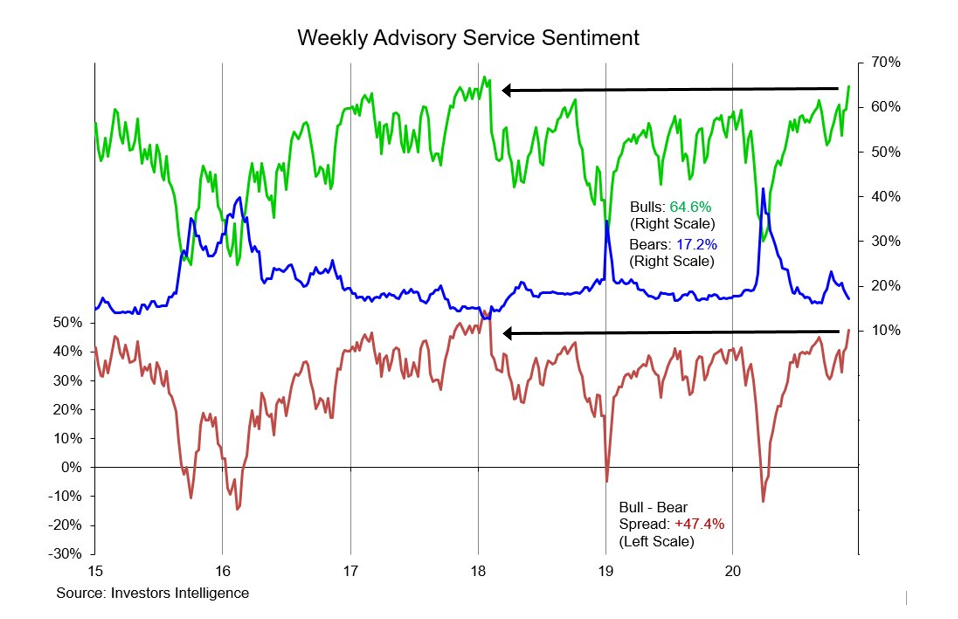
The latest Investors Intelligence sentiment survey shows that the percentage of bulls and bull-bear spread reached levels last seen at the terminal phase of the melt-up of early 2018.
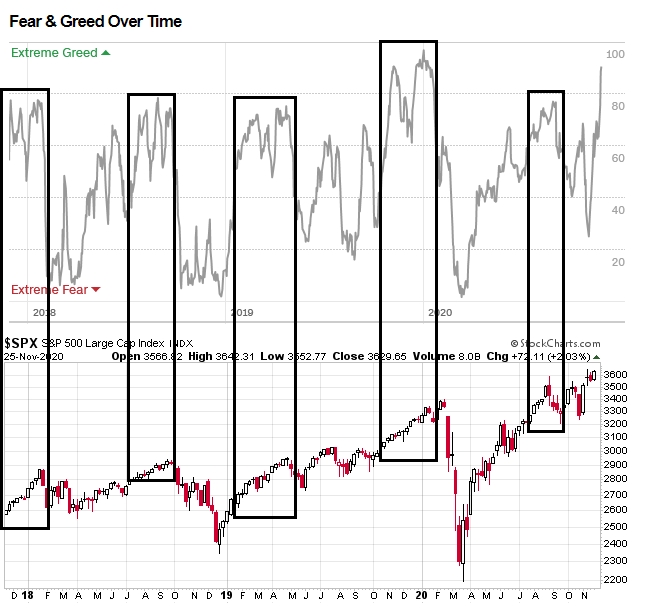
The
Fear & Greed Index reached the nosebleed level of 92. It is also screaming warnings of overbought conditions, though the indicator has not proven itself to be an actionable tactical sell signal for traders in the past. Historically, the market has corrected when sentiment has become this greedy, but not necessarily right away.
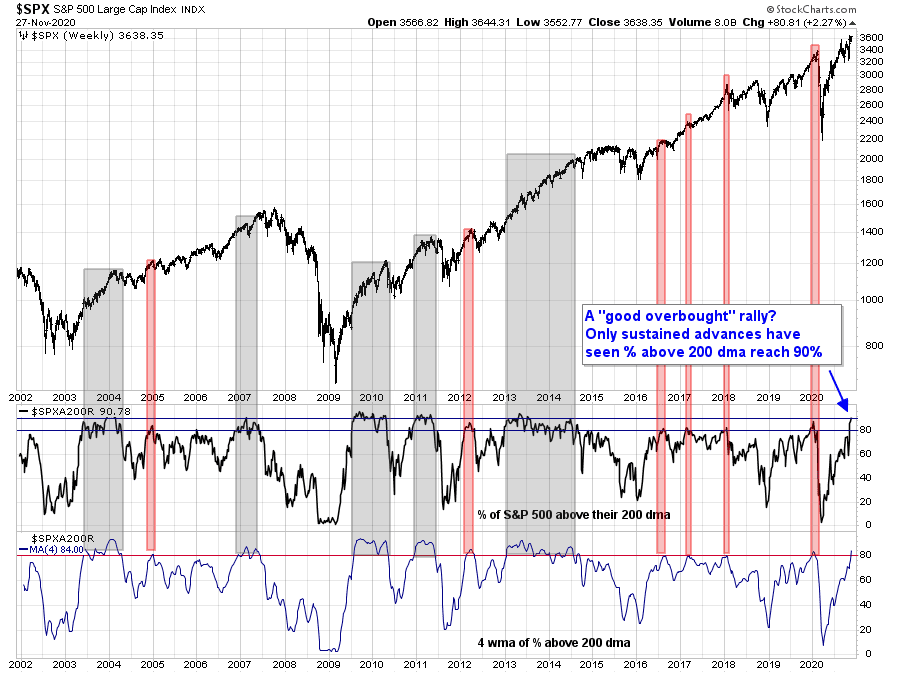
Here is my alternate bullish scenario. Severely overbought conditions are usually present in the initial stage of a sustained bullish advance. The percentage of S&P 500 stocks above their 200 day moving average (dma) has surged to over 80%. Past instances have either resolved themselves with “good overbought” rallies (grey) or brief overbought conditions and pullbacks (pink). However, only readings of 90% or more have signaled a strong and sustainable bull phase. Is this a new bull?

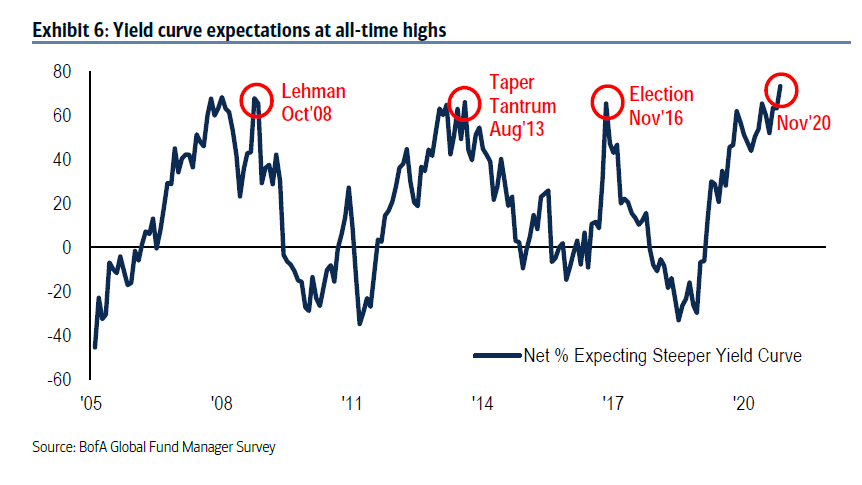
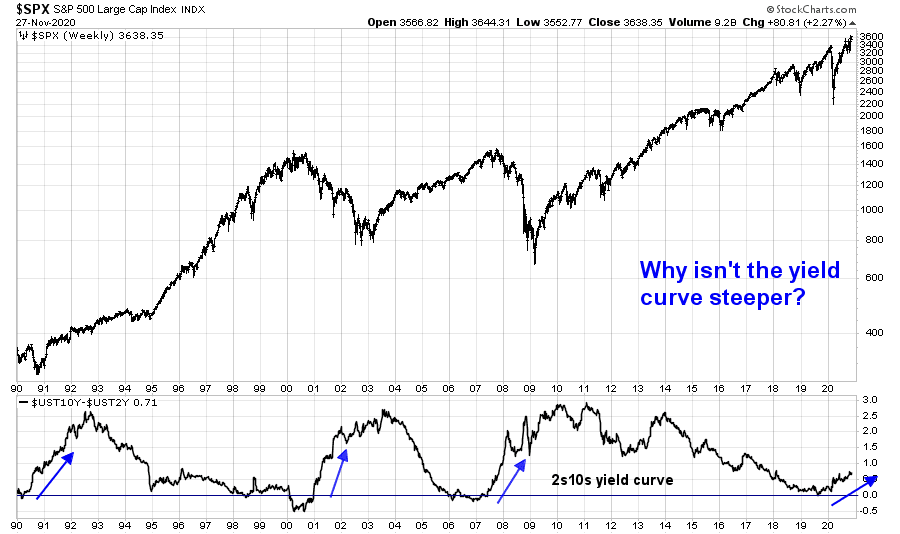
Federal Reserve actions may be blinding technical analysts when they warn of excessively bullish sentiment and overbought conditions. In the past, economic recoveries have been marked by a steepening yield curve as the bond market anticipates better future growth. This time, the Fed and other major global central banks have promised to hold short rates near zero for years, but the yield curve isn’t steepening as strongly as it has in the past. Steepening yield curves have acted as a brake to higher stock prices by offering a higher yield alternative for investors. Indeed, the BoA Global Fund Manager Survey shows that expectations for a steeper yield curve are at all-time highs.
This time may be different. While the Fed has not explicitly engaged in yield curve control (YCC), the latest FOMC minutes has hinted at such actions and even the threat of YCC may be enough to hold down the belly and long end of the yield curve to support higher stock prices.
I would add that it isn’t just the Fed concerned about the yield curve.
Bloomberg reported that ECB chief economist Philip Lane voiced similar worries, even as the German 2s10s stands at a meager 17bp, the lowest level since 2008.
“While the arrival in the coming weeks and months of further positive signals about progress in the roll-out of vaccine treatments would certainly be highly welcome,“ Lane added, “it is essential that the macroeconomic recovery is not derailed by a premature steepening of the yield curve.”
Fund flows and positioning vulnerabilities
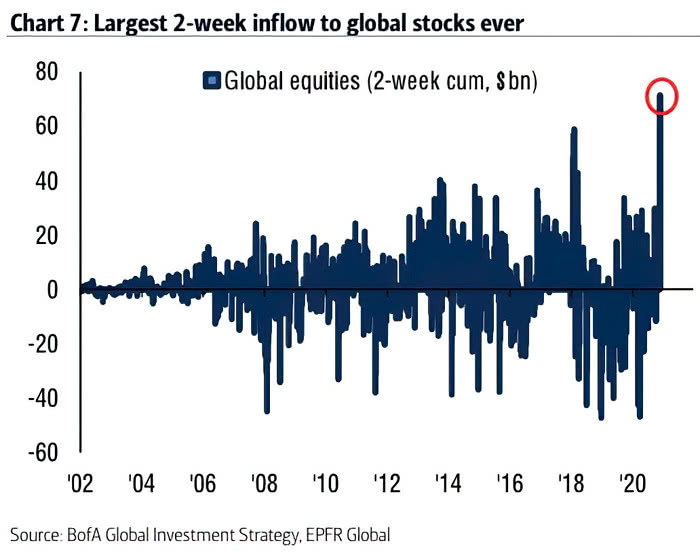
Another sign of froth has been the stampede into stocks, as evidenced by record fund flows into global equities.
Despite the recent relative weakness of FANG+ names, retail interest hasn’t abated. Option open interest remains highly elevated.
As we approach quarter-end and year-end, the strong performance of equities could prompt balanced funds to rebalance by selling their stocks to buy bonds.
Bloomberg reported that JPMorgan estimates that rebalancing flows could amount to $300 billion.
Rebalancing flows may lead to an exodus of around $300 billion from global stocks by the end of the year, according to JPMorgan Chase & Co.
Large multi-asset investors may need to rotate money into bonds from stocks after strong equity performance so far this month, strategists led by Nikolaos Panigirtzoglou wrote in a note Friday. They include balanced mutual funds, like 60/40 portfolios, U.S. defined-benefit pension plans and some big investors like Norges Bank, which manages Norway’s sovereign wealth fund, and the Japanese government pension plan GPIF, the strategists said.
“We see some vulnerability in equity markets in the near term from balanced mutual funds, a $7 trillion universe, having to sell around $160 billion of equities globally to revert to their target 60:40 allocation either by the end of November or by the end of December at the latest,” the strategists wrote.
If the stock market rallies into December, there could be an additional $150 billion of equity selling into the end of the month pension funds that tend to rebalance on a quarterly basis, they added.
For some perspective of the magnitude of fund rebalancing pressure, BoA and EPFR reported a record 3-week global equity fund inflows of $89 billion. The bulls better hope that there is sufficient demand to offset the rebalancing effect.
Fiscal cliff = Double-dip?
Turning to the Washington ollies, let’s start with the good news.
Bloomberg reported that there is a tentative agreement to avoid a government shutdown.
Republican and Democratic lawmakers have reached an agreement on spending levels for the annual spending bill needed to keep the government open after current funding runs out Dec. 11 – The deal between Senate Appropriations Chairman Richard Shelby, an Alabama Republican, and House Appropriations Chairwoman Nita Lowey, a New York Democrat, increases the chances that a giant $1.4 trillion bill to fund the government can pass Congress before the deadline. The agreement encompasses top-line amounts for all 12 parts of an omnibus appropriations package as well as the level for emergency spending above the $1.4 trillion budget cap set in law in 2019.
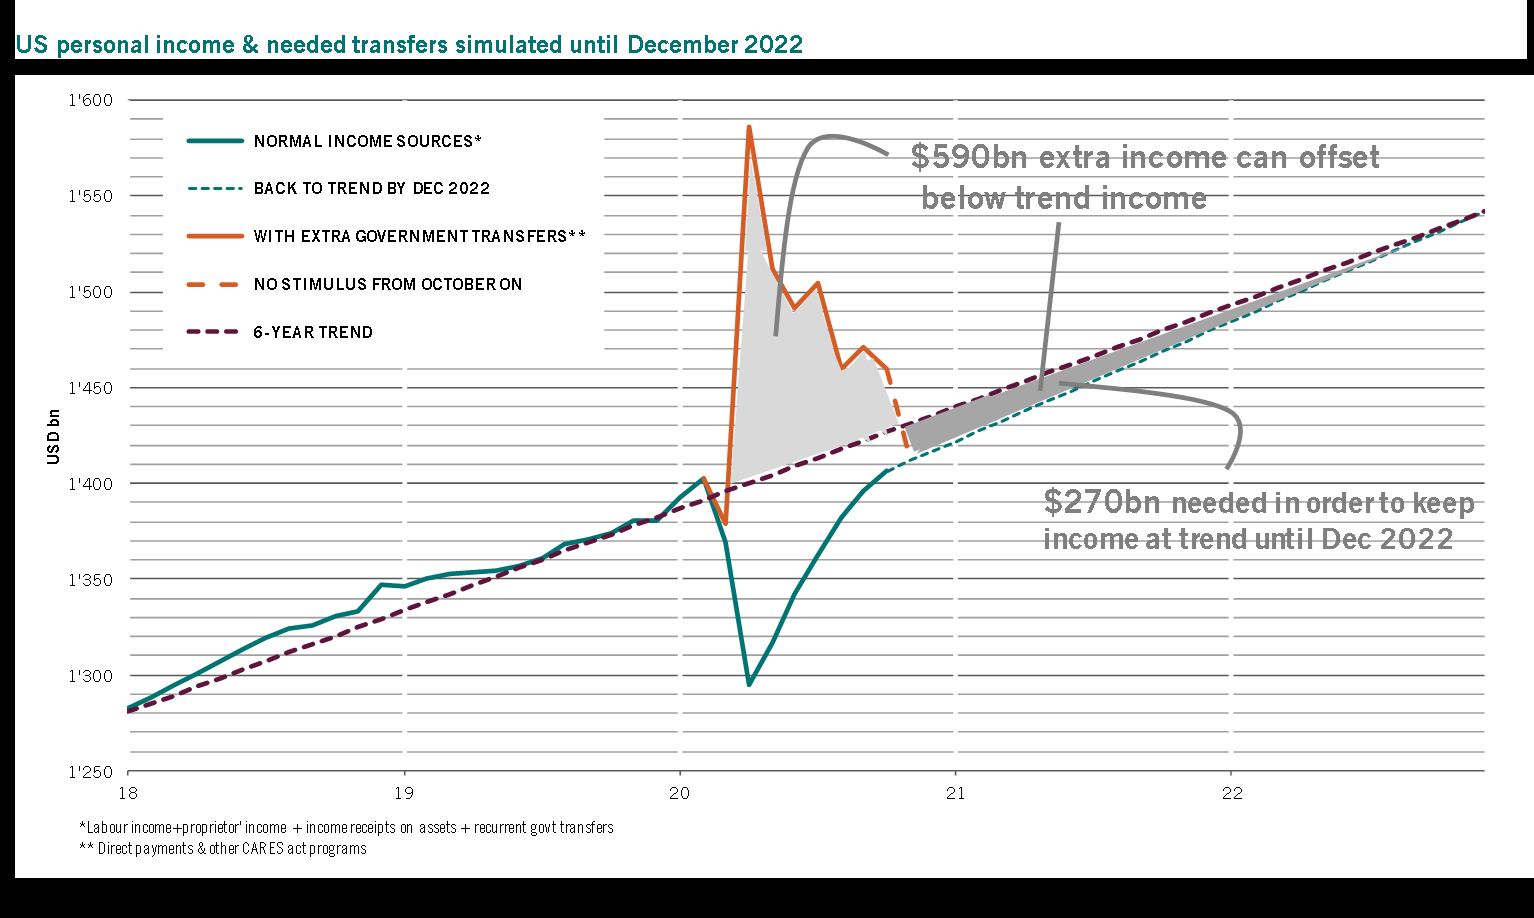
However, the political incentives are not in place for a CARE Act 2.0. The latest PCE report shows that personal income growth after CARES Act transfers has been steadily decelerating.
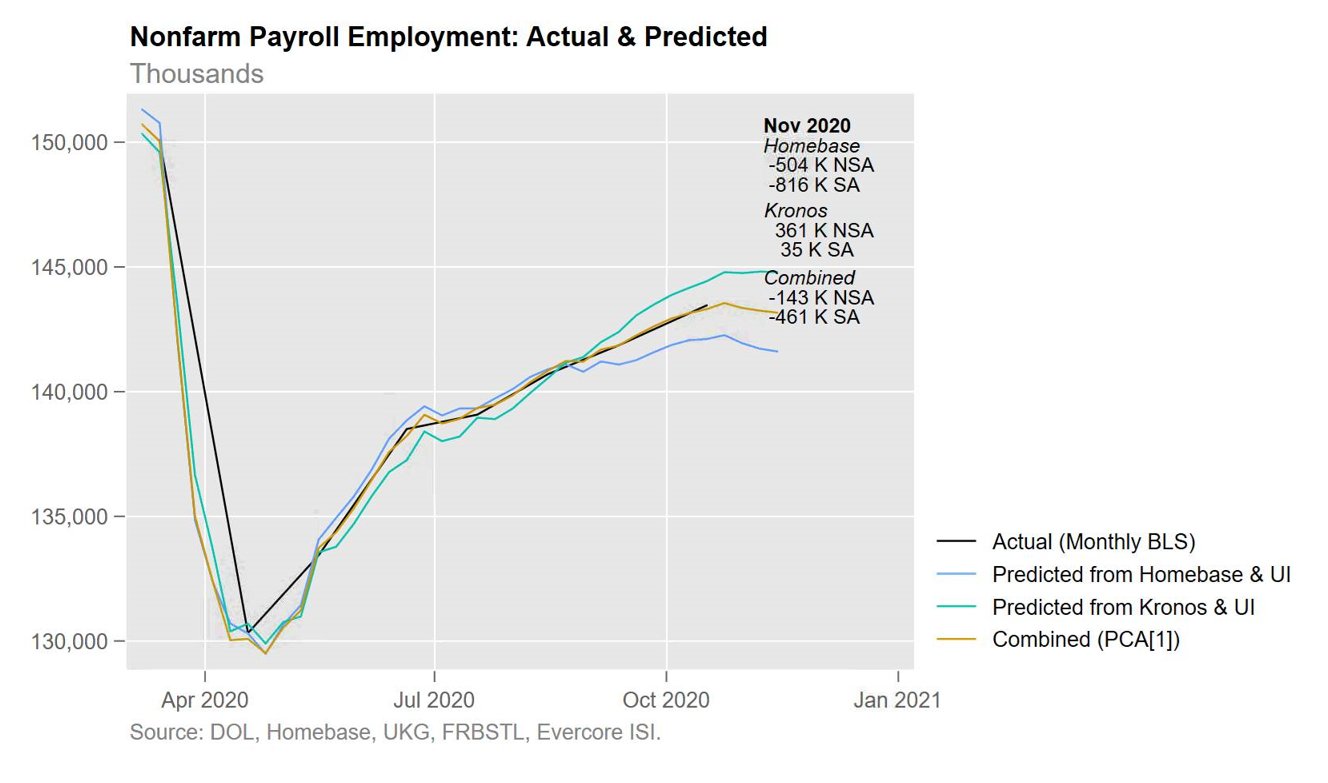
The consensus forecast for the November Jobs Report is a gain of 520K jobs, but there is a distinct possibility that the market could be surprised by a negative print. High-frequency data from Homebase and Kronos suggests that the November Jobs Report will be flat to negative.
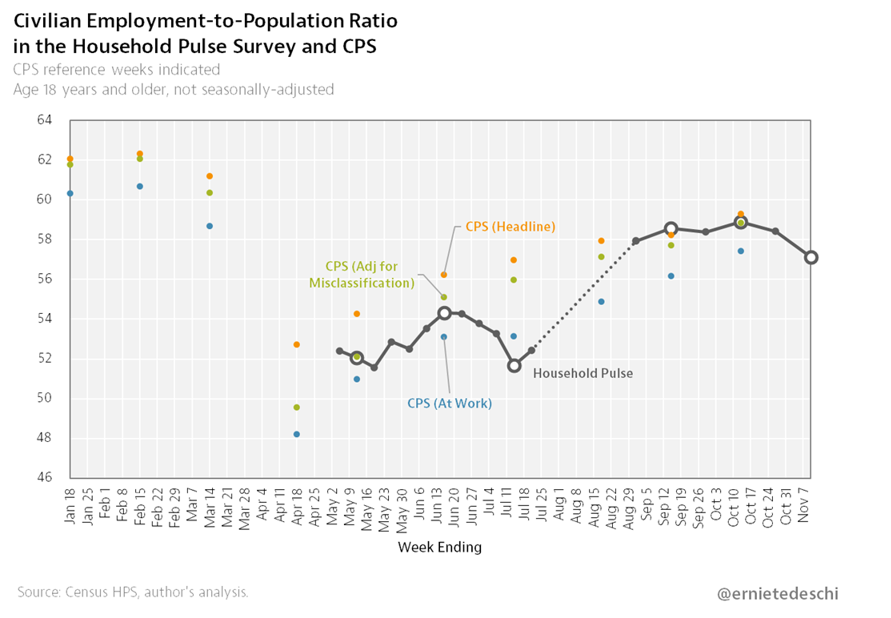
The Census Bureau’s Household Pulse Survey is also showing signs of weakness.
Against a backdrop of rising COVID-19 cases, government-mandated shutdowns, and little or no chance of an interim fiscal package until Biden takes office, when will the market start to focus on a double-dip recession scenario?
To be sure, the situation may be as dire as the headlines suggest. Pictet Asset Management estimated that it would only cost $270 billion to keep personal income on-trend. That’s not an extraordinarily high level and well within the reach of negotiators in Washington.
Near-term stall ahead?
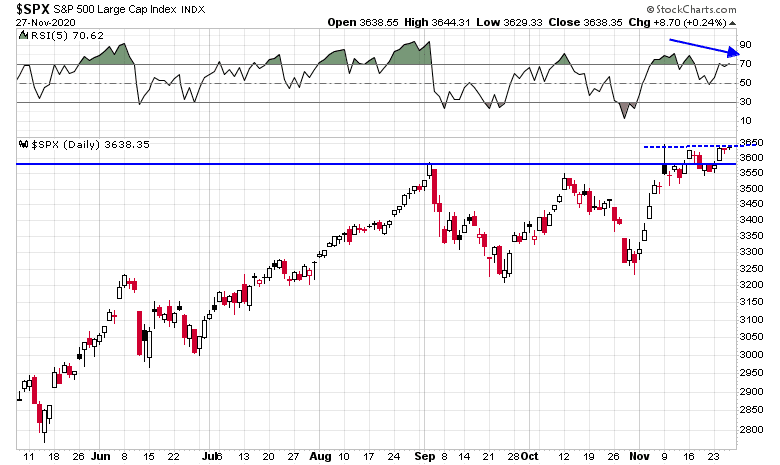
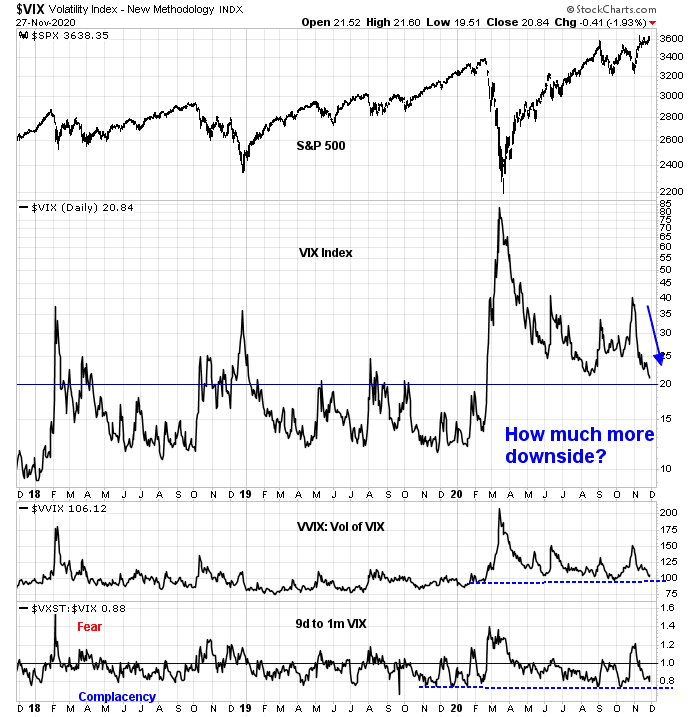
Looking to the week ahead, the market rally is starting to show signs of exhaustion. The VIX Index is inversely correlated with the S&P 500, and it is falling towards the 20 level which often defines a normal market environment. However, the VVIX, which is the volatility of the VIX, is nearing an important support level. Moreover, the 9-day to 1-month VIX ratio is in complacency territory. How much more near-term downside is there to the VIX? Conversely, how much more upside is there to the S&P 500?
In conclusion, the intermediate-term trend for equity prices is up. However, the market faces considerable short-term risks and could correct at any time. However, price momentum is strong, and the market could continue to melt-up into early 2021. If I had to guess, I would put the odds of a continued advance at two-thirds, and a significant correction at one-third.


In 3 sessions’ time the VIX BB will narrow a lot due to old data dropping out, bringing it close to the lower limit. How about a weak correction (dip) only?
I think the odds are good that Monday (EOM) + Tuesday (401k fund inflows) will be positive. Beyond that – perhaps a chop into Friday’s employment report, which may disappoint and present another buying opp.
The general market is impossible to forecast because it is not homogeneous as it used to be. There is a wide divide between Value and Growth that got bigger the longer that Value underperformed. The pandemic was the final nail on the Value coffin. Growth/technology/internet in a virus damaged world are the only area with rising earnings.
So the general market is now like a ranch with a herd of cattle and ostriches in a pasture together. How will the group react? Anybody’s guess. But looking at each species independently, one could make a good judgement.
So I suggest in today’s investment world one must look at Value and Growth separately. The three regions, Europe Asia and North America are also better analyzed separately with a general global overview.
I can see growth/tech/internet/stay-at-home having some weakness as rebalancing institutions sell them rather than Value. I see Value and ex-US as a new outperformance cycle that started on November 9, just a few weeks ago. These Value stocks were in a consolidation since early June, five months. Growth during that time was marching higher and higher. The same with country markets. QQQ was up and up while Asia, Europe and Emerging were consolidating. Asia outperformance (Japan, Korea, Singapore, Australia) is very new whereas QQQ has been on a roll for a very long time.
Will the new Value strength outweigh Growth weakness to make the S&P 500 go up? Will the ostriches do better than the cattle?
I will watch them separately.
Thanks Ken for a very good analysis.
Funds re-balancing is on-going, and the systematic algos are re-leveraging mechanically now that vix is below 21/20. Systematic algos have more money than those funds. So I guess we might see slightly up trends in the indices. But I suspect a particular group of select stocks will be teflon-like.
These trends are implied implicitly here by rxchen a few times. If you pay enough attention, the trends started back in 2017 and became full-bore 2018 and onward to today. It will continue because these trends have strong secular underpinnings beneath them.
Without stating the obvious, are you implying that growth led by FAANG will continue to do well in the future?
Red skies to start the day – but really not too bad given that (a) we’re at all-time highs, and (b) futures are well off the overnight lows.
I’m adding one position here in FXI – I wasn’t able to justify chasing a +3% move on Friday, so I’m taking advantage of the -2% pullback this morning.
Adding a position in VEU.
Tim Duy’s blog this morning is worth reading
https://blogs.uoregon.edu/timduyfedwatch/
Adding a position in VTIAX at the close.
And a smaller position in VEMAX.
Not a great day for me – mainly attributable to positions in emerging markets and energy.
Actually, I should be fair to the market gods. I was looking for an entry into VTIAX/VEU and FXI last week, and thinking I may have no choice but to chase at some point. The market supplied decent entries into both today.