Investors are increasingly convinced that the cyclical and Great Rotation trade is very real and long-lasting (see Everything you need to know about the Great Rotation but were afraid to ask). That should be bullish for the S&P 500, right?
Well, sort of.
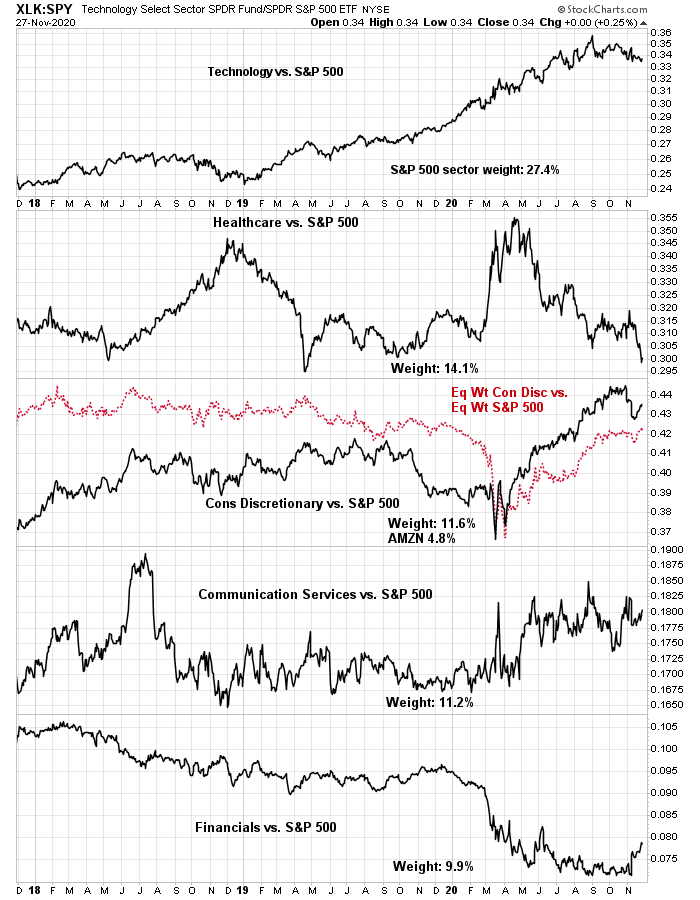
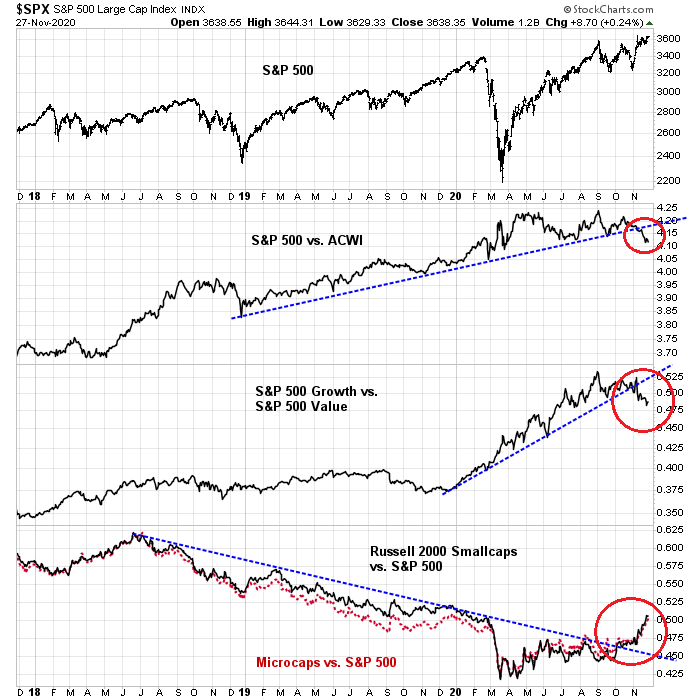
Despite the cyclical and reflationary tailwinds for stocks, the S&P 500 has a weighting problem. About 44% of its weight is concentrated in Big Tech (technology, communication services, and Amazon). The top five sectors comprise nearly 70% of index weight, and it would be difficult for the index to meaningfully advance without the participation of a majority of these sectors. However, an analysis of the relative performance of the top five sectors does not exactly inspire confidence as to the sustainability of an advance. Technology relative strength, which is the biggest sector, is rolling over. Healthcare is weak. Neither consumer discretionary nor communication services are showing any signs of leadership. Only financial stocks, which represent the smallest of the top five sectors, is exhibiting some emerging relative strength.
There are better investment opportunities, and investors can potentially outperform by a cumulative 50-250% over the next 2-3 years.
The Great Rotation Risk-On trade is very real
I believe the cyclical rebound and Great Rotation is long-lasting. First, there is ample evidence that the global economy is reflating. The copper/gold ratio and the more broadly based base metals/gold ratio are both surging, indicating cyclical strength.

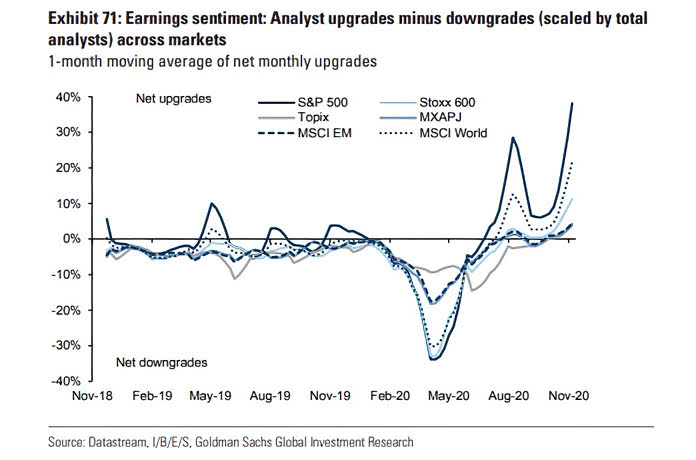
Earnings sentiment is improving in every region of the world.

Over in Asia, the closely watched and highly timely 20-day South Korean export figure jumped in November, indicating an acceleration in global strength.

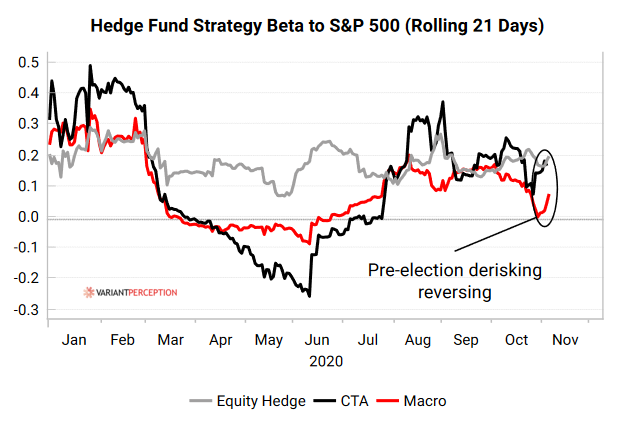
An analysis of fast-money positioning shows that hedge funds went into the November election underweight equity market exposure. When the dire forecasts of a contested election and riots in the streets didn’t materialize, they reversed course and bought equities. Current positioning is not excessive. Institutional fund flows, which is glacial but enormous, is only beginning to buy into the cyclical and reflation theme.
This Great Rotation rally has legs.
What’s the upside potential?
What are the potential gains from the Great Rotation trade?
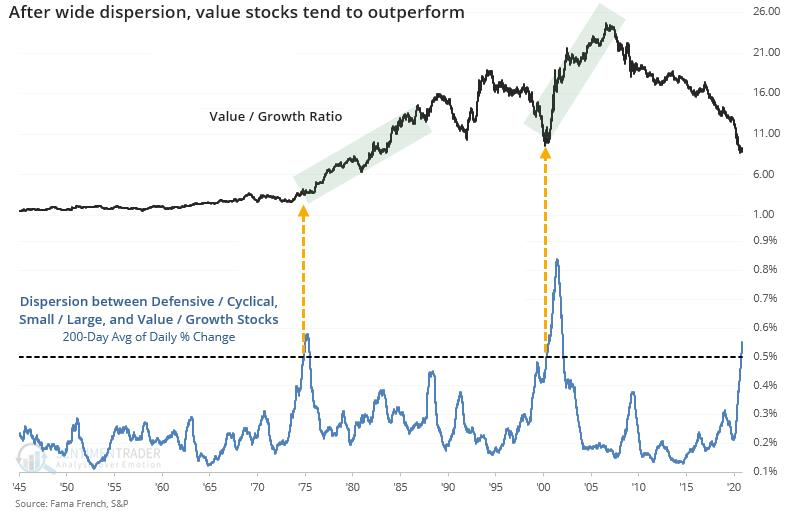
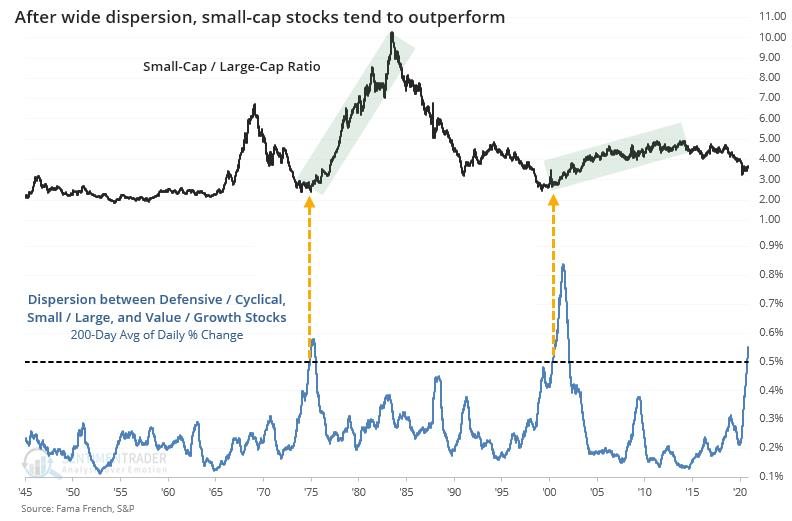
An analysis of the trade setup indicates that upside potential is significant. Historically, relative style performance such as value/growth is long-lasting and the magnitude of gains significant when the dispersion in style returns are large and begin to mean revert.
A similar reversal effect can be seen for the size effect, or the small vs. large-cap relationship.
Marketwatch reported that Jim Paulsen of Leuthold and Ed Yardeni believe that small and mid-cap stocks are relatively cheap, and exhibit superior fundamental momentum compared to large caps.
Smidcaps are relatively cheap
This reflects the fact that they’ve been persistently unpopular, despite the recent gains. “Their price action has not kept up with earnings performance,” says Paulsen. Since the end of October, forward one-year estimates for the S&P 600 small-caps have gone up almost 8%, compared to 1.5% for the S&P 500.
In other words, earnings estimates have gone up over four times as much, but stock prices have only gone up twice as much.
From their lows during May-June, the forward earnings of the S&P 500 grew 17%, compared to 35% for the S&P 400 smidcap stocks and 57% for S&P 600 small-caps, according to Ed Yardeni of Yardeni Research.
As of Nov. 24, large-cap S&P 500 stocks had a forward price earnings ratio of 22 compared to 19.7 for S&P 400 midcap stocks and 19.9 for S&P 600 small-cap stocks, says Yardeni. But the gap is effectively wider, given the greater potential for earnings growth among smidcaps going forward.
The bottom line: small-cap stocks have additional catch-up potential.
Here are the main takeaways from this analysis.
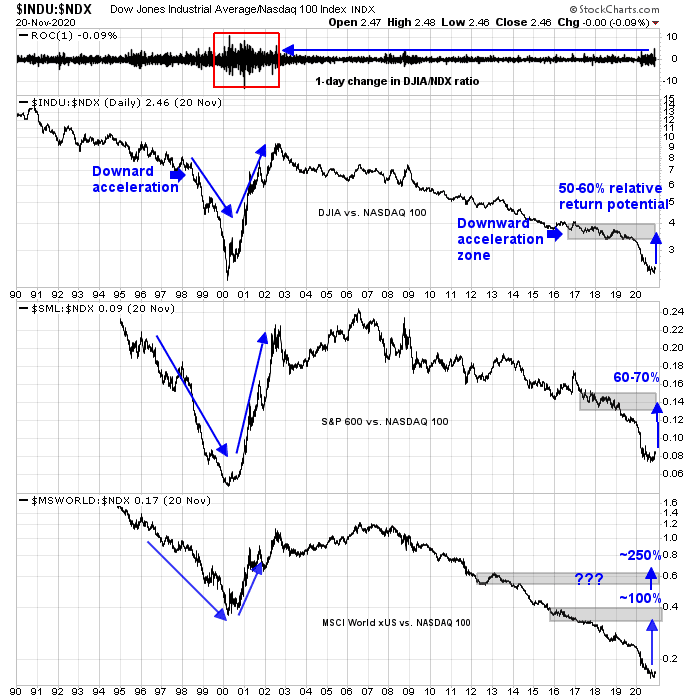
- Relative Return Magnitude Potential: The dot-com experience saw the DJIA/NASDAQ 100 plunge and mean revert to a level just above the spot when the ratio began to accelerate downwards, indicating the start of an investing mania. The magnitude of the current episode of downward acceleration was not as severe, and therefore the snapback should be less than the dot-com era.
- Cyclical trade: One rough measure of the cyclical trade is the Dow (old economy) to NASDAQ 100 (new economy) ratio. The aforementioned estimate technique of upside relative performance potential is 50-60%. If history is any guide, that relative return potential should be achieved within a 2-3 year time frame.
- Size Effect, or Small Caps: Large caps have been beating small caps for much of the last market cycle. Based on the same evidence, the upside potential is 60-70% over 2-3 years.
- Non-US stocks: US stocks have led the market upward since the GFC. There is ample evidence that global leadership is changing. However, it is difficult to estimate the magnitude of the potential relative rebound as there were two plateaus and subsequent downward declines in this cycle. If US to non-US stock relative performance were to recover to the first target level, it would translate to a relative gain of 100%. If it were to bounce back to the higher target, the potential relative gain can be as much as 250%.
Tech as laggards?
Is it not working? not needed?
Perhaps we need banks!
Tech has gone too far, too fast over the past few years. It’s catch up time.
Hear! Hear!
The rotation to Value/Small Cap and pro- Global ex-US, is exactly what my Factor and Momentum research is indicating. It was kicked off with a massive U.S. Combined Twist on November 9, Vaccine Day along with every major global market (ex-China). You’re research in today’s newsletter gave this shift a solid fundamental backdrop. Well done.
Veteran investors who respect market sentiment indicators will be thinking we have a very optimistic investor currently that might indicate a top with tears ahead as the Third Wave of the pandemic hits the economy. But there is no true optimism around Value stocks. They are mistrusted for good reason. We have seen many cries of wolf as gurus called for a Growth to Value shift and then failed. Value will be climbing a continuing wall of worry and mistrust for years as it outperforms by Cam’s 250%. Traders are into Value for a trade. The meaningful relative move is ahead of us is when global portfolio managers shift from their Growth tilt to Value. Any portfolio manager that still has a job, has been tilted to Growth and forced to hold FAANGs that they feel uncomfortable fundamentally owning.
I’d like to also emphasize that this new Value-friendly, Global-friendly market environment is young. I measure it from November 9, just a few weeks ago.
We can get event driven market dips (please Mr. Trump don’t do something nasty) including Covid economic dips at any time but bear market conditions are not evident.
Thanks. I appreciate the analysis from both Cam and Ken.
It certainly feels like the beginning of a new bull market. I think it was Jim Cramer who recently applauded the much-maligned Robin Hood crowd as investors who had the innate savvy as well as the guts to buy into the March lows when older/more-experienced fund managers were bailing. It may be wise to recognize that a new generation of investors are about to take the reins.
Let’s monitor TSLA and ARK funds along the way. Even the great rotation may not dent the performance of this group. The change in investor behavior is real. Just look at the time compression of these stocks’ performance. They may still outperform the new favorite sectors. But definitely the large stock indices (spy and qqq) are not the place to be.
Unless you own $tsla. With $tsla inclusion. Maybe it won’t lag nasdaq anymore
We sort of saw something like the current relative performance back in 2016, briefly.
I remember Canadian stocks did really well (the oil sector).