Mid-week market update: (I am publishing my mid-week market update a day early owing to the US Thanksgiving holiday shortened week)
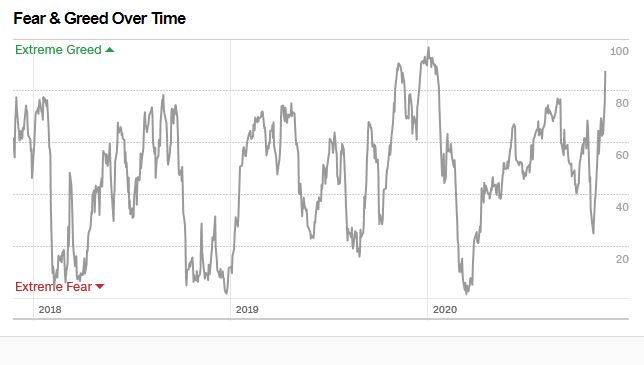
Should the bulls be worried? The Greed and Fear Index has surged to 88, which represents a warning of excessive bullishness.
As well, Willie Delwiche pointed out that his survey of sentiment indicators are all tilted either contrarian bearish or neutral. Delwiche concluded that “everyone knows about (& is positioned for) historical tendency for stocks to rally from here into year-end”.
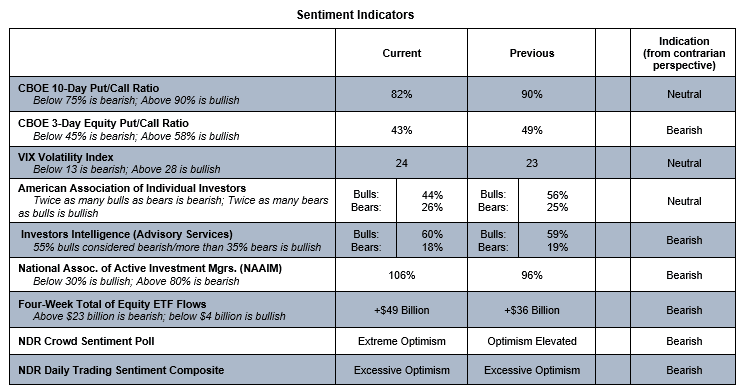
Asymmetric sentiment signals
Before you turn all bearish, I would warn that sentiment models work much better as buy signals than sell signals. The adage that “bottoms are events, but tops are processes” is especially true in this case. Panic bottoms are easy to spot using sentiment, but excessive bullish sentiment readings are not necessarily actionable sell signals. This char of the AAII bull-bear spread is just one of many examples of this effect.

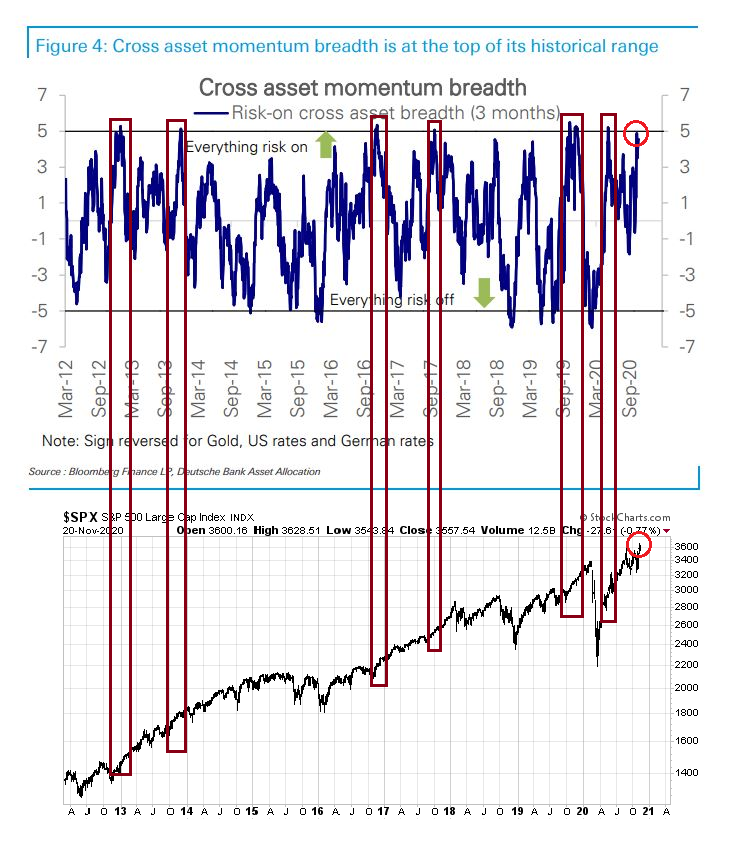
Deusche Bank recently observed that its cross-asset momentum analysis showed that virtually everything is in risk-on mode. That should be contrarian bearish, right?
Not really. Past episodes of strong cross-asset momentum breadth have been bullish for equities, not bearish. Traders should be jumping on the price momentum bandwagon, and not bet against it.
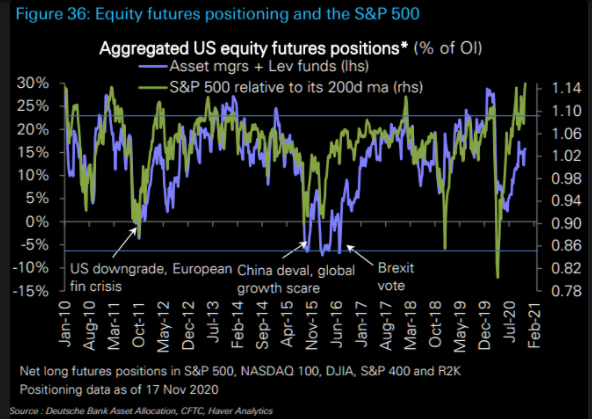
Further analysis of futures positioning shows that asset managers and leveraged funds are nowhere near in a crowded long yet, indicating that there is more room for the market to rise.
Be Thankful
So where does that leave us? It has been three trading days (and one weekend) since the Mnuchin announcement that he is withdrawing CARES Act support for a number of programs administered by the Fed. Since then, neither high yield (junk) bonds nor municipal bond spreads have blown out. Instead, the stock market has chosen to focus on good news, such as the upbeat PMI print, vaccine news, and the expected nomination of Janet Yellen as Treasury Secretary.

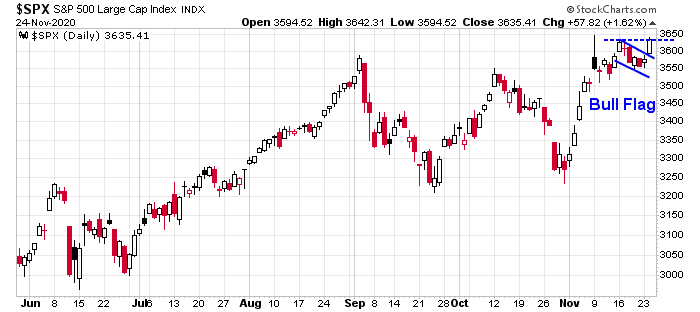
The S&P 500 staged an upside breakout through a bull flag and it is testing overhead resistance, which is constructive for the bull case.
The market has historically enjoyed seasonal tail-winds this week. Jeff Hirsch at Trader’s Almanac pointed out that the Wednesday before Thanksgiving and the Friday after tend to have strong bullish biases. Rob Hanna at Quantifiable Edges observed a similar effect and added that the Monday after Thanksgiving has been historically negative.

However, he observed that the market performed better when the momentum was weak on the Tuesday before Thanksgiving:
To determine whether the Wednesday – Friday Thanksgiving edge may have been front-run a particular year, you could examine price action. I have repeatedly found that a market that is oversold going into a strong seasonal period will perform better than a market that is overbought going into a strong seasonal period. A very simple metric that could be used in this case would be to see whether the market closed in the top or bottom half of its intraday range on Tuesday of Thanksgiving week. To do this I used SPY instead of SPX, because it had better intraday data.
Since 1993, I found that years in which SPY closed in the top half of its intraday range on Thanksgiving Tuesday posted a 9-5 record from Tuesday’s close to Friday’s close. When SPY closed in the bottom half of its range on Tuesday the performance over Wednesday to Friday was 10-1. And the average instance posted a 0.8% gain these years versus a 0.1% average gain the other years. So Tuesday’s action appears worth watching as we approach this potentially seasonally bullish period.
In a subsequent post, Hanna found that the market continued to be strong during the Thanksgiving period even if the previous Monday and Tuesday were positive. The win rate was 91%, and the only exception was 1987.

Subscribers received an alert today that my inner trader may be going long the market for a seasonal trade until Friday’s close should SPY close in the bottom half of its range. Based on the combination of the latest analysis from Rob Hanna, and the strength of the recent price momentum, my inner trader went long the market at the end of the day.
Disclosure: Long SPXL
Cam – Am I interpreting your last paragraph correctly – you went long end of day DESPITE the fact that SPY closed near the day’s highs? Are you saying that the strength of the price momentum outweighs the lower batting average seen with a strong close on Tuesday?
Never mind – I skimmed through the preceding paragraph/ table too quickly.
Probably not a good time to be working for an underinvested fund guy.
‘No one goes home tonight until I have a trading plan on my desk for Wednesday. And no one leaves for Thanksgiving until it’s executed.’
My problem with this is that the market has been going up since 2009, so it makes sense that buy sentiment would work better than sell. Hey the market is going up.
What happens in a bear market? Did the buy sentiment work as well? How about Oct 2007 to Mar 2009? My guess is that any sell sentiment would have had to work well in that time frame.
I have no idea when things will turn sour, but at some point they have to.
IWM/QQQ
IWM/QQQ
https://twitter.com/murphycharts/status/1331285968834408451
Premarket moves-> opened a position in EEM/ added to FXI/ BABA on weakness in emerging markets. Small positions in GLD/ GDX. Flyers in NIO/ RIG.
NIO off.
Reopening a position in XLE.
Easing back into JETS.
This is probably as good an entry as any back into XLF.
Adding to XLE.
I have no idea whether opening XLE/XLF represents a good entry – I just know I’m opening on significant weakness, which is all I’m looking for.
Will be adding to RYSPX at the 730 window.
Added to QQQ/ opened a position in IWM.
Dumping XLE/ XLF/ JETS for decent half-day gains.
Out of RIG.
Will be closing RYOCX end of day for about a +2% gain over two days.
Will close the majority of RYSPX to lock in a +1.4% gain over two days. Holding the remainder – which is actually not a choice as I’m unable to close the position opened this morning until Friday.
EEM/ FXI/ BABA off for minor gains.
Apart from what will be a minor position in RYSPX, will be holding no positions heading into Thanksgiving. That may be a mistake – but an overall gain of ~+0.5% for the week (with about 30% exposure) is good enough for me.
OK – couldn’t resist reopening a position in XLE ~39.3x.
Hulbert’s Sentiment Index now back above 70.
Fear and Greed=91.
2020: Happy Unthanksgiving!
https://twitter.com/YouTube/status/1332021330074595328
Initiation versus Exhaustion.
When it comes to spikes in advance/decline + % above whatever MA and the like, it’s often difficult to ascertain whether we’re looking at the start of another leg up, or the end of the current run. At least in the short term.
I don’t know whether the market continues up from here, or (reasonably) pulls back in order to launch the next leg up. I don’t even have a take right now – which is kind of a take in itself.
It’s been a good run since September 25 – the portfolio is up +9.136% over two months, with exposure levels ranging from 0% to 90+% and average drawdowns limited to less than -1%. It feels overbought here. Under similar conditions in the past, it paid off to step aside for a bit.
Those are my morning thoughts. I remain open to any plan that presents itself.
May take another swing at GLD/ GDX this morning.
Added to XLE.
Out of XLE.
I can’t help thinking as I scan through all of the prices displayed on my watch lists this morning – They call all be purchased at lower prices over the next few weeks.
Closing the remainder of RYSPX at the 730 window – assuming there is a 730 window today. If not, then at the 10 am window.
Cam- What’s your take here? Back to neutral by the close, or do you think the market has pitched another curve ball and spikes instead on Monday?
Reopening JETS @ 22.6x. Reopening BABA @ 276.5x.
Reopening XLE @ 39.
Still keeping an eye on oil. Iranian nuke scientist assassinated.
I sold out of everything else but XLE at this point.
Right. I still think we see lower prices over the next few weeks – but perhaps one more spike higher before turning lower.
Adding XLI.
Adding KRE.
Reopening EEM.
Reopening GLD.
Adding XLF/ adding to KRE.
End of day – will reopen positions in RYSPX (Rydex SPY) and RYDHX (Rydex DIA).
New position in RYEIX (Rydex Energy) – I’m betting the sector has pulled back far enough here.
My sense is that the traditional Friday rally will be replaced by a rally on what has traditionally been a weak Monday.
EEM at a new high.