The market lurched upwards on Vaccine Monday on the Pfizer-BioNTech news that it had found promising results in its vaccine trial. In a “Great Rotation”, investors piled into value stocks and abandoned former growth darlings. The Daily Shot published this chart from Goldman Sachs estimating how a successful vaccine rollout could impact sectors. But that’s not the entire story.

A duration trade unwind
For the uninitiated, duration measures the price sensitivity of an investment to changes in interest rates. The higher the duration, the higher the price sensitivity. Low coupon instruments such as zero-coupon bonds and growth stocks that pay little or no dividends have the highest duration.
In response to the vaccine news, bond yields surged. The bond market sold off, and the yield curve steepened. It was therefore no surprise that growth stocks weakened, while value stocks were bid. The following chart illustrates the duration effect of growth stocks. The relative performance of the NASDAQ 100 is inversely correlated to the 10-year Treasury yield.

Here is another way of thinking about the shift brought about by the Great Rotation. In a recession, investors bid up growth stocks when economic growth is scarce. Coincidentally, bond yields also fall in recessions. The vaccine news upended the recession narrative and brought hope for a sustained recovery. Bond yields rose, and a rotation began from growth into value.
Correlation isn’t causation, but these macro factors are intricately connected.
The reflation trade thesis
I have been monitoring the cyclical and reflation thesis for several weeks (see Buy the cyclical and reflation trade?) and I have been waiting for a confirmation that the global economy is on the rebound. My main criteria was a break the leadership of the Big Three factors, namely the US over global stocks, growth over value, and large-caps over small-caps. We now have definitive signs of breaks in all three factors. When the character of the macro environment changes, so does the leadership.
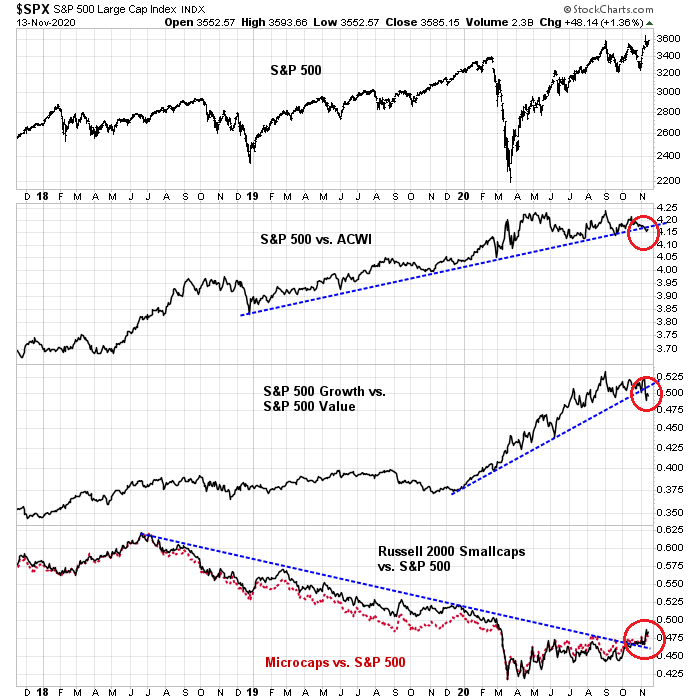
Drilling down to the changes in global leadership, we can see that US stocks remain in a well-defined uptrend against developed market stocks, as measured by MSCI EAFE. It is against EM equities that the S&P 500 is badly lagging, and against China in particular. Even if we were to eliminate China from the EM index, the S&P 500 broke an uptrend against EM xChina (bottom panel).

The growth and value relationship break is especially evident in the following analysis, no matter how growth and value stocks are defined. The large-cap growth/value ratios traded sideways since early September in line with the S&P 500. However, the small-cap growth/value ratios provided an early warning of the break, as they have been flat since early July and broke down in late October.

The reversal by market capitalization factor is equally clear. Both the S&P 600 and Russell 2000 have staged upside relative breakouts against the S&P 500.

Positioning for a cyclical rebound
The market had already been anticipating a global cyclical rebound, and the vaccine news made the thesis more definitive. Commodity prices are behaving better. Commodity indices have recovered above their 50 and 200 day moving averages (dma). More importantly, the cyclically sensitive copper/gold ratio is turning up.

US cyclical sectors and industries are also tracing constructive patterns in their relative performance. All are turning up. Semiconductors, which are both cyclically sensitive and considered to be growth-cyclicals, are on fire. Even Leisure and Entertainment, which supply consumer services that have been devastated by the lockdown, are ticking up.

In addition, EPS estimate revisions are extremely strong, indicating positive fundamental momentum.

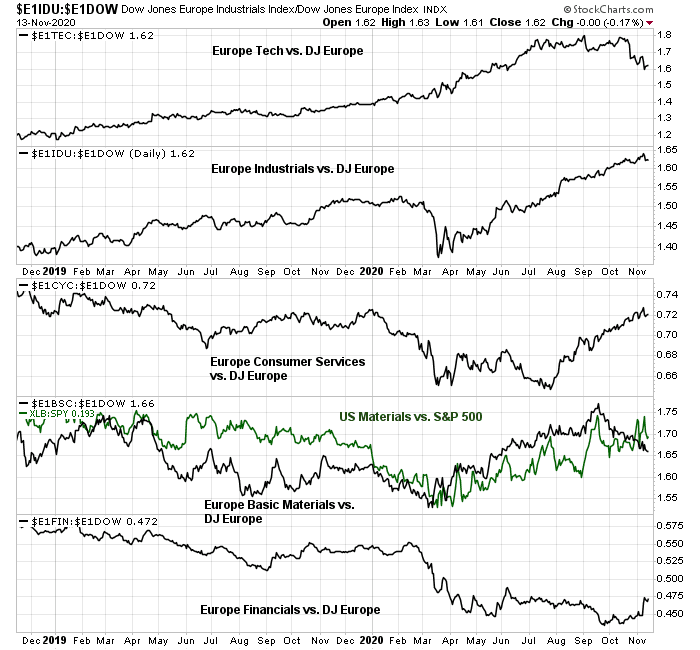
The relative performance of European sectors is exhibiting a pattern similar to the US market. The relative strength of technology stocks is rolling over. Industrials and consumer services are turning up, and basic materials are rising in a choppy manner in the same way as the relative performance of the US materials sector. Financial stocks remain laggards.
A Trend Model upgrade
As a consequence of the breadth and scope of market signs of a global rebound, the Asset Allocation Trend Model signal has now been upgraded from neutral to bullish. This also means that the Ultimate Market Timing Model, which turned bearish upon the signs of a recession and a risk-off signal from the Trend Model, is also bullish.
None of this depends on the success of the Pfizer-BioNTech vaccine. However, the market response to the Pfizer-BioNTech news is a window of how the market is likely to respond in a world where global health authorities begin to get the pandemic under control and growth returns to some semblance of normality.
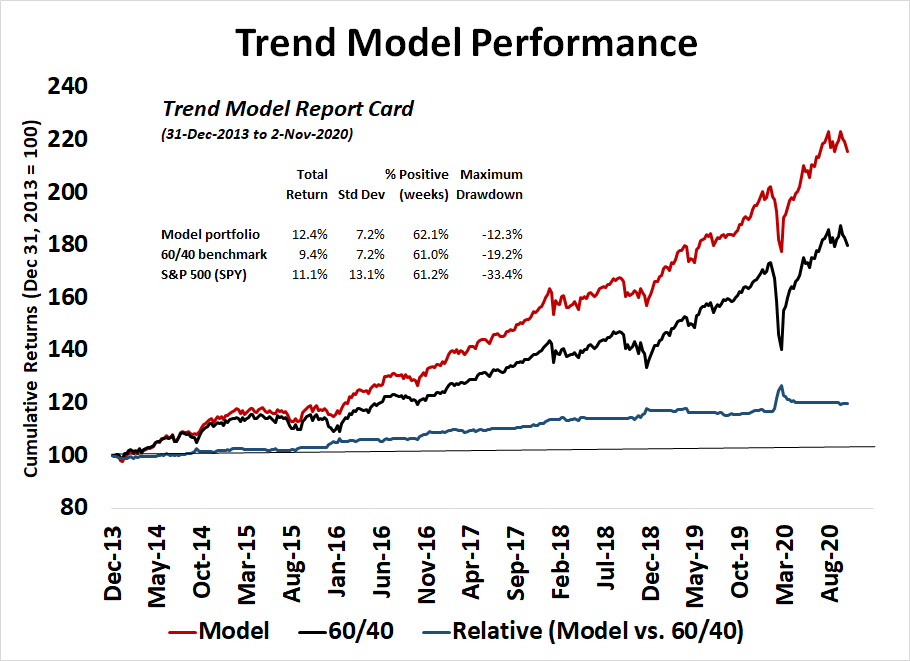
As a reminder, a simulated portfolio of actual Asset Allocation Trend Model signals using some simple asset allocation rules was able to achieve equity-like returns with balanced-fund like risk.
Equity bullish, with a caveat
With the Trend Model turning bullish, does this mean that investors should raise their equity weights? The answer is a qualified yes. Global market cap has reached an all-time high, which is bullish.

For US-focused investors, it’s another story. An analysis of the sector breakdown of the S&P 500 highlights a dilemma. Big Tech growth sectors comprise 43.4% of S&P 500 index weight, while cyclical sectors are only 19.9%. If the market experiences a rotation from growth to cyclical and value stocks, how will the S&P 500 be able to rise significantly if large-cap growth make up such a large portion of the index?


Cam, with the shift to non-US, could you give more attention to $-index and exchange rate action, please.
If non-US growth outperforms, dollar index will pull back. That said, the US may engage in less money printing (excluding the near term), that may keep the dollar index buoyant. Past the near term, dollar index may remain stable.
Thanks Cam for an excellent analysis of under the surface changes in the market.
So, US small and mid caps, value, and non-US equities, sound like the best place to be.
Seems like the S&P 500 may underperform the above classes going forward because of being tech heavy.
Tech innovation will likely continue, and ARKK seems like an ETF that needs to be purchased for putting some growth in portfolios.
Thanks Cam, for another useful analysis.
This article in the FT (currently free to read) echoes a lot of the points you make;
https://www.ft.com/content/5c1dcd07-06e9-46c2-b267-cd2c7ae459ea
Great read Cam. This contrasts with what I’ve seen on twitter – which is a lot of bearish sentiment.
I think retail sentiment is still weary of the rally from March lows and expects a retest based on the uncontrolled spread of COVID19.
Alex,
I agree, but might not just be COVID-19 lockdowns. Trump trying to split the country might be another trigger. Just spit ballin’
They’ve come up with funds that invest in almost any permutation of the US stock market. Is there an ETF/ Mutual Fund that invests in the total US market ex-large cap technology?
Rxchen, you could work out a pair trade that neutralized your tech exposure using an inverse tech etf like REW. Take VTI for example, which has a 27% tech weighting. If you wanted to offset that exposure you could buy 13.5% of REW since it’s a 2x inverse instrument (I would work through the actual math before doing this, this is just to illustrate the concept).
I wouldn’t recommend this pair though, as the article Brian linked from the FT, tech underperformance is not necessarily the same thing as tech cratering into the ground. Betting against tech since forever has been a sure path to disappointment.
I would use the tech exposure as the hedge to the uncontrolled Covid scenario Alex brings up, which I think is our biggest risk right now, besides the longer tail coup scenario Mohit call outs, ok or even longer tail China invades Taiwan scenario because they see we have basically stopped governing and this is their last chance to get this done while nobody is watching (in which case I hope everyone has enough bonds!).
DV mentions the ARKK funds, which I think are great, and own the other four that rollup to ARKK, instead of ARKK itself. All of these funds were rotated out of last Monday, but recovered throughout the week. These funds might see some damage in the value rotation, but over the long term I wouldn’t bet against them (this is like being so afraid of 20% drops you miss out on a 500% return over time).
I was looking up the market capitalization of our friends VTI and VT earlier today. What I like is we already have just under 25% exposure to mid/small/micro cap stocks in these funds. I was fretting all week about not having enough small cap exposure, but I am pretty happy with that level now that I have had time to work through it in the context of the rotation we are seeing. Of course the ‘problem’ with both etf’s is all the tech, 26% VTI vs 20% VT. And the top holdings of both funds are really similar. I have always gone heavy with VTI, but thinking I need a bigger allocation to VT than I have ever had in the past, not sure what that split will be yet.
I still think we have unfinished business to the upside after basing all week and breaking out Friday. Levels above include 3640 and 3700, below 3510 close enough to all the same levels we broke through on the way up.
Perhaps a 60/40 weighting of VXUS/ RSP.
that’s a great idea Rx – I actually owned RSP for a long time in one of my accounts (and watched it underperform forever), but that was one of the ETF’s I bailed out of earlier this year when raising cash. I just checked a SPY:RSP chart on stockcharts.com and you can see it has ‘broken out’ versus SPY. It has half the tech exposure of the S&P cap weighted, and more energy exposure. The biggest sector is financials though. May be time for to RSP to outperform again! I have some room to pick this one back up, I can’t believe I didn’t think of this one, thank you!
Jarad, instead of VT, you may want to look at VXUS to balance out your US exposure through VTI.
Jarad
VTI has 9.7 % mid cap and 3% small cap. One needs to increase allocation to these sectors, separately.
many thanks for the recommendations DV – I think you are right that if I just adjust the proportions I am holding of either VT or VTI I am still making a heavy bet on the top holdings of both funds, which are basically the same top holdings. Holding VXUS and VTI would provide a much broader total exposure while maintaining the mid/small caps exposure in VTI. I am getting 5.65% small cap on VTI, and 17.73% mid cap (at least based on the generic portfolio info I see on TD, Schwab, and Fidelity, but oddly I can’t find it on Vanguard itself). I wouldn’t mind having a bit more smallcap, but was happy to see it was at least that high. I have never looked at MGV before, will think on this one, thanks again!
MGV has limited tech exposure and rounds off what Cam has suggested here.
The market consensus is for rotation to cyclical sectors and value stocks (small and mid cap over large cap), selected ex US for market outperformance. The questions unanswered are how much of a rotation, for how long, and what would happen when rotation is ‘over’?
On the issue of tail risks of Trump coup, China invasion of Taiwan, etc. , first one is somewhat delusional; China has lot more to loose than gain in my opinion. How would one hedge for them anyway?