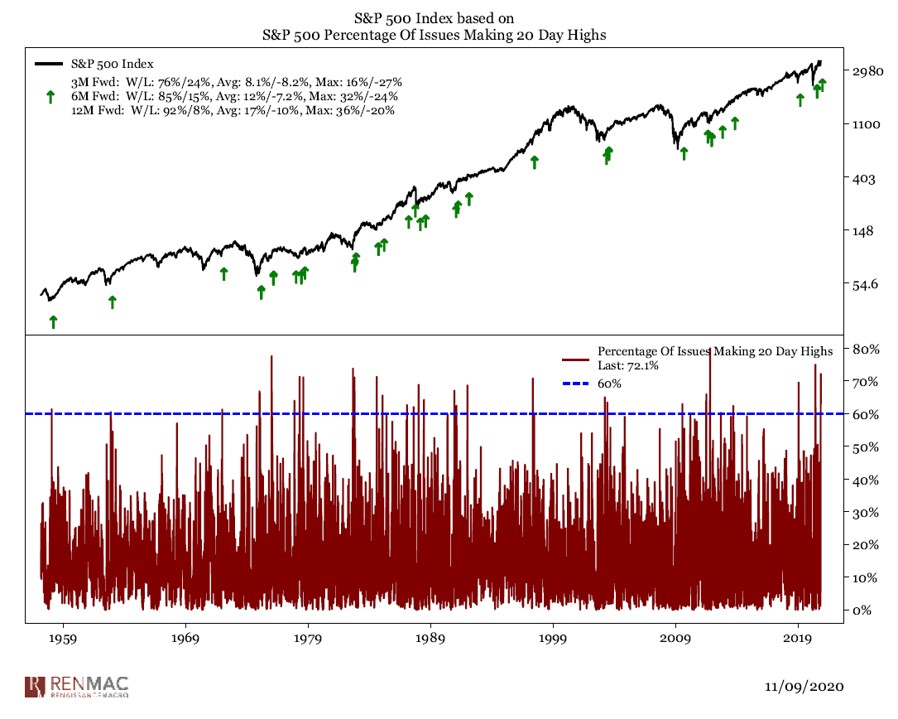
Mid-week market update: It is ironic that four weeks ago today, I pointed out that the market missed flashing a rare Zweig Breadth Thrust buy signal by one day (see Trading the breadth thrust). Market breadth, as measured by the ZBT Indicator, has to rise from an oversold level of 0.40 to an overbought reading of 0.615 or more within a 10-day window. Four weeks ago, it achieved that in 11 days, and the rally fizzled sooner afterward.
The ZBT buy signal is extremely rare, and it has occurred only six times since 2004. In all instances, the market has been higher in 12-months, though it “failed” on two occasions inasmuch as it pulled back before roaring ahead to new highs.

I observed on the weekend that we are on the verge of another possible ZBT buy signal (see Zweig Breadth Thrust and triple-top watch). The 10-day window ends today. Alas, the ZBT just failed to flash a buy signal. It topped out yesterday (Tuesday) at 0.606, which was just short of its 0.615 target, and it retreated today.
Despite the setback, all may not be lost.
DeGraaf breadth thrust signals
Willie DelWiche observed that the market achieved a DeGraaf breadth thrust signal on Monday.
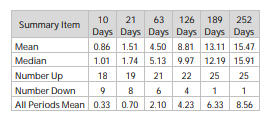
DelWiche calculated the returns from past signals, and the results showed a definite bullish bias.
On the other hand, the market experienced a Whaley Breadth Thrust, which coincided with a short-term top (see Trading the breadth thrust). What should we believe as the market tests upside resistance?
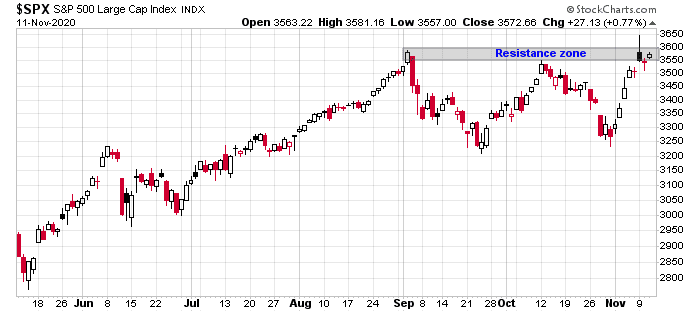
Testing resistance
The S&P 500 is struggling with overhead resistance. While I am keeping an open mind, near-term market action is more consistent with a stall than an upside breakout to new highs.
The NASDAQ 100 traced out an outside day on Monday, which is a sign of trend reversal. In addition, its relative uptrend against the S&P 500 was violated, leading to substantial technical damage that needs time to heal.

The chart below shows the relative performance of the top 5 sectors in the S&P 500. As Big Tech (technology, communication services, Amazon) comprise 43.4% of S&P 500 weight, it will be difficult for the index to significantly advance without Big Tech participation.

While I am open to the bullish scenario outlined by the deGraaf Breadth Thrust, I believe that the market needs a few days to pull back and consolidate. The intermediate-term outlook is starting to improve, but the market needs a breather.
With the rising second wave of infections in the US and the re-imposition of lockdowns, are we going back to the WFH trades from this spring? That means the incipient migration to cyclical stocks will reverse and the tech stocks will begin to rise again after some consolidation as Cam says.
Or, the investors have begun to look past the valley of economic dislocation over the next few months owing to lockdowns to the dawn of normalcy, thanks to Pfizer and other vaccines likely to appear from the successful trials in coming weeks and months?
I was having trouble understanding the market action today, but it may all make sense if you think Mrs. Lagarde’s speech was probably the key market event today. She said the ECB is going to keep buying assets for a long long time.
When the virus was wreaking havoc in Europe the ECB responded with large bond buying programs. The first company that benefitted from those ultra-low corporate bond yields was…Netflix. Apple also places corporate bonds in Europe to fund their buybacks. The Nasdaq heavyweights are beneficiaries of the large scale bond buying programs in Japan and Europe.
Look at the first chart, sure a melt up is possible, but c’mon doesn’t a correction fit the picture better?
Of the 4 ZBTs that were not fails, 3 of them occurred after a bottom.
I have serious doubts about the vaccines.
Well, the market will do as it will, even with that ugly candle, upside is possible, but my take is we go down before we go up.
As long as the EU keeps buying bonds and suppressing rates below 0, I think that mortgage rates here will stay low, which is good for us and homebuilders
0.606 versus 0.615.
There are many instances in life where that small a difference is significant, but I still have a hard time calling it an outright failure. I just don’t think that mathematical models of crowd behavior can support such fine distinctions.
To RxChen’s point, Cam, could show a graph how many failed ZBT signals have been there since 2004?
Something tells me that Rx has a good point and “failed ZBTs” should be analyzed. Thanks.
Not sure the definition of failed is. The chart shows all the ZBT buy signals since 2004. They are very rare.
You just told us the signal “failed” this week. That is the definition. Some of these “failed” signals were probably correct long term buy signals. One may need to lower the “sensitivity” of this signal than what was originally described.
Poor wording. It was a miss. A failure is a buy signal that didn’t work.
I can take a look at past misses but what’s the point? It’s like what happens to a candidate after just missing to win an election but a close margin.
The “failed” signals that were very close, were probably true buy signals. This needs to be looked into IMHO.
2. The “sensitivity” of such a test may be dialed down (like WBT), and may make the test more useful.
3. I suggest running the “near misses” with the same parameters as the original description and see how many bull phases were missed.
4. Tweaking the ZBT to make it less rigid (more sensitive, less specific) may be another can of worms. Haley and WBT probably are in the more sensitive category. Thanks.
Trimming BABA. Adding to XLE/ JETS.
Adding back to BABA.
Bumping up the RYSPX position at the 730 window.
Another EV name that might be worth playing – AYRO.
Adding exposure, but now using VT as my trading vehicle.
Feels like the kind of selloff designed to shake out anyone who opened positions on Monday.
I’ll refrain from taking on additional exposure in case I’m wrong – although if I’d exercised more patience I would be adding here.
AYRO taking off.
XLE and BAC have been real dogs all year. My trades have probably averaged out flat due to a few big wins, but I’ve paid stiff fees to play.
There is an outside chance that we will see the follow-through rally we’ve been waiting for all week on Friday.
Just saying.
Friday afternoon has been ramp time for awhile now, wouldn’t be surprised at all by that. Thus far we continue to hold 3510. This whole week has been themed “consolidation above 3500” after the random mess on Monday. If we ramp tomorrow our weekly candle wouldn’t look ‘as bad’ maybe? I could truly see this go either way with a hundred+ point move in either direction completely reasonable. If I had to pick a bias it would be up just based on the solid consolidation all week. What is our going to be our trigger to get this party started in either direction?
I don’t know that a trigger is required. If the media needs a reason, they’ll usualy find one. ‘Turnaround Friday’ works for me.
On second thought, we’ve already had the trigger in the form of a ZBT ‘lite.’ That kind of breadth thrust sends a strong message about crowd psychology right now. Whether the follow-through occurs tomorrow or next month or next year or only after a steep pullback – well, that’s why trading is a game of odds.
IMO, we’ve only seen some minor churning over the past three days. I think it bodes well for continued upside soon.
Opened a position in RYDHX (Rydex DIA) end of day.
It’s a tale of two markets, the growth and the value stocks. The Nasdaq started to weaken after Powell & Lagarde stopped talking. The recent rally in the Nasdaq may have been sparked by the ECB symposium in Sintra, but it may be a countertrend rally – and it was not strong enough to “repair” the growth vs value trendline that was finally broken this week. The cyclical stocks have seen the brunt of the selling yesterday, but investors who have remained sceptic about value stocks may be tempted to jump on the train, now that the growth vs value trend change is finally kind of confirmed on the charts.
Of course we could see a growth rally and a value train wreck tomorrow, but that is not what the charts are saying. The Nasdaq has failed to break trendline resistance on the daily chart and while some smaller stay-at-home stocks were strong, the weakness of other “covid-proof” tech stocks like AMZN or PYPL was noteworthy. The charts of those stocks are not broken, but even on a day with headlines about “covid hell” and nationwide lockdowns investors were not willing to convincingly reverse the growth vs value trend break. XLI vs XLK also had a pullback but that ratio remains constructive (industrials did not lose all of their vaccine spike outperformance)
Today had one of the sharpest drops since June in the fast versions of the Summations Indices, SPSI (SPX) and NASI (NDX) shown here in the lower panel, SPSI in red and NASI in green. The 10 day EMA of Upvol/Dnvol ratio also took one of the sharpest drop since 06/09/20 for SPX. Strategy models also suggest the shorts have a play in the 2-day time frame chart for the SPX and the weekly time frame chart for $COMPX. Notice the divergence of $COMPX price to its summation index where higher price was met with a lot lower breadth. A lot of these short signals could be early and the top could still cycle through another high(s) before more shorting come in. Just putting it out there for anyone looking at how the market could look from the short side.
https://justpaste.it/ls/8fd2d/2zdpr08dbfbquww5
Updated Friday 11/13/20 at the close; same link.
Well done by the bulls on Friday, completely reversed the price loss of previous bar and more. More gains expected in the coming days. You can’t argue with price and the Upvol/Dnvol ratio (has also) triggered a buy at the close, qualifying as an Upvol buy threshold.
Adding to SNAP.
Bumping up exposure to RYSPX, this time on strength.
If I had to guess, we close at the highs – at levels significantly higher than current levels.
Reopened NIO on the drop to ~45.
Trimming back on XLE/ JETS. Adding to NIO.
Still sensing a great deal of disbelief in today’s rally. The SPX is likely to pull back once it hits 3600, but it has room to run ’til then.
Trimming back on RYSPX end of day, as the SPX is closing in on 3600.
Trimming back on VT as well.
Closing AYRO.
Money printing has brought us to the point where those who followed rules lost out. This train of money printing probably stays with us for a long time and we may be in the early stages of a very long process of fiat currency that gets printed, every day.
Keep buying hard assets and gold and sell the $.
Despite today’s rally, Hulbert’s Sentiment Index barely budged. A tailwind for Monday.
Don’t fool yourself. Enuff money printing will move anything!