Preface: Explaining our market timing models
We maintain several market timing models, each with differing time horizons. The “Ultimate Market Timing Model” is a long-term market timing model based on the research outlined in our post, Building the ultimate market timing model. This model tends to generate only a handful of signals each decade.
The Trend Asset Allocation Model is an asset allocation model which applies trend following principles based on the inputs of global stock and commodity price. This model has a shorter time horizon and tends to turn over about 4-6 times a year. In essence, it seeks to answer the question, “Is the trend in the global economy expansion (bullish) or contraction (bearish)?”
My inner trader uses a trading model, which is a blend of price momentum (is the Trend Model becoming more bullish, or bearish?) and overbought/oversold extremes (don’t buy if the trend is overbought, and vice versa). Subscribers receive real-time alerts of model changes, and a hypothetical trading record of the email alerts are updated weekly here. The hypothetical trading record of the trading model of the real-time alerts that began in March 2016 is shown below.

- Ultimate market timing model: Sell equities
- Trend Model signal: Neutral
- Trading model: Bullish
Update schedule: I generally update model readings on my site on weekends and tweet mid-week observations at @humblestudent. Subscribers receive real-time alerts of trading model changes, and a hypothetical trading record of those email alerts is shown here.
Subscribers can access the latest signal in real-time here.
Breadth Thrust, or triple top?

ZBT history
A “Breadth Thrust” occurs when, during a 10-day period, the Breadth Thrust indicator rises from below 40% to above 61.5%. A “Thrust” indicates that the stock market has rapidly changed from an oversold condition to one of strength, but has not yet become overbought.According to Dr. Zweig, there have only been fourteen Breadth Thrusts since 1945. [Ed: there have been a few more since that was written]. The average gain following these fourteen Thrusts was 24.6% in an average time-frame of eleven months. Dr. Zweig also points out that most bull markets begin with a Breadth Thrust.
The market went oversold on the ZBT Indicator and recycled off an oversold reading on October 29, 2020, which is day 1. The market has until next Wednesday, November 11, to reach an overbought condition at the 0.615 level and flash a buy signal.

Here is the history of ZBT buy signals since 2004. The signal is rare. There have been six signals in the last 16 years. In all cases, the S&P 500 was significantly higher a year later. In four of the six cases, the market never dipped significantly after the buy signal and surged upwards. Two of the buy signals might have been considered to be weak, as they pulled back to test previous lows before rising further.

As a reminder, I issued a buy signal in January 2019 when this indicator last flashed a buy signal (see A rare “what’s my credit card limit buy signal).

Rob Hanna at Quantifiable Edges provided hope that the positive price momentum can continue into next week. He observed that ” strong 4-day win streaks that required at least 3 days close up 1% or more” tended to see the market advance further. Day 1 of the study was last Friday. In that case, there is a good chance that the ZBT buy signal will be triggered next week.

This is something to keep a close eye on.
Triple-top resistance
On the other hand, the S&P 500 is approaching a triple-top resistance level, which is defined by tops in September and October. Market internals indicates a mixed picture. Some are supportive of an advance, others are showing signs of weakness.
The chart of the large-cap S&P 500, mid-cap S&P 400, and the small-cap S&P 600 shows that strength is concentrated in the smaller companies. The S&P 400 has already broken out, and the S&P 600 is testing a key resistance level. These are constructive signs for the overall market.

On the other hand, other breadth indicators are flashing bearish divergences. Even as the S&P 500 advanced, the percentage of bullish stocks, and the percentage of stocks in the S&P 500 above their 50 dma are ominously showing lower highs.

The market experienced an unusual condition last Wednesday, the day after the election. The S&P 500 rose over 2%, but advances were less than declines, and advancing volume lagged declining volume. The blogger Macro Charts pointed out that single-day signs of weakness are not necessarily bearish, but we should watch if market breadth strengthens or weakens in the coming days.

Neutral sentiment
Sentiment models are not helpful in determining market direction. Readings are neutral, and could be supportive of further gains, but there is no rule that states the market has to rise when sentiment is neutral.
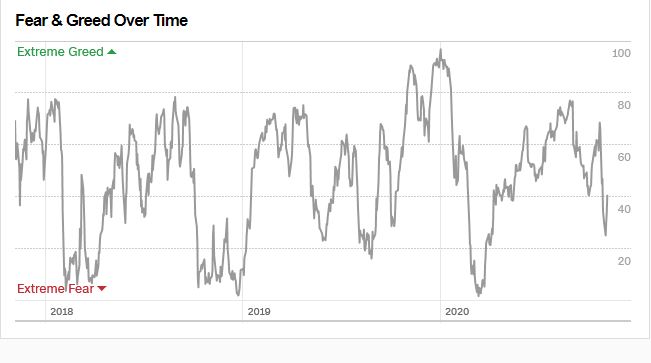
The Fear and Greed Index stands at 40 after recovering from a near-oversold condition. Arguably, the combination of neutral sentiment and positive momentum is bullish, but I don’t consider that a high conviction call.
Similarly, II Sentiment is also neutral. The bull-bear spread is falling, and % bulls have retreated from a crowded long condition

A new bull?
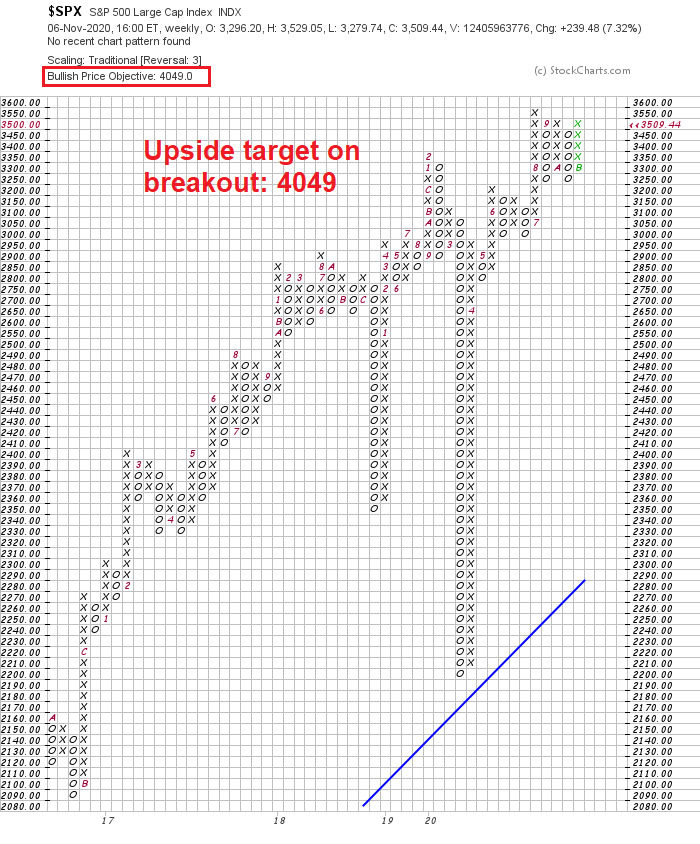
In conclusion, the market is testing resistance and it is on the verge of an upside breakout. If the bulls can show further upside momentum, it could be the signal of a fresh cyclical bull. If the S&P 500 were to stage an upside breakout, the point and figure objective on the weekly chart is 4049.
On the other hand, this could be a fake-out, and the bears could defend key resistance levels. The market is short-term overbought, and the advance looks very extended. Keep an open mind in the coming days, and monitor developments, such as the progress of the ZBT Indicator, closely.
My inner investor is still neutrally positioned at the target asset allocation prescribed by investment policy. My inner trader dipped his toe in on the long side on Friday.
Disclosure: Long SPXL
Every bull market in my lifetime has started the same way – no one recognizes it as such, and few believe it to be the case. There’s really no way around it, as that’s how how all new starts in life unfold.
Cam, for the record does your ZBT contain unchanged issues in the denominator ? It is my understanding that the original work did contain this. Obviously, this matters.
The last ZBT without the unchanged peaked at .614 in 11 days, compared to a peak of .596 in 10 days for the (true) one.
I made my own real-time estimate which does not but I believe the Stockcharts version does
Looking at the days of breadth on 2%+ days, it looks like the ones at the bottom of the spectrum did not do well, like your blue boxes. Did we have an exhaustion move up on usual volume last week.
There are mope things that can go wrong than right, but who knows?
JMO, but I think that’s what we’re looking for. Nothing worse than a ‘perfect’ setup. The best ones are imperfect, and sometimes the more imperfect the better.
The reason being that a perfect setup will attract too many traders. It’s best, as Cam has done, to open cheater positions while others are still waiting and then add to them as they begin jumping in and finally chasing.
My guess is that the economically sensitive stocks that have been a drag on indexes would surge if Mitch and fellow GOPs in the Senate would admit Biden won and quickly pass a compromise support bill for pandemic suffering people and businesses. This would show that they will not just block things like they did with Obama and send the economy into a tailspin. They would show a pro-economy bi-partisan attitude.
Then the market has wings.
yes, but that is a big if….either way, we will have some volatility in the coming weeks…up or down I dunno, but my bias is to the downside
Cam delivered a great pitch, which Jarad used to hit one out of the park.
Nicely done!
Thank you Rx! What a timely call from Cam, congrats to everyone who got in! I did not expect we would get this close to 3700 so quickly. Yikes, this is where I would have ultimately started selling, need to recalibrate expectations here. I see support back at 3590 if we continue to pull back here, and up to 3680 for next resistance. Good luck to us all today!
To be honest, I’ve already closed all the positions I’m able to. In addition, I’ll be closing RYSPX at the 730 window, and VTIAX end of day.
Why? After four successive gaps up last week, today’s gap up feels more like a short squeeze. I think we’ll get the ZBT buy signal – but I’m pretty sure a more attractive LT entry point lies ahead. If I’m wrong, no worries – there will be plenty of time to climb aboard.
gain locked in, you’ve already won the day, congrats! I am only regretting not selling at the open some lotto SPY calls I bought on Friday, but otherwise feel good holding here. There is strong resistance ahead, but what if we break through and no one is ready for it? High odds you are right that we will have entry points below from here. Looking at the winners and losers today, could the vaccine announcement be the catalyst we needed to get the needed ‘new leadership’ in the bull market?
XLE/ XLF. Unreal.
Love it when the 38.2 year cycle bottoms.
Have to wonder if vaccine announcement is a ‘sell the news’ event.
‘Buy at the sound of viruses, sell at the sound of vaccines’. Something like that.
Couple of weeks ago, everyone was extolling the Livermore ‘Upside Down markets’ ‘Bad News is Good News’ write-up. No longer relevant?
Anyone buying QQQ today? I think buying XLE/ XLF toay at 9-15% premiums might actually give you a better return in three months.
Imja Tse?
https://en.wikipedia.org/wiki/Imja_Tse
Interesting thoughts, len g
I was hoping we would squeak by holding 3590, but not even 3570 held. Not a great ending or candlestick on the day, see what happens at 3520, otherwise all the same levels apply on the way back down I guess! 🙂
TNX closed right at a declining monthly tops line. (Drew a line to accentuate this, but it doesn’t seem to show up.)
https://tinyurl.com/y4szb4ad
1.25 next?
Trying BABA @ 271.xx.
Off ~266.
Turning bearish.
I’m hearing from some dependable investors (not given to emotional outrage) that there is a good chance that there is a growing chance that Trump will win the recount and court cases, and be the next occupant of the White House.
Is anyone else seeing some tangible evidence that points to that outcome?
anything can happen. Bush got a bunch of votes thrown out in his favor back in 2000.
this seems impossible Sanjay, he is so far behind in the states that matter that there is no tangible path to victory even if he did win court cases in one or more states. The reason these court cases wouldn’t matter is they seem to be fighting for a few hundred votes here or there, nothing that would change the result in any state. Previous recounts in Wisconsin in 2016 yielded a shift of around 161 votes, he is behind tens of thousands of votes there and in other states where he might want to challenge. Regarding the cases, thus far I haven’t seen anything resembling something the courts could remedy. There is much bluster regarding voter fraud, but when it comes time to show the evidence in court there is no substance. Barring an outright coup, or shenanigan’s with the electoral college, there is no path to victory for Trump at this point.
The child must throw his tantrum
Meanwhile, here is what reputable news organizations are finding: nothing
https://www.nytimes.com/2020/11/10/us/politics/voting-fraud.html
‘Reputable news organizations’ = tells you what you want to hear.
For three years ‘Russia! Russia! Russia!’
Major media nothing but far left political ideologues, pushing a false narrative, because they couldn’t accept the results of the 2016 election.
https://www.youtube.com/watch?v=lw2BVI9OhC4
‘Reputable news organizations’
https://www.youtube.com/watch?v=f1ab6uxg908
Thank you all. I haven’t seen anything at any reputable sources though the alternative channels are buzzing with conspiracies.
Trump’s electoral vote count stands at 232.
This thread outlines as possible path from here.
https://twitter.com/realChrisMBowen/status/1325487512987586561
Since the above was written, Biden’s margins have expanded somewhat in PA and GA. AZ has contracted some and likely will contract some more, but from what I’ve read, not enough to swing to Trump, plus AZ is apparantly has extremely hard to trigger recount rule.
Using multiple replies because of the lame handling of links.
Can listen to this if you have the time:
https://twitter.com/Gingrich_of_PA/status/1325274306327109633
The PA situation is interesting. Supreme Court said ‘isolate the ballots received after election day, we’ll decide later’ PA ignored as I understand it, if SC disqualifies these ballots, result = ?
5 days after losing, Trump’s advisors are increasingly convinced that their efforts to overturn Biden’s election will fail, report says
https://www.businessinsider.com/trump-advisors-pessimistic-about-overturning-biden-win-wapo-2020-11
‘Reputable news organizations’
stenography
https://www.youtube.com/watch?v=E96lAHygeIU&feature=youtu.be
Sigh
Back to reality for me
* ‘reality’
Interesting (counter)points, ‘reputable news media’, ‘reality’, ‘trusted sources’, ‘insiders’, and what not. Lol.
More seriously though, it appears as though the ZBT signal may be triggering a buy moment. We shall wait Cam’s analysis later today on this.
A good article on the history of voter fraud in the US.
Tons of links to studies done.
https://www.theroot.com/america-s-biggest-conspiracy-theory-is-real-the-racist-1828691528
Taking swings at BAC/ JETS/ BABA/ NIO.
Reopening a partial position in RYSPX at the 730 window.
Adding FXI/ XLE.
I think we run up into the holidays but who knows in this environment.
Backtested 3510 and back up over 3570 now coming into resistance at 3580. Next support at 3555 below here. What’s funny is this is exactly where I was hoping we would get to this week before all the noise from the gap up on Monday… we just took a very strange path to get here today. Also, I can’t believe we aren’t going to get the Zweig thrust signal today after all that has happened this week!
It’s not over ’til it’s over.
true enough Rx! 3650 up next if we happen to break through, I bet that would do it. I would be terribly surprised if we went there directly instead of consolidating here though, but always a chance…
What’s Cam’s latest alert?
Cam took profits in his call from last week in anticipation of our missing the Zweig thrust signal today. He said he could buy back later if we get it. His risk/reward is saying step to the sidelines for the inner trader. Trading model is neutral.
OK, thanks.
The market has been better than usual at faking us out. I think it makes sense to have partial positions in place .
I was having trouble understanding the market action today, but it may all make sense if you think Mrs. Lagarde’s speech was probably the key market event today. She said the ECB is going to keep buying assets for a long long time.
When the virus was wreaking havoc in Europe the ECB responded with large bond buying programs. The first company that benefitted from those ultra-low corporate bond yields was…Netflix. Apple also places corporate bonds in Europe to fund their buybacks. The Nasdaq heavyweights are beneficiaries of the large scale bond buying programs in Japan and Europe.